Market Recap
U.S. Markets:
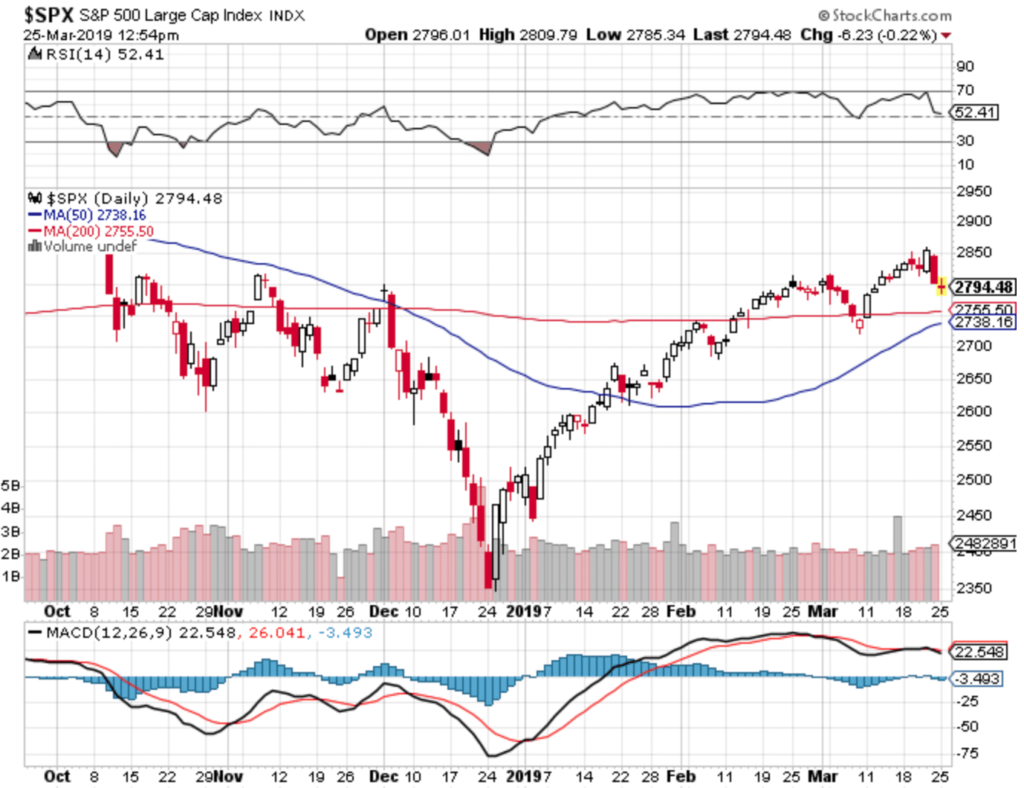
U.S. stocks closed lower for the week following a steep sell-off on Friday that took the broad market S&P 500 index down from nearly 6-month highs reached the day before.
The Dow Jones Industrial Average gave back all of last week’s gains by falling 346 points, or -1.3%, to close at 25,502.
The technology-heavy NASDAQ Composite fell 0.6% ending the week at 7,642.
Smaller cap indexes fared the worst with the small cap Russell 2000 declining -3.1% and the mid cap S&P 400 falling -2.2%, while the large cap S&P 500 ended down -0.8%.
International Markets :
Canada’s TSX finished the week down -0.3%, while in Europe major markets finished the week in the red. The United Kingdom’s FTSE gave up -0.3%, France’s CAC 40 fell -2.5%, and Germany’s DAX retreated -2.8%.
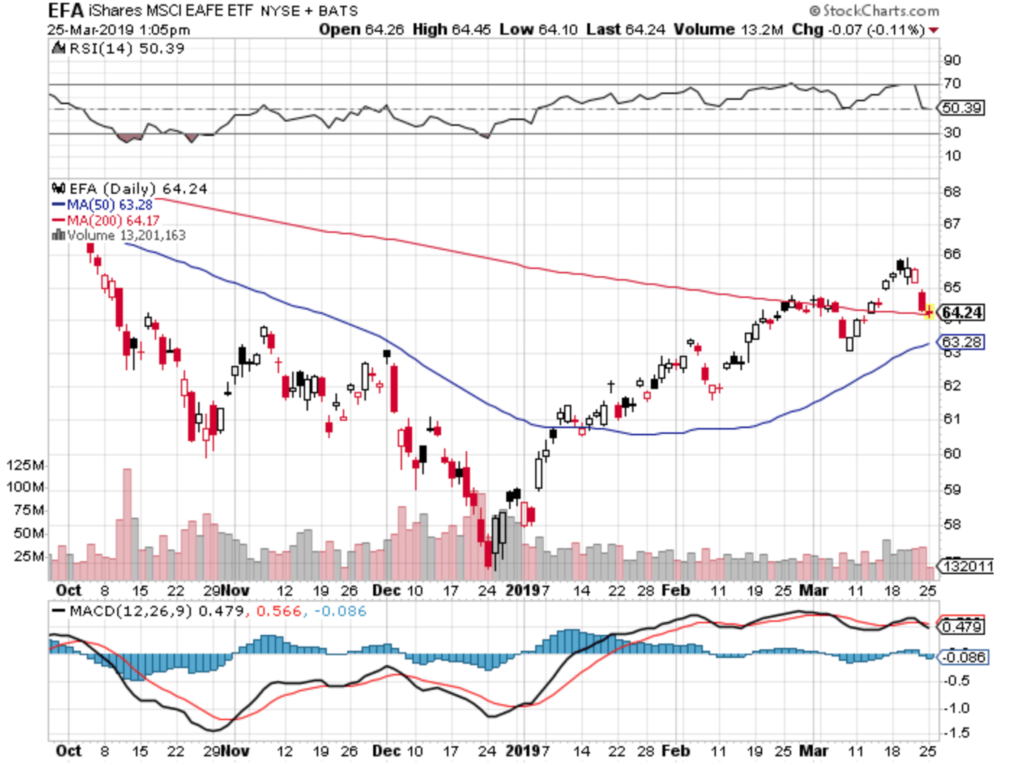
In Asia, China’s Shanghai Composite finished up a second consecutive week by gaining 2.7%. Japan’s Nikkei also finished the week up by 0.8%. As grouped by Morgan Stanley Capital International, developed markets fell -1.4%, while emerging markets gave up -1.5%.
Commodities :
Precious metals rose in response to the weakness in the equities markets. Gold gained $9.40, closing the week at $1312.30 an ounce, a gain of 0.7%. Likewise, silver added 0.5%, ending the week at $15.41 per ounce.
Energy closed higher for a third consecutive week. West Texas Intermediate crude oil rose 0.9% to close at $59.04 per barrel.
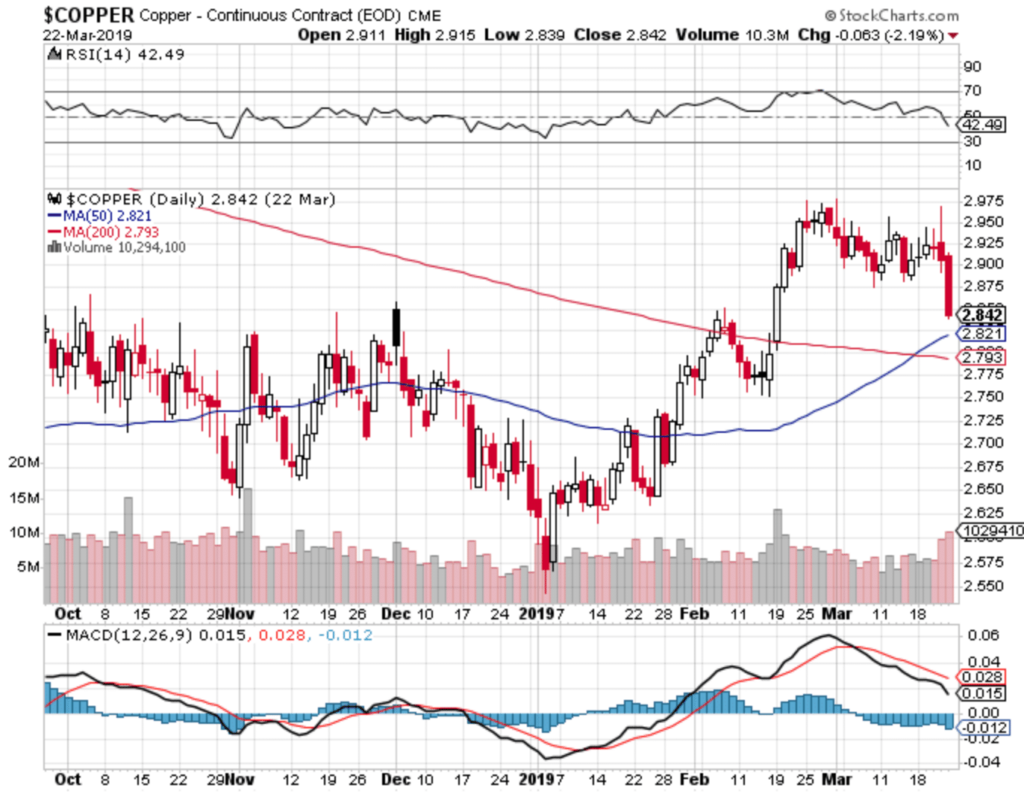
The industrial metal copper, seen as an indicator of global economic health due to its wide variety of uses, fell -2.2% last week. Copper has been down 3 out of the past 4 weeks.
U.S. Economic News
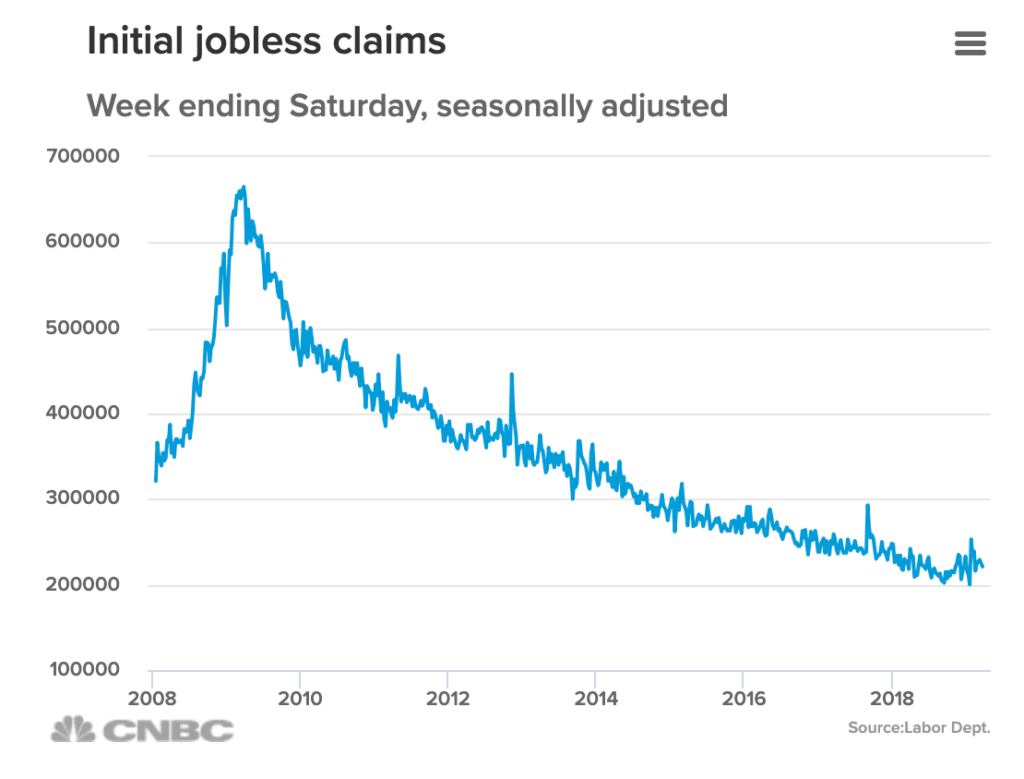
Despite a seemingly slower U.S. economy, the labor market remains resilient according to the latest figures. The Labor Department reported the number of Americans filing for new unemployment benefits last week fell by 9,000 to 221,000.
Economists had expected claims to rise by 4,000 to 225,000. The less volatile monthly average of new claims rose by 1,000 to 225,000. Both numbers remain far below the 300,000 threshold most analysts use to indicate a “healthy” jobs market. Continuing claims, which counts the number of people already receiving benefits, fell by 27,000 to 1.7 million. That number is reported with a one-week delay.
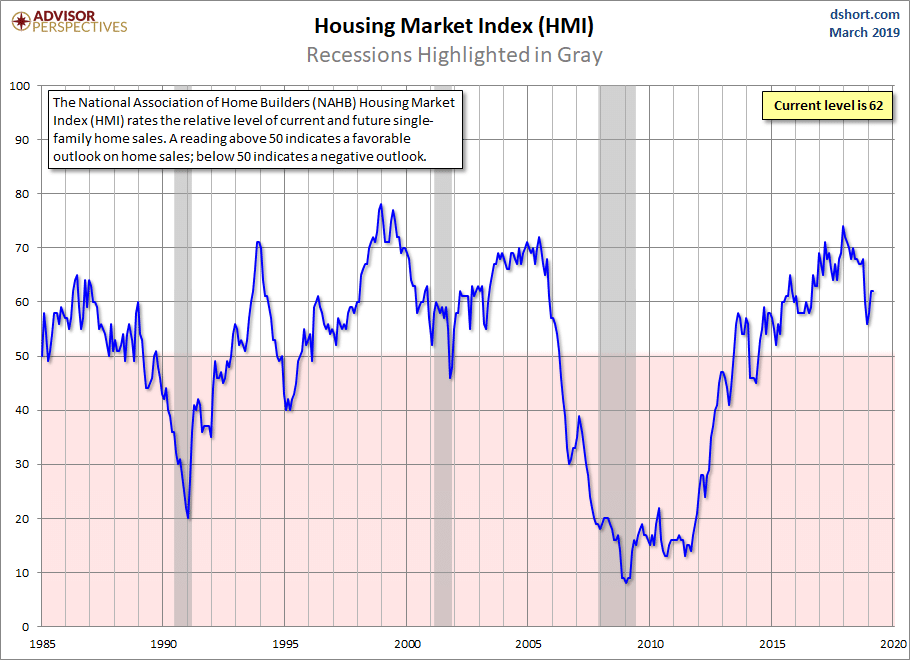
Sentiment among the nation’s homebuilders remained flat in March as conditions continue to stabilize following some weakness last year. The National Association of Home Builders (NAHB) reported its monthly sentiment index for March remained unchanged at 62, missing economists’ forecasts for a one-point increase to 63.
In the details of the report, the index that tracks current sales conditions rose 2 points to 68, and the gauge of sales over the next six months jumped 3 points to 71. However, the index that measures the traffic of prospective buyers fell 4 points to 44. Economists consider the sentiment index an early read on future new construction. “Builders report the market is stabilizing,” NAHB said in its release. Analysts immediately noted that “stabilizing” isn’t the same as “growing.”
Sales of existing homes rebounded in February, surging 11.8% and hitting an 11-month high. The National Association of Realtors (NAR) reported existing-home sales ran at a seasonally-adjusted annual rate of 5.51 million last month, its biggest month-over-month increase since December 2015.
The reading easily beat the consensus forecast of a 5.12 million pace. In the details, the February pace of sales was 1.8% lower than a year ago, and the median sales price during the month was $249,500, 3.6% higher compared to a year ago. First-time buyers accounted for 32% of sales in February, still well below their long-time average of 40% and making zero progress since the crisis.
Ian Shepherdson, chief economist for Pantheon Macro noted that the February sales numbers, if sustained, “challenge the market narrative that housing is going to be a drag on the economy for the foreseeable future.”
New orders for domestic manufactured goods rose less than expected at the beginning of the year and shipments continued to fall further, according to the Commerce Department’s Factory Orders report. The report serves as further evidence of a slowdown in manufacturing activity.
The report showed factory goods orders edged up 0.1% in January, after rising the same amount in December. The data showed decreases in orders for computers and electronic products, as well as declines in demand for primary metals and fabricated metal products.
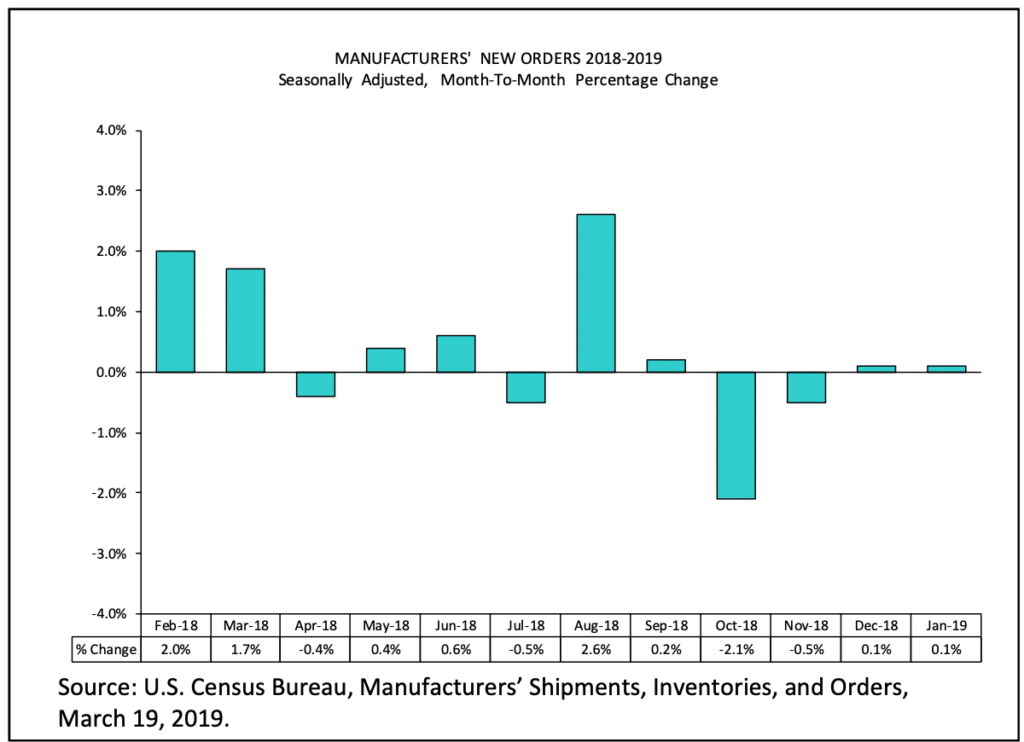
Economists, however, had expected a 0.3% increase. Shipments of factory goods fell 0.4% after dropping 0.2% in December. They have now declined for four consecutive months, the longest streak since mid-2015.
A survey of economic conditions in the U.S. rose last month for the first time in five months. The Conference Board reported its Leading Economic Index (LEI) increased 0.2% in February, potentially a sign that growth is poised to pick up a bit after a slow start at the beginning of the year.
The improved reading was spurred by higher stock prices, lower interest rates, and availability of credit. However, those gains were offset by weaker job creation and somewhat higher, though still low by historical standards, levels of layoffs. Six of the 10 components that compose the leading index rose in February. The consensus was for only a 0.1% increase. Of concern, however, is that the LEI is now slowing on a long-term basis.
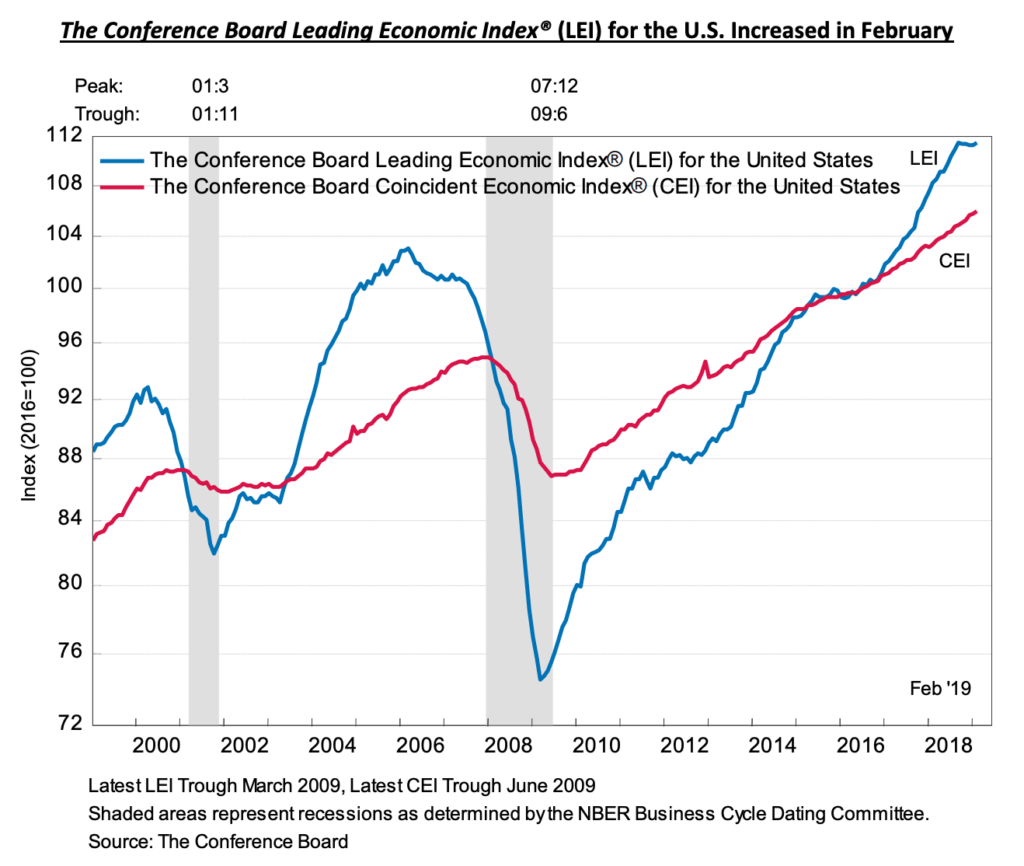
Ataman Ozyildirim, Director of Economic Research at the board stated, “Despite the latest results, the U.S. LEI’s growth rate has slowed over the past six months, suggesting that while the economy will continue to expand in the near-term, its pace of growth could decelerate by year end.”
Business activity in the private sector continued to decelerate in March, suggesting that real GDP growth could be notably weaker in the first quarter than previously anticipated. Research firm Markit reported its Flash Purchasing Managers Index (PMI) for the manufacturing sector fell 0.5 points to 52.5—its lowest level since June of 2017. Markit’s Manufacturing PMI has been down four of the past five months.
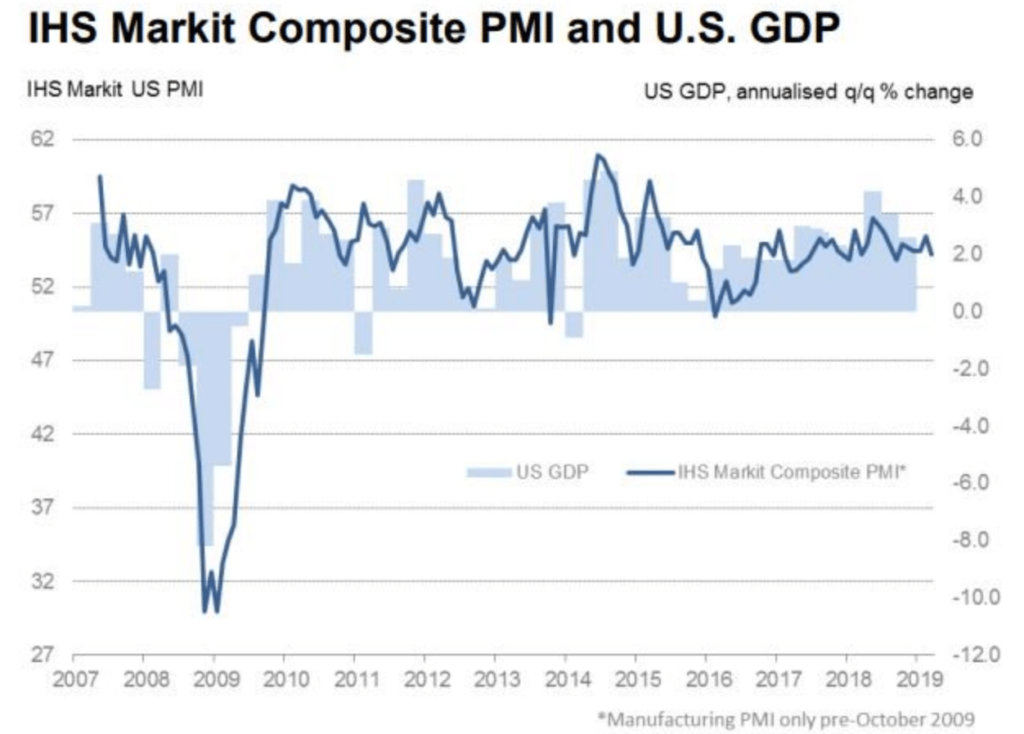
Output growth was the weakest in almost three years and new orders and employment also expanded at slower rates. Similarly, the Services Flash PMI fell 1.2 points, also down four of the past five months, to 54.8. New services orders growth eased and hiring was the weakest since May of 2017. Optimism about business conditions in the next 12 months took another dip, down to its lowest level since June of 2016.
The Federal Reserve voted to hold rates steady, signaled it’s almost done raising interest rates, said the economy is in a “good place” and that inflation posed little threat. In a radical departure from its earlier forecasts, the Fed now forecasts no further interest rate increases this year and only one in 2020.
In December, the Fed had anticipated a total of four future rate hikes. Adding to the dovish policy stance, senior Fed officials also announced they will begin to taper the runoff of its $4 trillion balance sheet in May and end it in September. That is a much quicker ending of “quantitative tightening” than anyone considered just three months ago.
Chairman Jerome Powell said the central bank can afford to be patient because the economy is growing at a steady pace, unemployment is low and inflation is tame. “The U.S. economy is in a good place, and we will use our monetary policy tools to keep it there,” Powell said. “It’s a great time for us to be patient and watch and wait to see how things evolve.”
International Economic News:
Credit rating agency Fitch notified Canada’s government that sustained deficits will make Canada more vulnerable to an economic downturn and that its debt level was incompatible with its current ‘AAA’ status. In its review, Fitch Ratings Inc. said the country’s debt levels are higher than other top-rated countries. “Canada’s gross general government debt, combining federal and provincial fiscal accounts, is higher than other ‘AAA’ rated sovereigns, excepting the U.S, and remains close to a level that is incompatible with ‘AAA’ status,” the report said.
The warning came after the federal government forecast a higher deficit of $19.8 billion in 2019-20 and $19.7 billion for 2021-22, before shrinking to $9.8 billion by 2023-24, in its budget this week. Norman Levine, managing director of Portfolio Manager Corp was thankful for the warning stating, “When opposition politicians, when Street economists talk about it, the government poo-poos it. But when a rating agency says it, well, that means something.”
Like the U.S., the Bank of England remained in a “wait and see” mode at its March interest rates meeting, indicating that uncertainties over Brexit were too great to provide a clear guide for the economy going forward. The bank’s Monetary Policy Committee voted unanimously to hold interest rates at 0.75%, stating that while most companies thought they were ready for a no-deal Brexit, they were still subject to events beyond their control.
The decision was widely expected but recent strong data in the labor market, retail sales, and public finances have led some economists to predict a rate rise soon after uncertainties around Brexit are resolved.
In a dramatic escalation of potential violence, French President Emmanuel Macron has authorized French soldiers embedded with police to ‘open fire’ if they feel their lives are threatened by Yellow Vest protestors this weekend. The military governor of Paris, Bruno Leray, told Franceinfo Radio ‘If their life or that of the people they defend is threatened, they can go up to opening fire.’
French authorities announced the deployment of the counter-terror troops from Operation Sentinelle to now focus on the Yellow Vest protests. Operation Sentinelle originally began in January of 2015 after a series of al-Qaeda linked terrorist attacks occurred throughout France. The first Yellow Vest protests occurred following steep fuel tax increases by Macron and have expanded into a broader rejection of his economic policies. The yellow vest movement was named after the fluorescent garments that French motorists must carry in their vehicles for emergencies.
Manufacturing activity in Germany slumped (again) to its lowest level since the financial crisis, and analysts view it as a major warning sign for the global economy. Germany’s manufacturing Purchasing Managers’ Index (PMI) plunged 2.9 points from 47.6 last month to 44.7 in March. Readings below 50 indicate contraction.
IHS Markit’s flash composite PMI that measures both services and manufacturing activity fell to 51.5—its lowest reading June 2013. Growth in services slowed to 54.9 after rebounding to 55.3 in February. Markit economist Chris Williamson said the diverging trends raised the question of how long services can continue to provide impetus for the economy and help it avoid a recession. “As long as you get growth in the services sector you can avoid a wider recession,” he said.
Germany is being battered by numerous external and internal factors, including the ongoing slump in global manufacturing, continued trade tensions between the US and China, waning demand for Germany’s key export–cars, and record low water levels on the Rhine river, which has hurt industrial production.
In Asia, while U.S. President Donald Trump may like to think that his tariffs are hurting the Chinese economy, a leading economist stated the slowdown in China is actually “self-inflicted”. Stephen Roach, senior fellow at Yale University stated, “There’s downward pressure on the Chinese economy. A lot of it is self-inflicted due to the so-called deleveraging campaign and the tariffs imposed by the U.S. are reinforcing that downside but by no means the major source of downward pressure.”
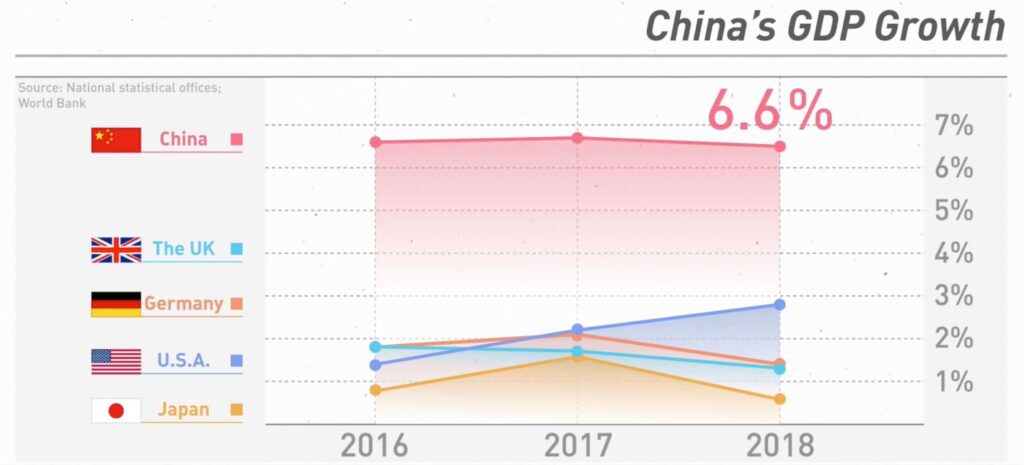
Roach, a former chairman of Morgan Stanley Asia stated he believed the Chinese economy “will begin to move up in the second half of this year—somewhere in the 6% zone.” He further noted that Chinese authorities have enacted tax cuts and monetary policy easing in an attempt to stimulate the economy.
The Japanese government downgraded its view on the economy for the first time in three years, citing a slowdown in exports to China. In the March edition of its economic report, the Cabinet Office said the world’s third-largest economy is “recovering at a moderate pace while weakness is seen recently in exports and industrial production in some sectors.”
The phrase marked a downgrade from its earlier assessment that the economy was “recovering at a moderate pace.” However, Toshimitsu Motegi, minister for economic and fiscal policy, denied that the latest growth phase has ended. “Our view that the economy is recovering moderately as a trend remains unchanged,” he told a press conference.
Current Indicators
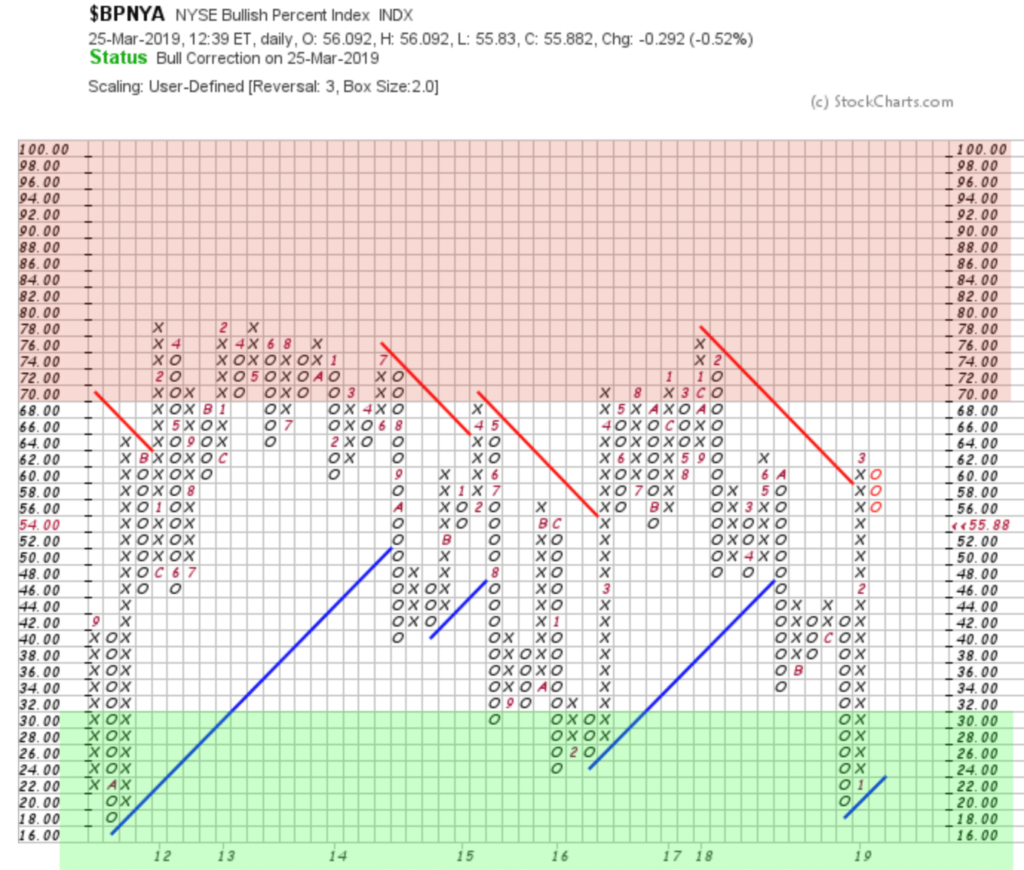
NYSE Bullish Percent Index:
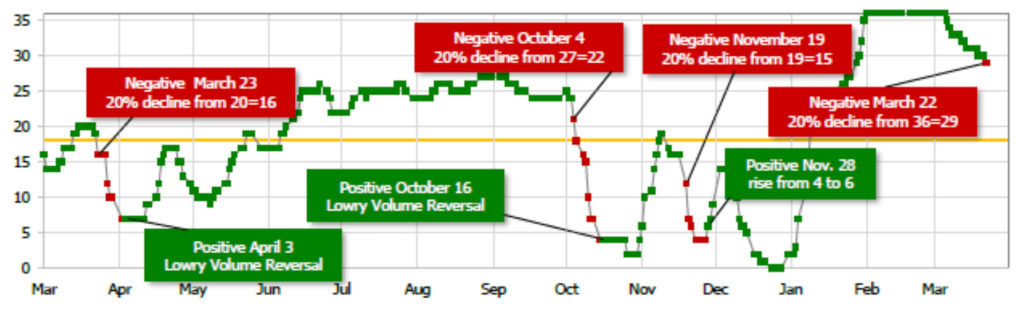
Short Term Trend:
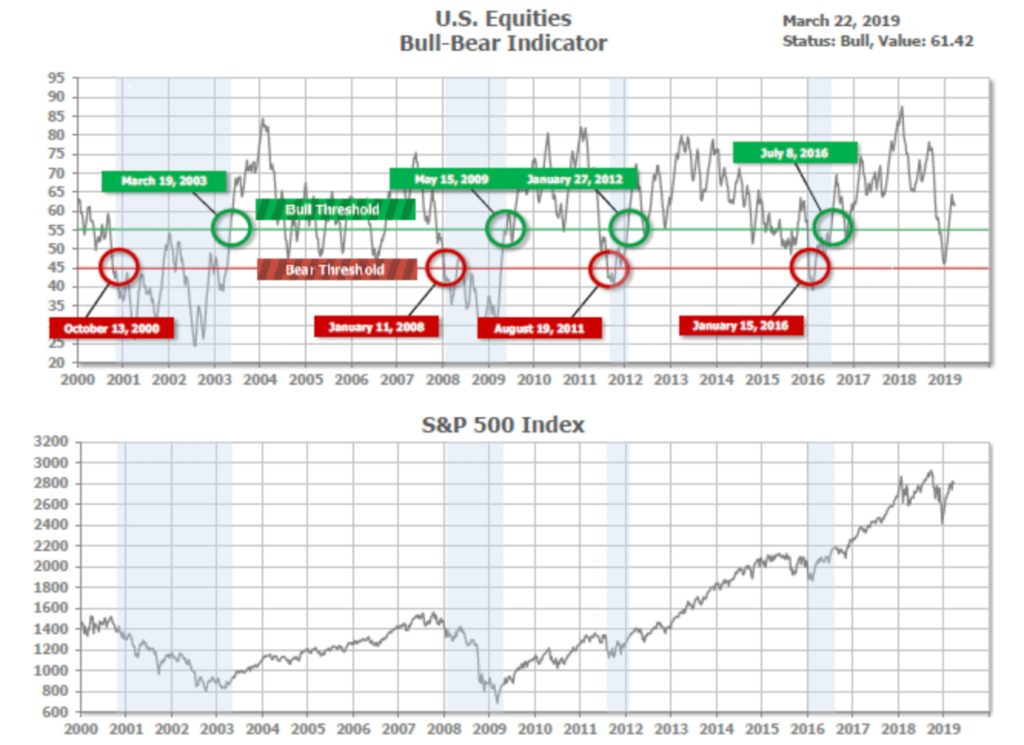
Bull/Bear Market Status:
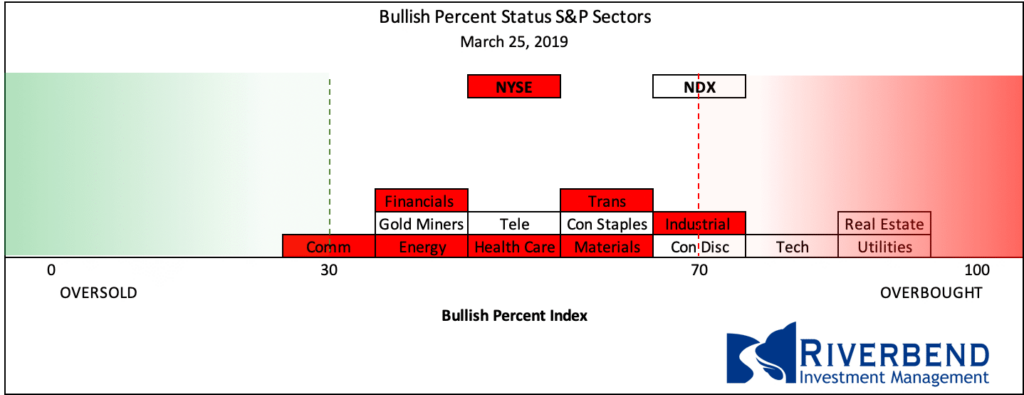
S&P Sector Bullish Percent Index:
The Bullish Percent Index by sector is continuing to show some sectors reversing from overbought status.
SHUT vs DIME
The ranking relationship between the defensive SHUT sectors is one way to gauge institutional investor sentiment in the market.
“S”=Staples [a.k.a. consumer non-cyclical]
“H”=Healthcare
“U”=Utilities and
“T”=Telecom
and the offensive DIME sectors:
“D”=Discretionary [a.k.a. Consumer Cyclical]
“I”=Industrial,
“M”=Materials
“E”=Energy
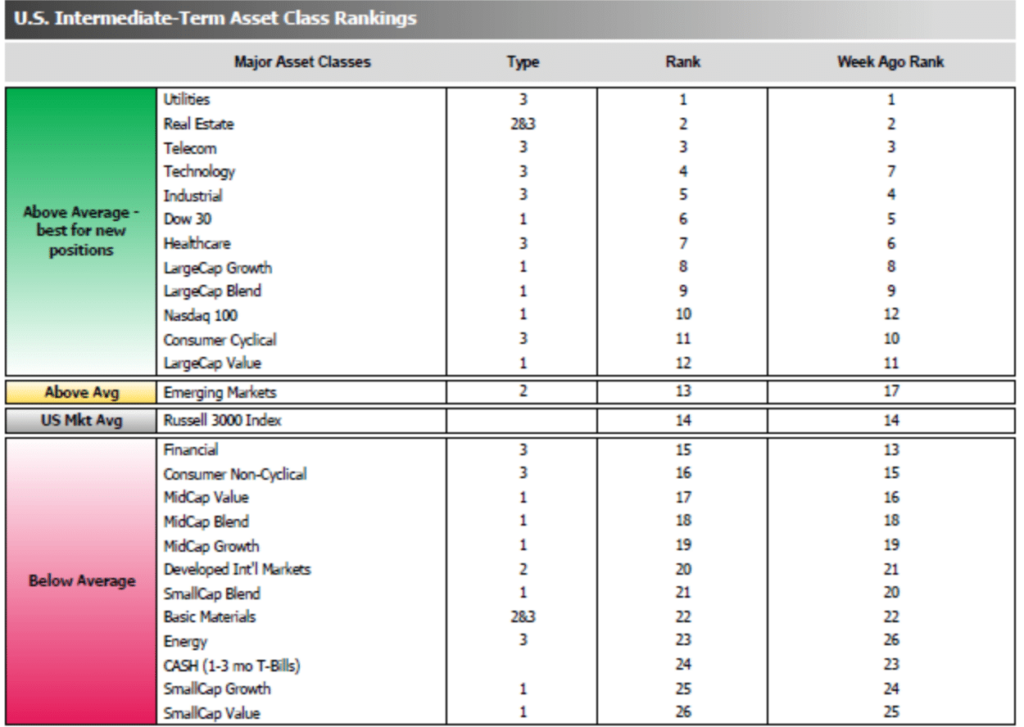
The average ranking of Defensive SHUT sectors slipped a bit to 6.75 from the prior week’s 6.25, and average ranking of the Offensive DIME sectors rose a bit to 15.25 from the prior week’s 15.50. The Defensive SHUT sectors nonetheless maintained a lead over Offensive DIME sectors.
Note: these are “ranks”, not “scores”, so smaller numbers are higher ranks and larger numbers are lower ranks.
Chart of Interest
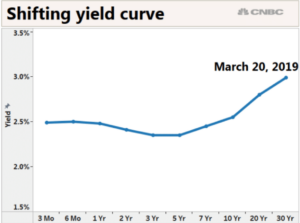
While the U.S. stock market, valued at roughly $30 trillion, may get more press, analysts know the biggest and most well-informed investors are found in the U.S. bond market where the total amount of debt owed through bonds is more than $40 trillion. And this week, the bond market just flashed its biggest recession warning sign since before the financial crisis.
Specifically, the yield curve – which shows the interest rates of treasury securities by duration – inverted, meaning that short-term government fixed income yields are now higher than some longer-duration parts of the curve. The move is seen as a sign that growth is anticipated to be higher now than in the future.
Analysts note that an inverted yield curve does not mean a recession is imminent, or even guaranteed, just that one is likely over the next year or so.
What’s Happening in Your Portfolio?
(as of 3/25/19)
This week we are seeing a continued pullback from overbought territory in the various equity indicators we follow.
We are still taking a conservative approach in our client portfolios until overbought conditions subside.
If you have any questions, please reach out to me directly at john.rothe@riverbendinvestments.com
(sources: all index return data from Yahoo Finance; Reuters, Barron’s, Wall St Journal, Bloomberg.com, ft.com, guggenheimpartners.com, ritholtz.com, markit.com, financialpost.com, Eurostat, Statistics Canada, Yahoo! Finance, stocksandnews.com, marketwatch.com, wantchinatimes.com, BBC, 361capital.com, pensionpartners.com, cnbc.com, FactSet; Figs 1-5 source W E Sherman & Co, LLC)
© 2019 Riverbend Investment Management, LLC. This presentation is intended for informational purposes only.
The information and statistical data contained herein have been obtained from sources we believe to be reliable but in no way are warranted by us as to accuracy or completeness. The opinions expressed are those of Riverbend Investment Management, LLC. and are subject to change without notice. No part of this presentation may be reproduced in any manner without the written permission of Riverbend Investment Management, LLC. Any securities discussed should not be construed as a recommendation to buy or sell and there is no guarantee that these securities will be held for a client’s account nor should it be assumed that they were or will be profitable. Past performance does not guarantee future comparable results.
Riverbend Investment Management, LLC is a Registered Investment Adviser in Northern VA
ADV II available upon request
Riverbend Investment Management, LLC
1818 Library Street, Suite 500
Reston VA 20190
Tel:703-349-6327
www.riverbendinvestments.com


