 Last week, I discussed some of the signs I was seeing in the market. Initially, I was looking at a 2800 level on the S&P 500 area as a target.
Today, we are well below that. As I’ve said in the past, I’m not a fan of predicting lows. Indicators do a good job of telling us which direction the market is moving. But as a predictive tool, I don’t find them too helpful.
With that said, I’ve been getting a lot of questions on if it’s safe to jump back in the water.
A Big Drop
Most of the portfolios I manage tend to fall on the conservative growth side. During times like this, I am happy to stand on the sidelines and not try to time the exact bottom. Instead, I find it best to wait for the indicators I follow to reverse.
The current market volatility is being driven by the algos. The moment key technical levels are broken, the volume instantly spikes. Basically, the computers are fighting themselves right now, while human traders are watching and waiting.
As I write this, the markets are up after a two day, nearly 1400 point drop on the Dow. But my fellow money managers that I have spoken with seem to be all thinking the same thing. We need a catalyst to jump-start the market. The common catalyst that I am hearing: we need a 1000 point drop in one day to flush out the weak hands.
Dead Cat Bounce
Today’s trading action feels unenthusiastic. Instead, it is more of a dead cat bounce.
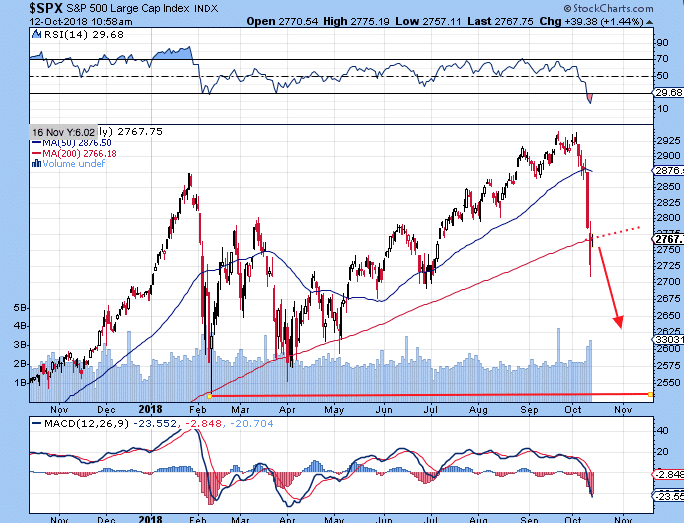
The S&P 500 index has rallied back to it’s 200-day moving average but is having a hard time above it.
My current thinking (and remember, I am not a fan of predicting turn-around points), is we bounce back down from here. Possibly testing the lows of February.
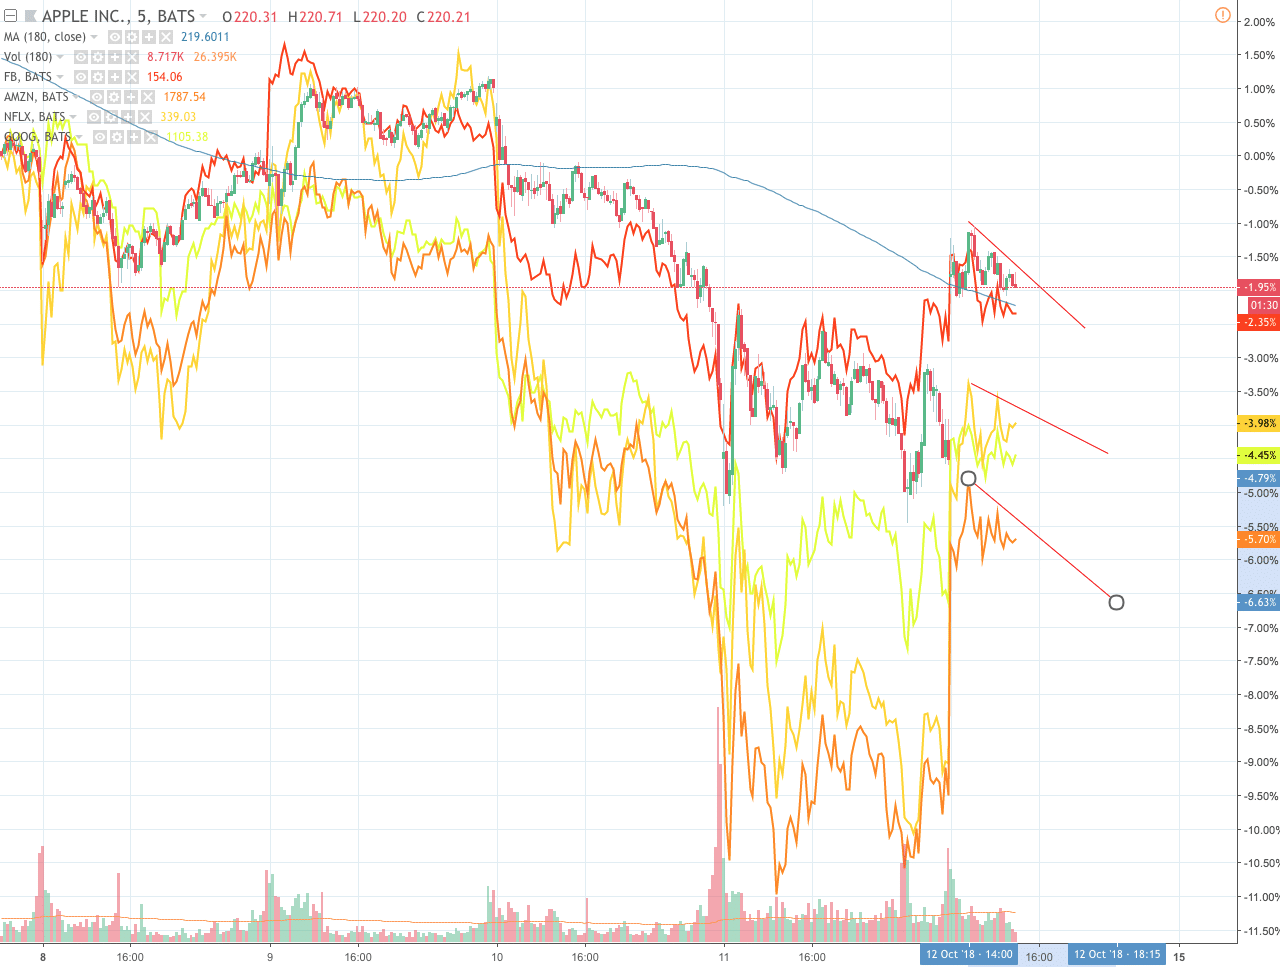
The FANG stocks, which have been leading the market still look weak:
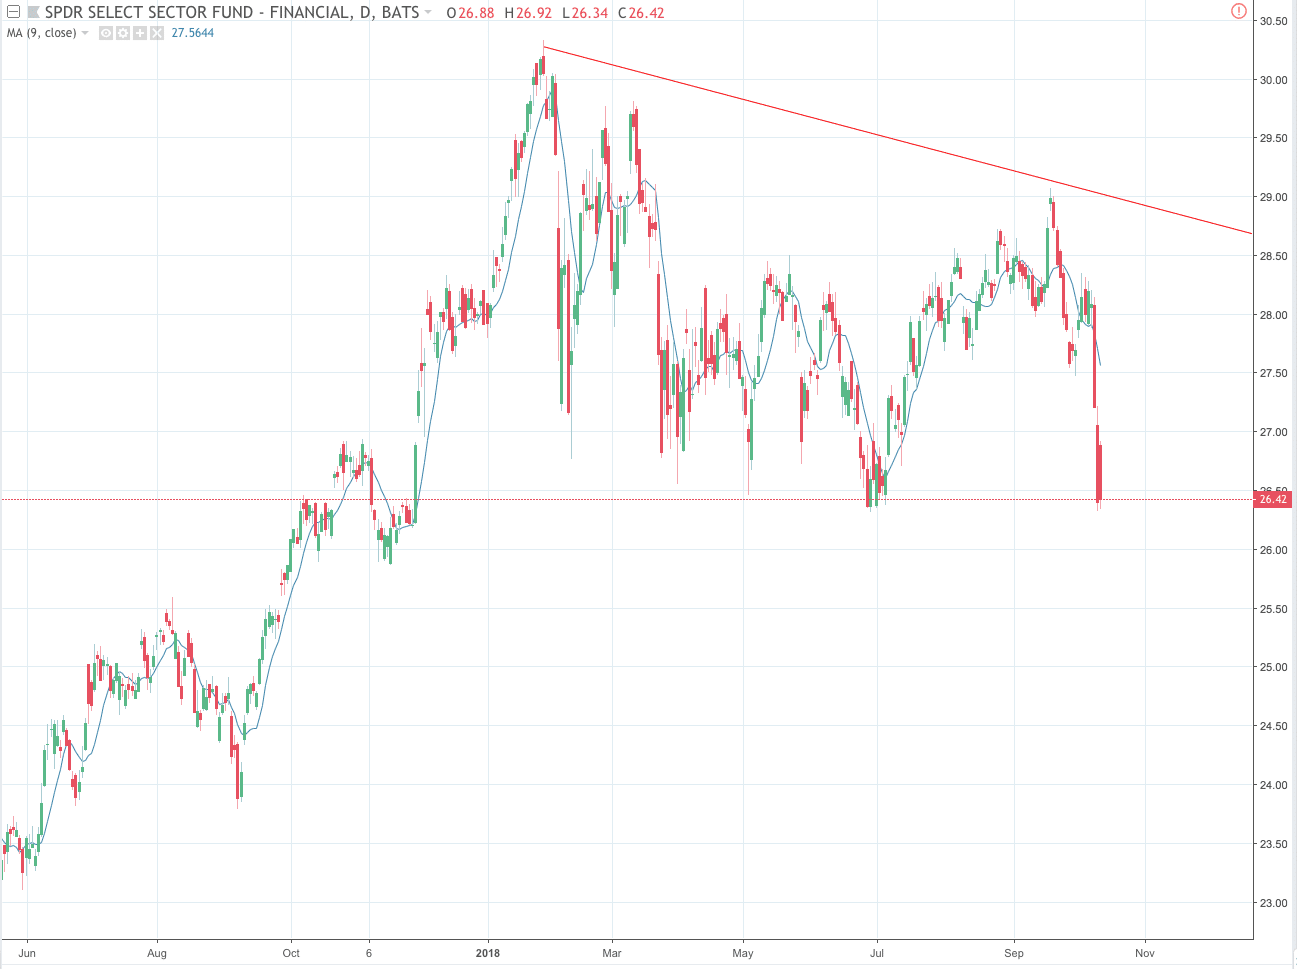
And Financials, which historically do well when interest rates rise, have been lackluster too:
So what am I looking for before reallocating into equities?
We still need a big, headline-grabbing down day in the markets. Followed by a high volume reversal. Something akin to a Lowry Reversal Day
-or
A statement from the Fed. The markets seem to be concerned that the Fed may tighten too much. Any indication that the Fed may slow down its interest rate path will be a big positive.
Then What?
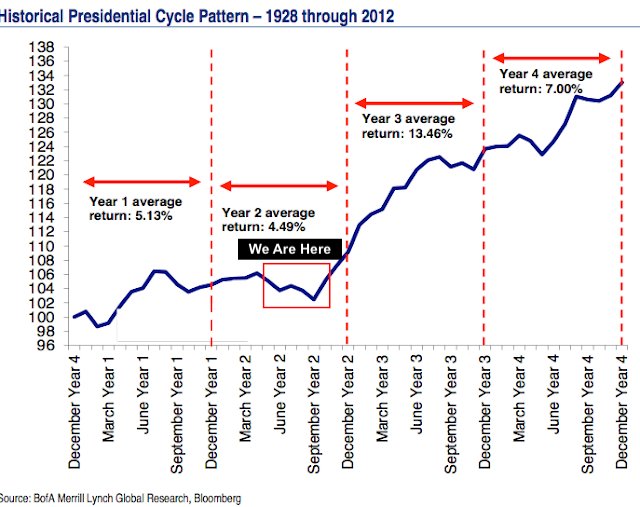
We are nearing a historically strong period for the stock market:
- The number of 20-day S&P 500 advancers vs. decliners fell below 50%on Wednesday, for the first time in more than two months. In the past 45 years, this very thing (after two or more months with the advancers nicely prevailing) has happened 27 times. However: The S&P was higher, just two months later, 24 of those 27 times.
- The NYSE 20-day ‘Cumulative Tick’ (a running count of daily higher-closes vs. lower-closes) has dropped below -30,000, a very oversold reading. Since 2007 (when the ‘Uptick Rule’ was eliminated), this has happened ten times; the S&P 500 was higher, just one month later, eight of those ten times.
- Fourth quarters, in mid-term election years, are 14 winners, and only three losers, in the last 17 mid-terms.
While historically stats don’t drive the market, they do give traders talking points and a narrative to follow.
As of now, I expect we will resume the bull market climb after the weak hands get chased out.
