For investors seeking to optimize their investment strategies, Relative Rotation Graphs (RRGs) offer a sophisticated tool for informed decision-making.
RRGs are an instrumental tool when viewing sector relative strength and momentum. This can help investors select the strongest area within the stock market.
What are Relative Rotation Graphs?
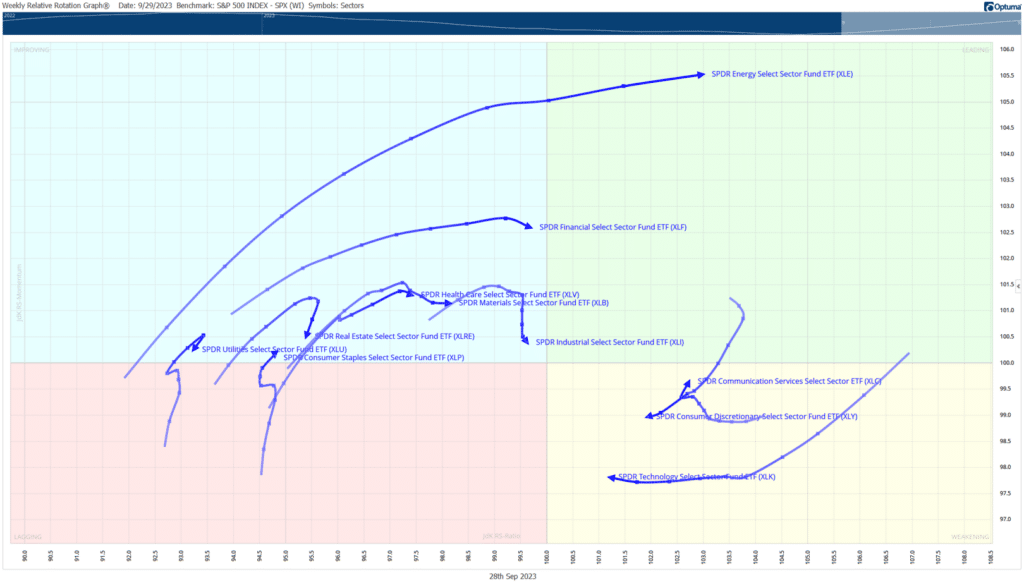
Relative Rotation Graphs help visualize the rotation of the market
Developed by Julius de Kempenaer, RRGs utilize a benchmark index (such as the S&P 500 index or the Risk-Free rate) as a reference point to map the relative strength and momentum of various sectors or asset classes.
The graph is divided into four quadrants: Leading, Weakening, Lagging, and Improving, providing a visual representation of movement between an asset and the comparable index.
How Do Relative Rotation Graphs Function?
RRGs serve as a useful tool for evaluating sector rotation patterns. Sectors positioned in the Leading quadrant denote robust performance and positive momentum, signaling potential investment opportunities.
Conversely, sectors in the Lagging quadrant signify underperformance relative to the benchmark and may warrant caution in investment decisions.
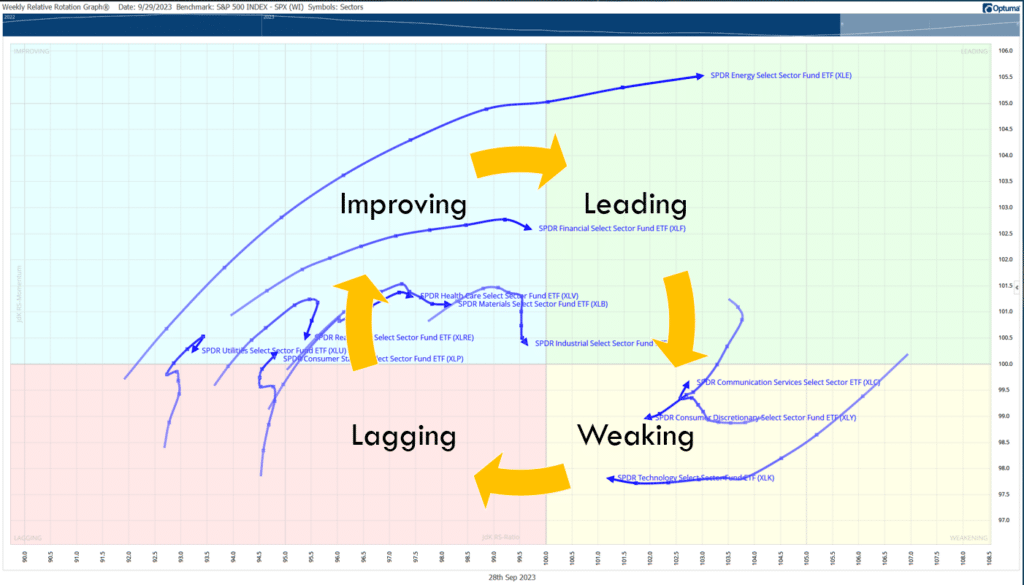
By tracking the movement of sectors across the graph, investors gain insights into evolving market dynamics and can tailor their investment strategies accordingly.
Benefits of Utilizing Relative Rotation Graphs:
- Enhanced Sector Selection: RRGs empower investors to identify sectors exhibiting strong relative strength and positive momentum. This can help investors can pinpoint areas of the market poised for outperformance, thereby optimizing their sector selection process.
- Dynamic Portfolio Management: RRGs facilitate dynamic portfolio management by enabling investors to adapt their investment allocations in response to changing market conditions. By monitoring sector rotation dynamics, investors can reallocate their portfolios to capitalize on emerging opportunities while mitigating exposure to underperforming sectors.
- Early Trend Identification: RRGs offer a preemptive approach to trend identification by highlighting sectors transitioning from the Weakening quadrant to the Leading quadrant. This early identification of emerging trends empowers investors to position themselves strategically, potentially maximizing returns as sectors gain momentum.
- Risk Mitigation: Beyond identifying sectors with strong performance, RRGs serve as effective risk management tools. Sectors in the Lagging or Weakening quadrants signal potential areas of weakness, prompting investors to adjust their portfolios accordingly and mitigate downside risk during market downturns.
In conclusion, Relative Rotation Graphs (RRGs) are invaluable tools for investors seeking to optimize their sector selection process. By providing a visual representation of sector rotation dynamics, RRGs enable investors to make informed investment decisions, enhance portfolio performance, and mitigate risk.
Incorporating RRGs into investment strategies empowers investors to navigate the complexities of the financial markets with confidence, ultimately contributing to their investment success.


