Stocks have fallen to start the year as the prospect of a more hawkish Fed weighs on the market. Areas with high valuations such as tech have been hit the hardest with the NASDAQ Composite down several percentage points. Interest rates have jumped to nearly 1.8%, the highest since before the pandemic, in just a matter of days.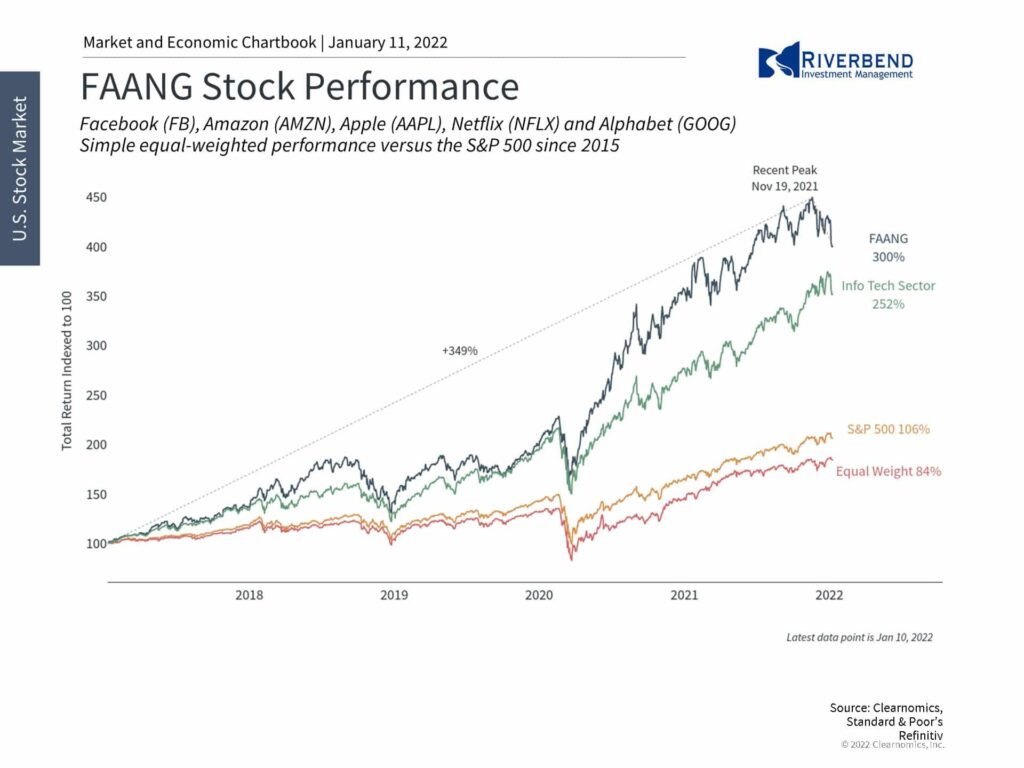
When policy is shifting, it is important for investors to have the right perspective on what has truly changed and what hasn’t. In today’s market, there are at least three key facts for long-term investors to remember.
First, although the calendar has changed, the underlying economic trends have not. After all, long-term investors construct their portfolios not based on which assets have done well over recent weeks and months, but based on what will likely benefit from economic growth trends over quarters, years and decades.
Specifically, inflation is elevated just as it was for much of 2021. This is one reason investors spent months last year adjusting to a Fed taper so that when it finally happened, it was fully expected.
Last week’s FOMC minutes confirmed that the central bank is worried about inflation and may thus begin to tighten faster. This will require investors to adjust once again. Still, many economists expect inflation to stabilize and perhaps decline in the second half of the year as supply chains improve and year-over-year comparisons ease.
Faster Fed rate hikes may be a short-term shock to markets but they usually signal the beginning, not the end, of market cycles. It’s natural for the Fed to begin hiking rates once the economy is back on solid footing, which it has been for over a year. The fact that many are calling for rate hikes to combat inflation only further justifies these moves.
The fed funds rate, which is still at zero today, reached 2.25% prior to the pandemic and even the most hawkish expectations are for the Fed to raise it to 1% by the end of 2022. History suggests that markets can perform well once investors adjust.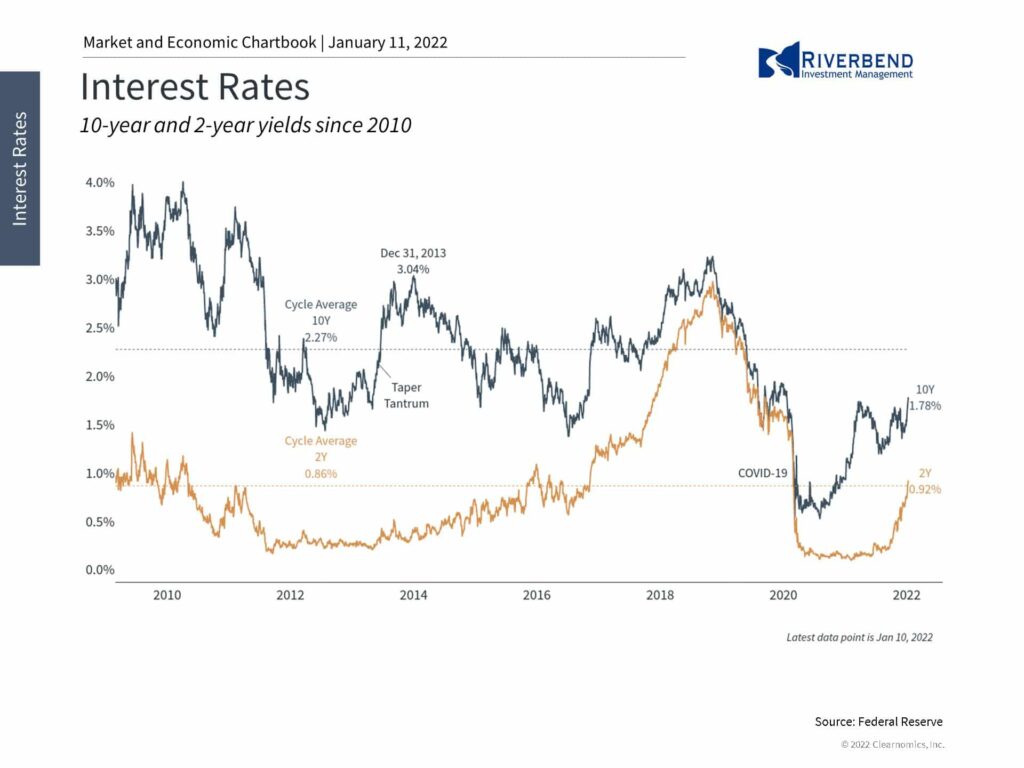
Second, stock market valuations in general, and growth/tech valuations in particular, are still lofty. The S&P 500’s forward price-to-earnings ratio sits at 21.7x which, although lower than at the start of the recovery, is still the highest since the dot-com era. The price-to-book ratio of U.S. growth stocks is now 10.7x compared to 4.1x for the overall Russell 3000 and only 2.4x for value stocks.
While valuations do not predict short-term stock market performance, they do reflect expectations for what has to go right. Today’s high valuations are due entirely to the steep rise in prices over the course of this rally.
However, earnings are also expected to grow quickly with S&P 500 earnings-per-share possibly reaching $220 in twelve months. As is always the case, the rapid economic recovery and robust earnings growth have been the foundations of this market cycle.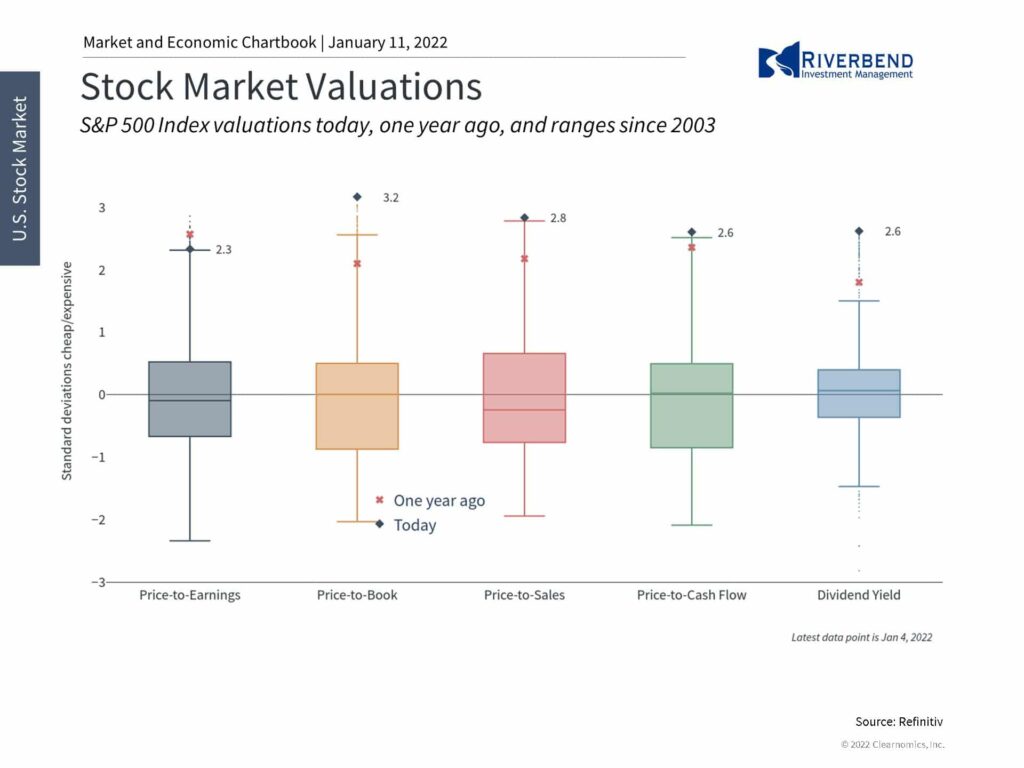
Finally, although the Fed and inflation tend to garner attention, short-term ups and downs in markets are completely normal. Even if this short-term pullback worsens, it is in the context of a significant bull rally that has lasted over 20 months.
Staying patient and disciplined throughout these periods is ultimately why long-term investors are rewarded.
After all, despite a never-ending list of concerns, the S&P 500 has gained 38% from the peak of the last cycle, 75% over the past 4 years, and 109% over the past 5 years. And while the past is no guarantee of the future, it is a reminder to not overreact to a few days of trading activity.
Thus, it’s important for investors to focus on the underlying trends.
Riverbend Indicators: 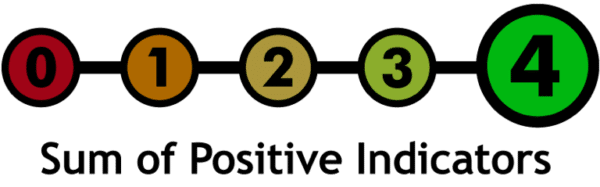
Each week we post notable changes to the various market indicators we follow.
- As a reading of our Bull-Bear Indicator for U.S. Equities (comparative measurements over a rolling one-year timeframe), we remain in Cyclical Bull territory.
- Counting up of the number of all our indicators that are ‘Up’ for U.S. Equities, the current tally is that four of four are Positive, representing a multitude of timeframes (two that can be solely days/weeks, or months+ at a time; another, a quarter at a time; and lastly, the {typically} years-long reading, that being the Cyclical Bull or Bear status).
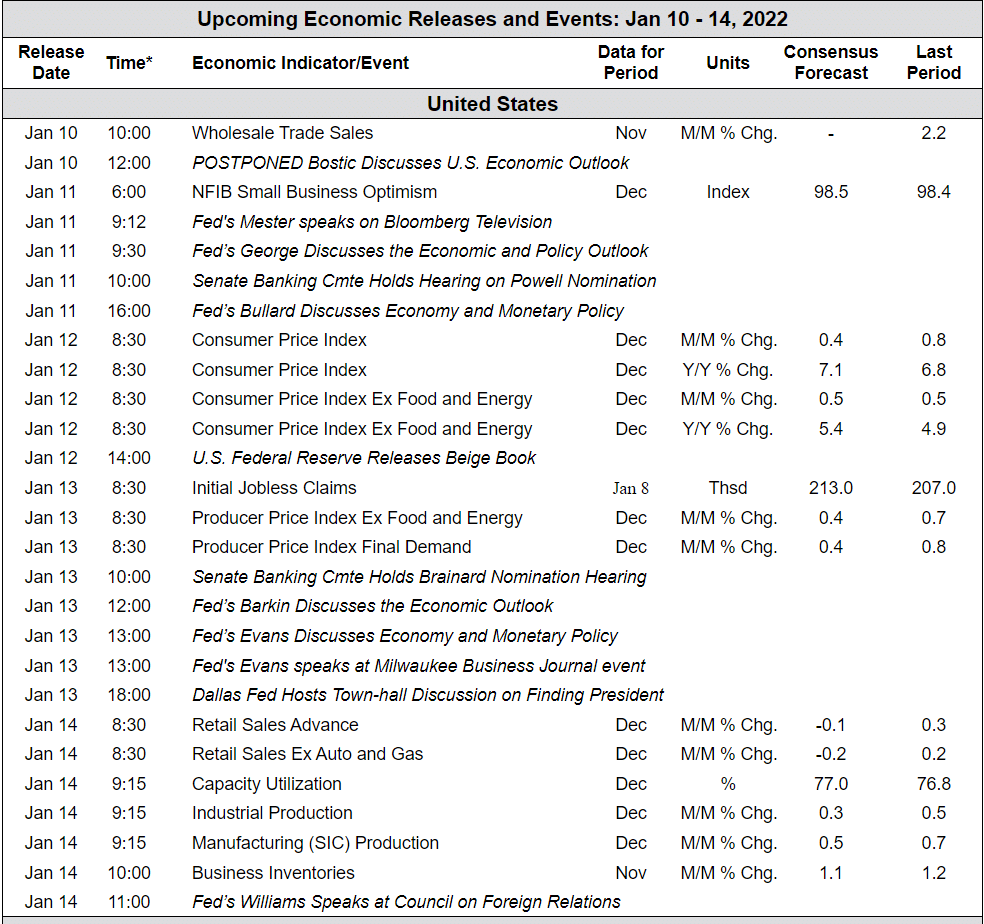
The Week Ahead: