[fusion_builder_container hundred_percent=”no” equal_height_columns=”no” menu_anchor=”” hide_on_mobile=”small-visibility,medium-visibility,large-visibility” class=”” id=”” background_color=”” background_image=”” background_position=”center center” background_repeat=”no-repeat” fade=”no” background_parallax=”none” parallax_speed=”0.3″ video_mp4=”” video_webm=”” video_ogv=”” video_url=”” video_aspect_ratio=”16:9″ video_loop=”yes” video_mute=”yes” overlay_color=”” video_preview_image=”” border_size=”” border_color=”” border_style=”solid” padding_top=”” padding_bottom=”” padding_left=”” padding_right=””][fusion_builder_row][fusion_builder_column type=”1_6″ spacing=”” center_content=”no” link=”” target=”_self” min_height=”” hide_on_mobile=”small-visibility,medium-visibility,large-visibility” class=”” id=”” hover_type=”none” border_size=”0″ border_color=”” border_style=”solid” border_position=”all” border_radius=”” box_shadow=”no” dimension_box_shadow=”” box_shadow_blur=”0″ box_shadow_spread=”0″ box_shadow_color=”” box_shadow_style=”” padding_top=”” padding_right=”” padding_bottom=”” padding_left=”” margin_top=”” margin_bottom=”” background_type=”single” gradient_start_color=”” gradient_end_color=”” gradient_start_position=”0″ gradient_end_position=”100″ gradient_type=”linear” radial_direction=”center” linear_angle=”180″ background_color=”” background_image=”” background_image_id=”” background_position=”left top” background_repeat=”no-repeat” background_blend_mode=”none” animation_type=”” animation_direction=”left” animation_speed=”0.3″ animation_offset=”” filter_type=”regular” filter_hue=”0″ filter_saturation=”100″ filter_brightness=”100″ filter_contrast=”100″ filter_invert=”0″ filter_sepia=”0″ filter_opacity=”100″ filter_blur=”0″ filter_hue_hover=”0″ filter_saturation_hover=”100″ filter_brightness_hover=”100″ filter_contrast_hover=”100″ filter_invert_hover=”0″ filter_sepia_hover=”0″ filter_opacity_hover=”100″ filter_blur_hover=”0″ last=”no”][/fusion_builder_column][fusion_builder_column type=”2_3″ layout=”1_1″ background_position=”left top” background_color=”” border_size=”” border_color=”” border_style=”solid” border_position=”all” spacing=”yes” background_image=”” background_repeat=”no-repeat” padding_top=”” padding_right=”” padding_bottom=”” padding_left=”” margin_top=”0px” margin_bottom=”0px” class=”” id=”” animation_type=”” animation_speed=”0.3″ animation_direction=”left” hide_on_mobile=”small-visibility,medium-visibility,large-visibility” center_content=”no” last=”no” min_height=”” hover_type=”none” link=””][fusion_text]
U.S. Markets
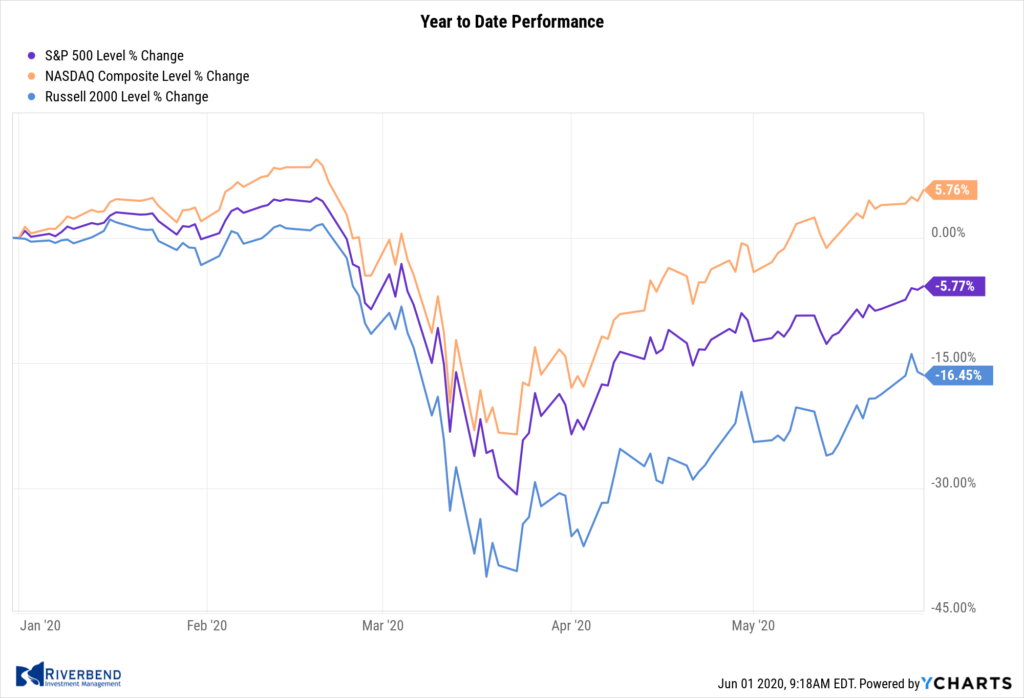
U.S. stocks recorded a second consecutive week of solid positive returns, with slower-growing value stocks again gaining ground ahead of more highly valued growth shares. At its peak this week, the S&P 500 got within 10% of its all-time high, pulling it out of “correction” territory.
Similarly, the technology-heavy NASDAQ 100 Index climbed within almost 3% of its February peak before retreating. The Dow Jones Industrial Average rose over 900 points to close at 25,383, a gain of 3.8%, while the Nasdaq Composite added 1.8%.
The large cap S&P 500 gained 3.0%, while the mid cap S&P 400 and small cap Russell 2000 gained 4.0% and 2.8%, respectively for the week.
International Markets:
International markets were all green last week. Canada’s TSX rose 1.9%, while the United Kingdom’s FTSE 100 gained 1.4%.
On Europe’s mainland, France’s CAC 40 rallied 5.6% along with Germany’s DAX which gained 4.6%.
In Asia, China’s Shanghai Composite added 1.4% and Japan’s Nikkei surged 7.3%. As grouped by Morgan Stanley Capital International, developed markets gained 4.7% while emerging markets rose 3.6%.
Commodities:
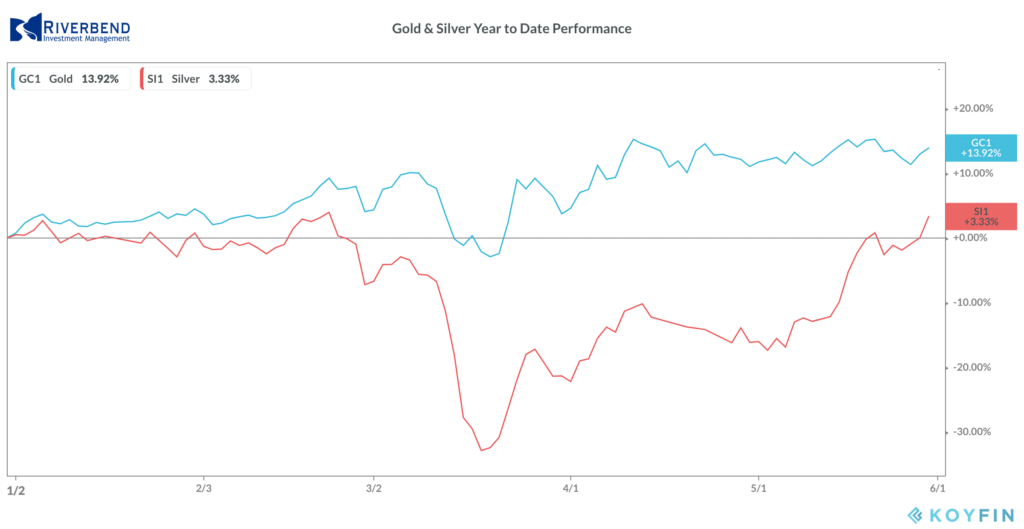
Gold rose 0.9% to close at $1751.70 per ounce, while Silver rallied a fourth consecutive week to close at $18.50 per ounce—a gain of 4.6%.
Oil rose 6.7% to $35.49 per barrel of West Texas Intermediate crude.
The industrial metal copper, viewed by some as a barometer of world economic health due to its wide variety of uses, rose a second consecutive week up 1.6%.
U.S. Economic News:
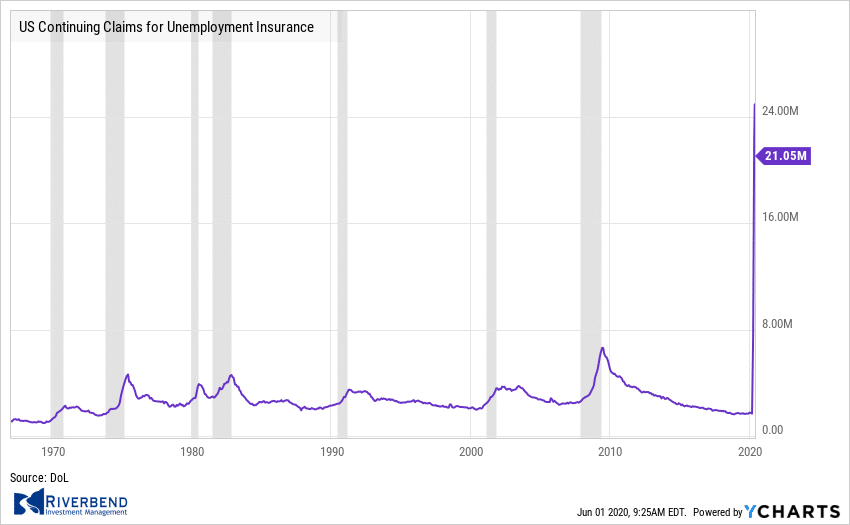
The number of Americans applying for initial jobless benefits continued to recede last week, falling by 323,000 to a still-huge 2.123 million. Economists had estimated 2 million Americans would file. Over the past ten weeks, more than 40 million workers have filed for unemployment benefits as a result of the unprecedented coronavirus-driven shutdown of the economy. Continuing claims, which counts the number of Americans already receiving benefits, fell 3.860 million to 21.052 million—its first decline in 11 weeks.
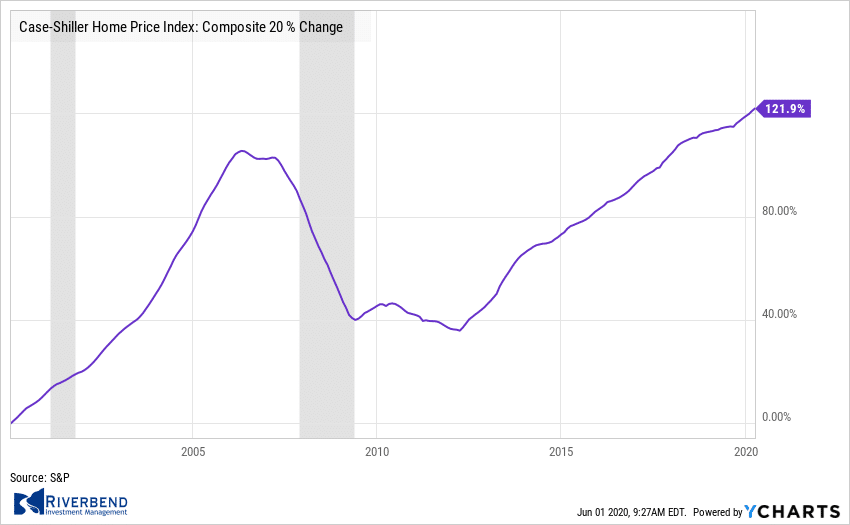 The pace of home-price appreciation continued to rise in March despite the spread of the coronavirus according to a major home price barometer. The S&P CoreLogic Case-Shiller 20-city home price index posted a 3.9% year-over-year gain in March—a 0.4% increase from the previous month. On a monthly basis, the index increased 0.5% between February and March. Because of the two-month lag in the data for the index, the effects of the coronavirus pandemic on the housing market were not yet fully reflected in the data.
Home prices have managed to thus far shrug off most of the economic impact of the coronavirus pandemic. Robert Kavcic, senior economist at BMO Capital Markets stated in a research note, “While March was still early days, it’s looking likely that the initial impact will be felt mostly on plunging sales and listings volumes, not prices.”
Sales of new homes ticked up 0.6% from March to April, to a seasonally-adjusted annual rate of 623,000 the government reported. Compared with the previous year, however, new home sales were down 6.2%. The reading was far higher than analysts’ expectations of just 480,000 new homes sold. However, because of the small sample size used to produce the new‑home sales report, it is prone to often significant revisions.
By region, the Northeast experienced the largest increase with an 8.7% uptick, while new home sales rose 2.4% in the both the Midwest and the South. Sales fell 6.3% in the West. The median price of a new home sold was $309,900—down 8.5% from the same time last year. Furthermore, there was a 6.3 months’ supply of available homes on the market. Six months of inventory is generally considered a “balanced” housing market.
The Conference Board reported that the confidence of American consumers stabilized in May after sharp drops in March and April. The board’s Consumer Confidence Index ticked up 0.9 points in May to 86.6. Economists had expected a 4.6 point decline to 82.3. This initial sign of stabilization is particularly important as strengthening confidence should translate into a pickup in consumer spending, necessary for any reacceleration of broad economic growth.
Consumers’ assessment of the present situation remained dire, with that indicator falling 1.9 points to 71.1—its lowest level since August 2013. However, consumer expectations for the near future surprisingly rose 2.6 points to 96.9, a three-month high.
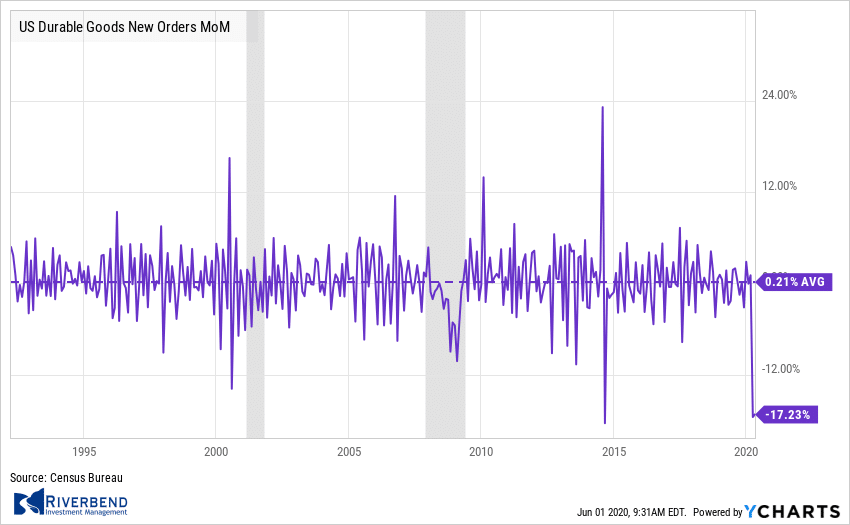
Orders for goods expected to last at least 3 years, so-called “durable goods”, plunged -17.2% in April. Economists had forecast a decline of -18.2%. A key measure of business investment which strips out defense and transportation categories fell a lesser -5.8%. Orders for durable goods have declined three out of the last four months.
CIBC economists Andrew Grantham and Katherine Judge in a note, “While the decline in durable goods orders in April wasn’t quite as bad as expected, the opening up of capacity in the industrial sector and continued struggles in the aviation industry will likely mean the rebound in the second half of the year in business investment lags behind other areas of the economy.”
The Chicago Federal Reserve reported that economic activity across the nation fell sharply in April. The Chicago Fed’s National Activity Index registered a -16.74 in April, a record low. The index’s less-volatile three month moving average declined to a -7.22 from -1.69, also a record low for the three-month measure. The regional bank noted there is an increasing likelihood of a recession when the three-month moving average falls below -0.7.
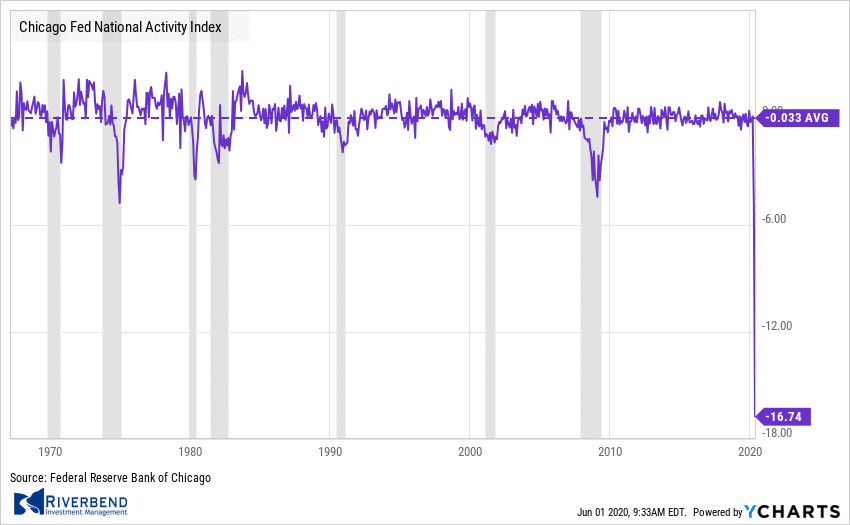 The National Activity index is a weighted average of 85 economic indicators. A zero value indicates that the economy is expanding at its historic trend rate of growth. In April’s reading, 79 of the 85 individual indicators made negative contributions, while only 6 were positive.
The Federal Reserve’s latest “Beige Book”—a collection of anecdotal reports from each of the Federal Reserve’s district banks about economic conditions in their respective areas, showed economic activity falling sharply and steep job losses nationwide.
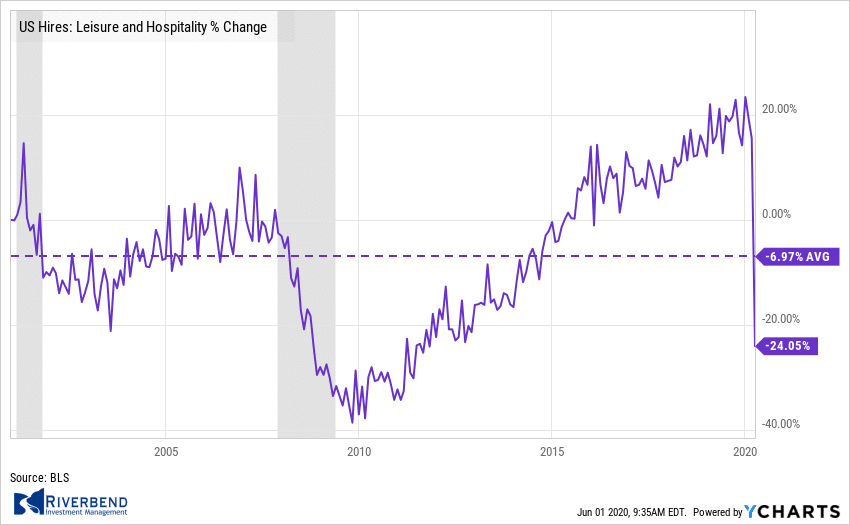 Some sectors, like leisure and hospitality, continued to be hit hardest by the stay-at-home orders, while factory activity and agriculture also continued to deteriorate. One bright spot was an upturn in auto sales towards the middle of May. Thomas Simons, money market economist at Jefferies stated, “The bottom line is that the U.S. economy is quite far from being out of the woods yet. If there is anything to be gleaned about policy, it is that more needs to be done on the fiscal and monetary front, or perhaps both, before a meaningful recovery can take hold.”
Chart of the Week:
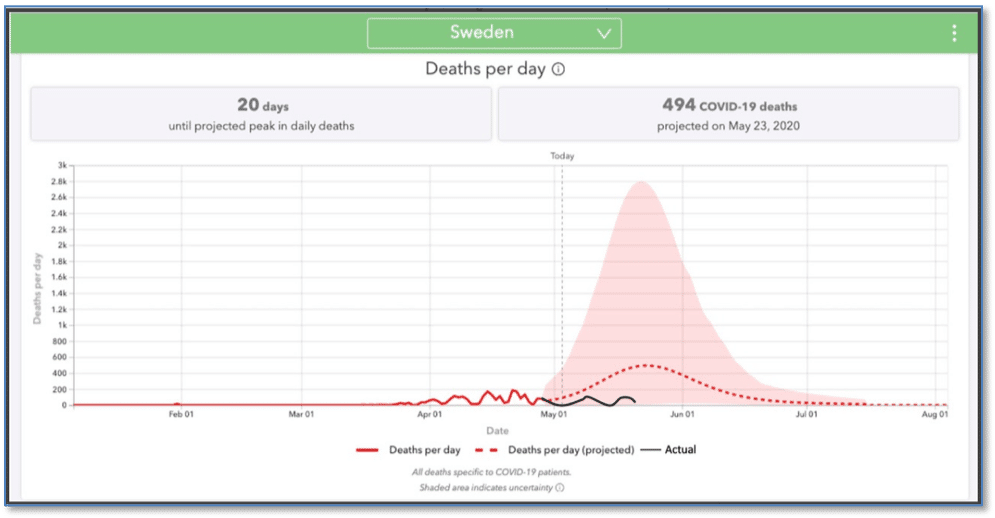
Sweden pursued its own distinct path in confronting the coronavirus pandemic. By choosing to keep its economy open, rather than instituting a policy of lockdown, it is the only major nation expected to report a positive gross domestic product reading for the first quarter. Epidemiologist Anders Tegnell, the architect behind Sweden’s policy, has repeatedly doubled down on the merits of his country’s approach.
Sweden, he said, is playing the long game despite the country currently experiencing a much higher death rate than its neighbors. “In the autumn, there will be a second wave. Sweden will have a high level of immunity and the number of cases will probably be quite low,” Tegnell said in an interview. “But [neighboring] Finland will have a very low level of immunity.
Will Finland have to go into a complete lockdown again?” Critics, such as infectious disease expert Stefan Hanson, noted that Sweden’s mortality per million is as much as five times higher than all the other Nordic countries, though still lower than numerous other countries. What can be said unequivocally is that the disaster predicted by many to befall Sweden because of its relaxed response to the pandemic has simply not occurred…at least not yet.
The chart below shows the actual number of covid-19 deaths (red then black line) vs the projected number (dotted line) and the worst-case number (shaded area). (Chart by Yinon Weiss from Institute for Health Metrics and Evaluation (IHME) data)
Riverbend Indicators Update
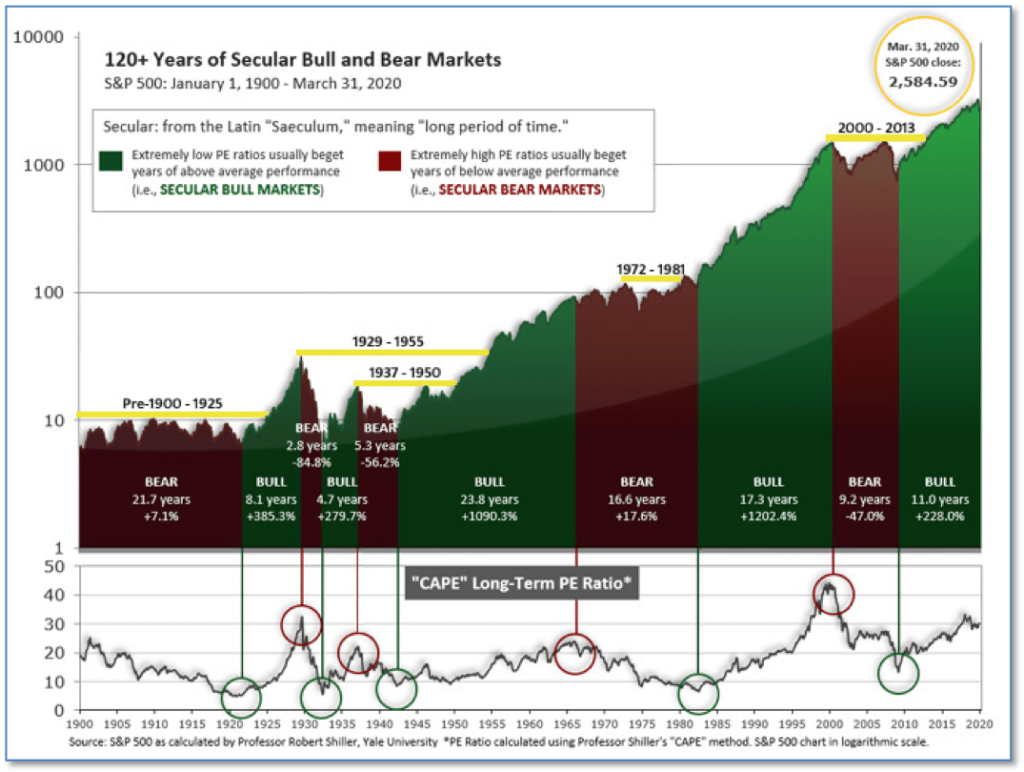 The long-term valuation of the market is commonly measured by the Cyclically Adjusted Price to Earnings ratio, or “CAPE”, which smooths-out shorter-term earnings swings in order to get a longer-term assessment of market valuation. A CAPE level of 30 is considered to be the upper end of the normal range, and the level at which further PE-ratio expansion comes to a halt (meaning that further increases in market prices only occur as a general response to earnings increases, instead of rising “just because”). The market was recently at that level.
Of course, a “mania” could come along and drive prices higher – much higher, even – and for some years to come. Manias occur when valuation no longer seems to matter, and caution is thrown completely to the wind – as buyers rush in to buy first, and ask questions later. Two manias in the last century – the “Roaring Twenties” of the 1920s, and the “Tech Bubble” of the late 1990s – show that the sky is the limit when common sense is overcome by a blind desire to buy. But, of course, the piper must be paid, and the following decade or two were spent in Secular Bear Markets, giving most or all of the mania-gains back.
The CAPE is now at 28.62, up from the prior week’s 27.78 and now back below 30. Since 1881, the average annual return for all ten-year periods that began with a CAPE in the 20-30 range have been slightly-positive to slightly-negative.
As a reading of our Bull-Bear Indicator for U.S. Equities (comparative measurements over a rolling one-year timeframe), we remain in Cyclical Bull territory.
 Counting-up of the number of all our indicators that are ‘Up’ for U.S. Equities, the current tally is that three of four are Positive, representing a multitude of timeframes (two that can be solely days/weeks, or months+ at a time; another, a quarter at a time; and lastly, the {typically} years-long reading, that being the Cyclical Bull or Bear status).
The Week Ahead
Monday: ISM Manufacturing PMI 43.5 exp, 41.5 prior
Tuesday: Australia GDP q/q -0.4% exp, +0.5% prior China Caixin Services PMI 47.4 exp, 44.4 prior
Wednesday: U.S. ADP Non-Farm Employment Change -9500k exp, -20236k prior U.S. Non-Manufacturing PMI 44.0 exp, 41.8 prior U.S. Factory Orders m/m -15.0% exp, -10.3% prior
Thursday: ECB Monetary Policy Statement U.S. Unemployment Claims N/A exp, 2123k prior
Friday: U.S. Jobs Report Germany Factory Orders m/m -10.0% exp, -5.6% prior U.S. Non-Farm Employment Change -8000k exp, -20500k prior U.S. Unemployment Rate 19.5% exp, 14.7% prior Average Hourly Earnings m/m +1.0% exp, +4.7% prior
(Sources: All index- and returns-data from Yahoo Finance; news from Reuters, Barron’s, Wall St. Journal, Bloomberg.com, ft.com, guggenheimpartners.com, zerohedge.com, ritholtz.com, markit.com, financialpost.com, Eurostat, Statistics Canada, Yahoo! Finance, stocksandnews.com, marketwatch.com, wantchinatimes.com, BBC, 361capital.com, pensionpartners.com, cnbc.com, FactSet.)
[/fusion_text][/fusion_builder_column][/fusion_builder_row][/fusion_builder_container][fusion_builder_container hundred_percent=”no” hundred_percent_height=”no” hundred_percent_height_scroll=”no” hundred_percent_height_center_content=”yes” equal_height_columns=”no” menu_anchor=”” hide_on_mobile=”small-visibility,medium-visibility,large-visibility” status=”published” publish_date=”” class=”” id=”” border_size=”” border_color=”” border_style=”solid” margin_top=”” margin_bottom=”” padding_top=”” padding_right=”” padding_bottom=”” padding_left=”” gradient_start_color=”” gradient_end_color=”” gradient_start_position=”0″ gradient_end_position=”100″ gradient_type=”linear” radial_direction=”center” linear_angle=”180″ background_color=”” background_image=”” background_position=”center center” background_repeat=”no-repeat” fade=”no” background_parallax=”none” enable_mobile=”no” parallax_speed=”0.3″ background_blend_mode=”none” video_mp4=”” video_webm=”” video_ogv=”” video_url=”” video_aspect_ratio=”16:9″ video_loop=”yes” video_mute=”yes” video_preview_image=”” filter_hue=”0″ filter_saturation=”100″ filter_brightness=”100″ filter_contrast=”100″ filter_invert=”0″ filter_sepia=”0″ filter_opacity=”100″ filter_blur=”0″ filter_hue_hover=”0″ filter_saturation_hover=”100″ filter_brightness_hover=”100″ filter_contrast_hover=”100″ filter_invert_hover=”0″ filter_sepia_hover=”0″ filter_opacity_hover=”100″ filter_blur_hover=”0″][fusion_builder_row][/fusion_builder_row][/fusion_builder_container]


