Market Recap and Observations
U.S. Markets
U.S. stocks retreated from last week’s record highs in the holiday-shortened week, with global markets still on edge amid escalating global trade tensions. The Dow Jones Industrial Average ended the week down -0.2% to close at 25,916. The technology-heavy NASDAQ Composite retraced all of last week’s gain falling -2.6%, or 207 points, ending the week at 7,902.
By market cap, mid caps were the relative outperformers falling just -0.9%, while the large cap S&P 500 gave up -1.0% and the small cap Russell 2000 declined -1.6%.
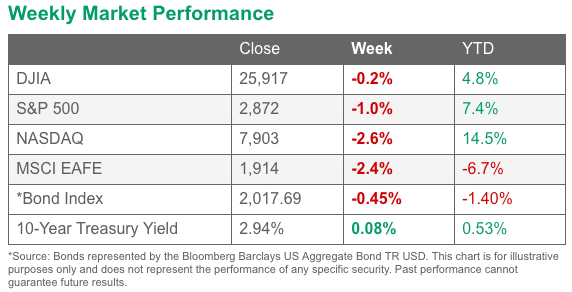
As of 9/7/18 Market Close. Source FMeX
International Markets
Canada’s TSX declined for a second week, down -1.1%, while the United Kingdom’s FTSE followed last week’s -2% drop with a further -2.1% decline. On Europe’s mainland as well, markets finished the week deep in the red. France’s CAC 40 was off -2.9% and Germany’s DAX plunged -3.3%.
In Asia, China’s Shanghai Composite was off -0.9%, Japan’s Nikkei declined -2.4%, and Hong Kong’s Hang Seng finished down ‑3.3%. As grouped by Morgan Stanley Capital International, developed markets finished the week down ‑2.8%, while emerging markets were off -3.8%.
Commodities
Energy took a break after back-to-back weekly gains with West Texas Intermediate crude oil falling ‑3% to $67.75 per barrel and Brent North Sea crude down ‑0.9% at $77.04 a barrel.
Precious metals also finished the week lower. Gold gave up -0.5%, ending the week at $1200.40 an ounce and Silver closed down ‑2.6% to $14.07 an ounce. Copper, viewed by some analysts as an indicator of worldwide economic health due to its variety of industrial uses, finished the week down -1.8%.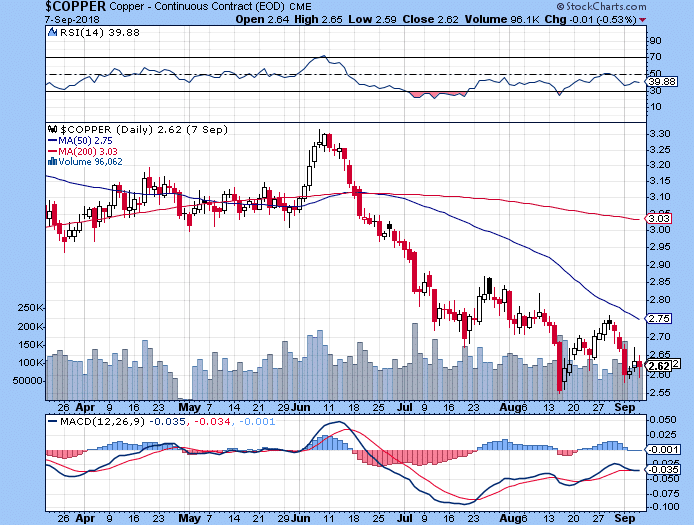
U.S. Economic News
Initial claims for new unemployment benefits fell by 10,000 to 203,000 last week, touching their lowest level since December of 1969. The reading beat consensus estimates for a decline of just 2,000 to 211,000. The four week average of new claims, smoothed to iron out weekly volatility, declined by 2,750 to 209,500. That number is also at its lowest level since December of 1969.
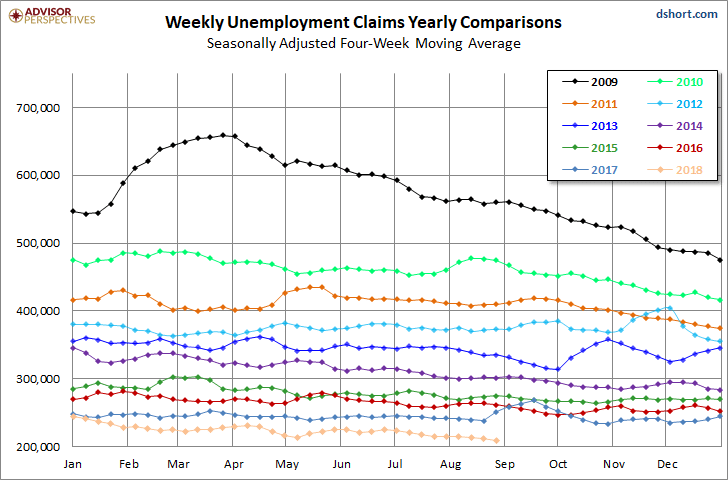 Overall, labor market analysts note that times are good. Companies have created more than 19 million new jobs in the past eight years to drive the unemployment rate down to 3.9% from a peak of 10%. In addition, companies are struggling to find skilled workers and they are reluctant to lay off experienced employees. The number of people already receiving unemployment benefits, so-called “continuing claims”, fell by 3,000 to 1.71 million.
Private sector payroll processor ADP reported the U.S. created a seasonally-adjusted 163,000 job in August, but missed expectations for 182,000 new jobs. The reading was down from the 217,000 private sector jobs created in July and its weakest increase since last October. In the details of the report, services payrolls rose 139,000 led by professional and business services, while goods-producing jobs rose by 24,000. Midsized companies did most of the hiring with 111,000 new jobs added. Although the headline number was down from last month, Neil Dutta of Renaissance Macroresearch noted “Considering how low the jobless rate is, this represents a reasonably solid pace of employment growth.”
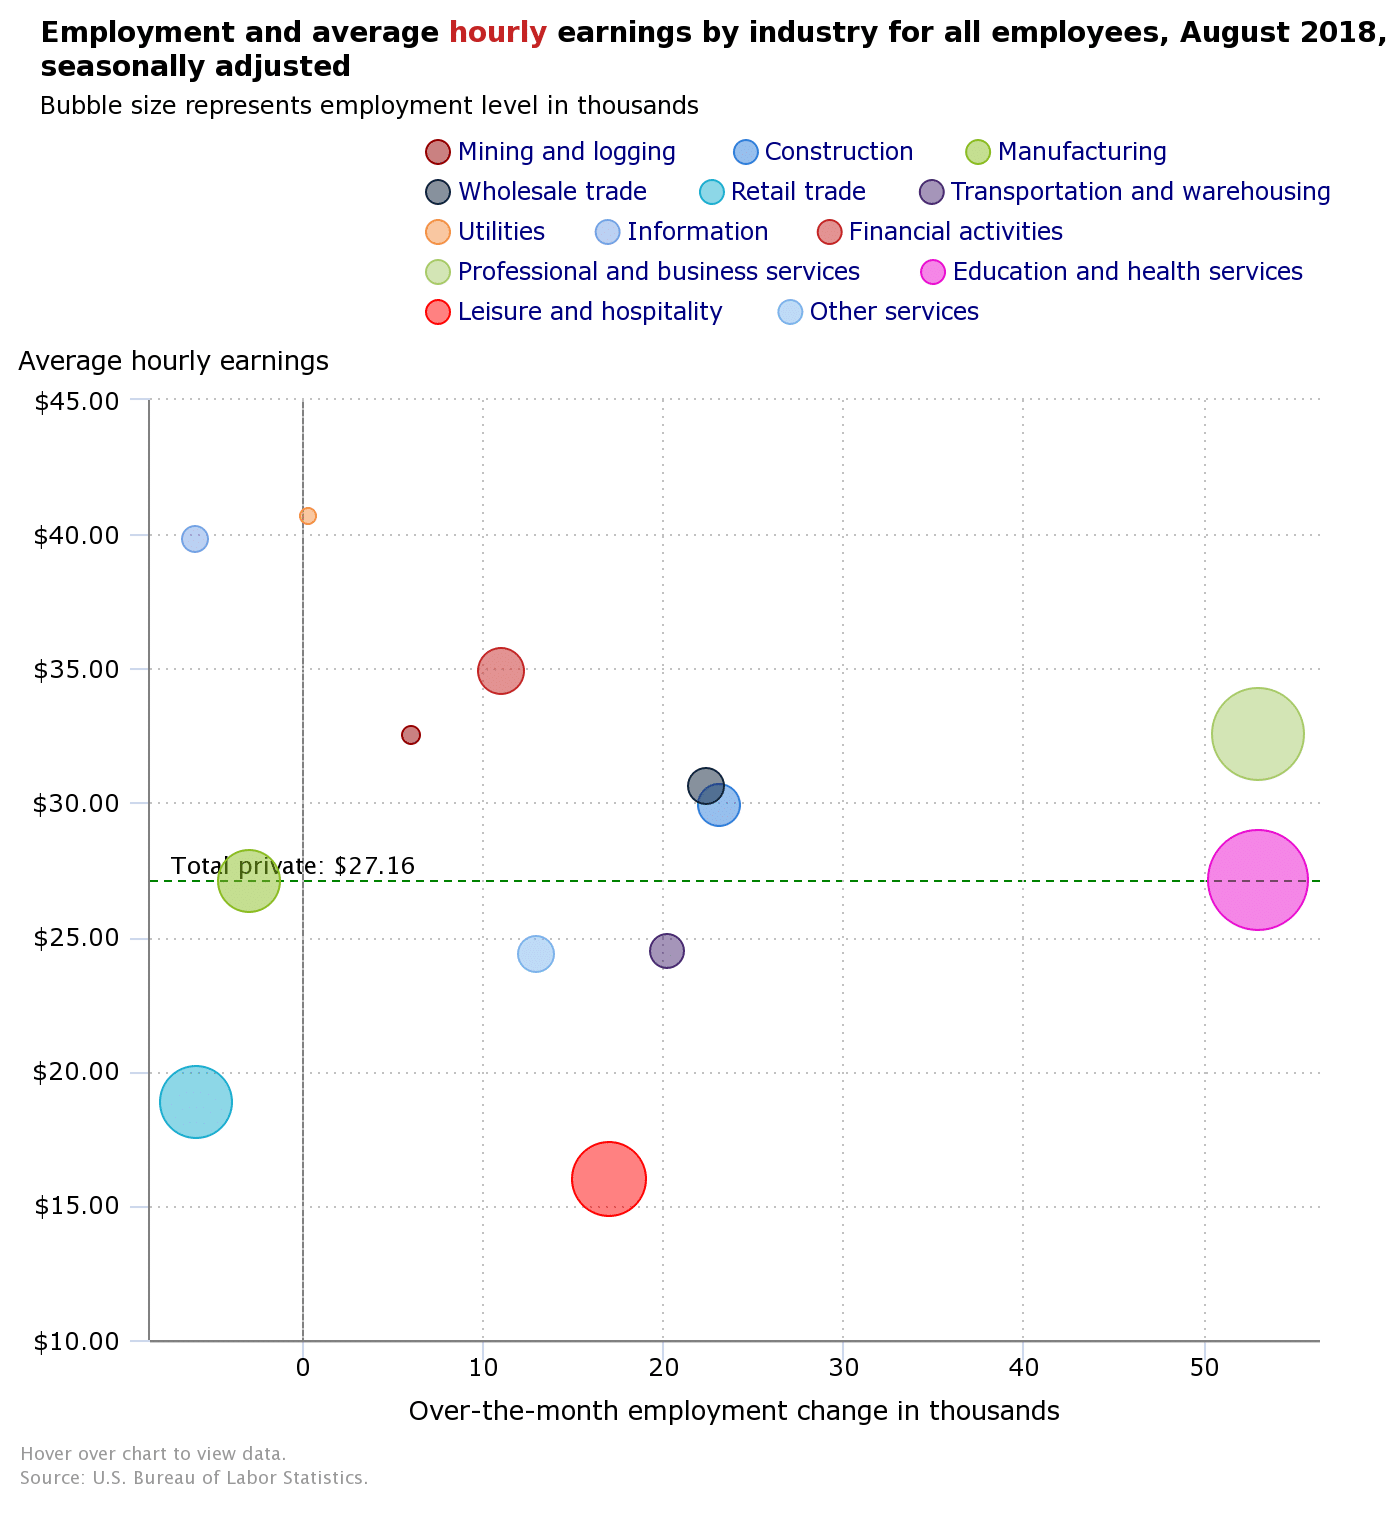
The U.S. added 201,000 new jobs and unemployment remained at an 18-year low, according to the Labor Department’s monthly Non-Farm Payrolls (NFP) report. The reading exceeded economists’ expectations for an increase of 200,000 new nonfarm jobs. The increase in hiring last month was another solid gain reflecting broad strength in the economy. However, the biggest news from the report was a sharp increase in pay.
The yearly rate of pay increases climbed to 2.9% from 2.7% marking their highest level since June 2009. In the details, white-collar professional firms added 53,000 positions, while health care providers hired 33,000 and transport firms added 20,000. Aside from a shortage of skilled labor, companies say their biggest problem is coping with a spate of higher U.S. and foreign tariffs that have raised the cost of key materials such as steel and lumber and made it harder to obtain supplies.
The Commerce Department reported spending on construction projects rose 0.1% in July, led by the public sector. Public construction spending surged 0.7% while private sector spending slipped 0.1%. Over the past year, construction spending has risen 5.8%. Overall, despite the volatile data the overarching trend in construction spending is up.
Through the first seven months of the year, expenditures were 5.2% higher than in the same period in 2017. However, some economists, like Ian Shepherdson at Pantheon Macroeconomics weren’t impressed, calling the reading “…disappointing. For now it appears that construction activity is softening after a very strong first half.”
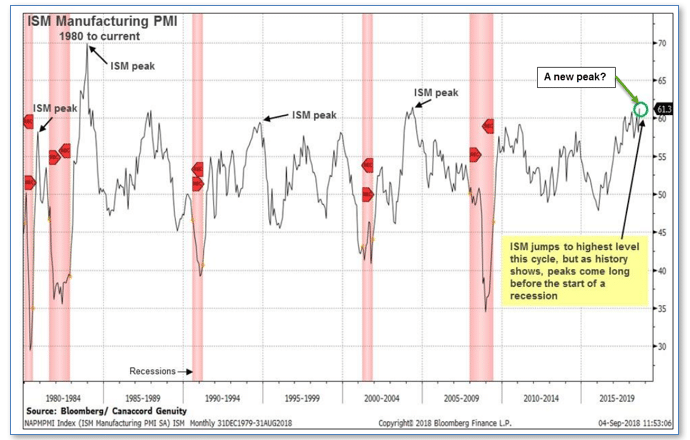
American manufacturers are on a roll, according to the Institute for Supply Management (ISM). ISM’s manufacturing index jumped to a 14-year high of 61.3 in August, up 3.2 points from July. It was the biggest monthly gain since March 2010 and its highest reading since May of 2004. Economists had expected a drop to 57.9. In the details of the report, all of the ISM’s individual components advanced.
The new-orders index climbed 3.2 points to 65.1 while the employment gauge added 2 points to 58.5. Sixteen of the eighteen industries tracked by ISM reported expansion last month, indicating a broad-based expansion. The ISM index is compiled from a survey of executives who order raw materials and other supplies for their companies.
ISM’s survey of services companies also showed rapid growth last month. ISM’s non-manufacturing index rebounded 2.8 points to 58.5 as services activity strengthened. It was the biggest gain since January, and reversed most of the steep decline the previous month. All four of the services index components (new orders, business activity, employment, and supplier deliveries) rose last month, led by a 4.2 point rebound in the business activity index—the most since September 2016. Chief U.S. economist Jim O’Sullivan of High Frequency Economics noted the ISM report was “quite strong, despite ongoing concerns about trade policy.”
So far the imposition of U.S. tariffs on a variety of foreign goods has done nothing to curb the trade deficit. The trade deficit surged $4.3 billion in July to $50.1 billion—its biggest gap since February. The increase in July was the biggest since March 2015 as the strong domestic economy fueled demand for imports, helped by an especially strong U.S. dollar.
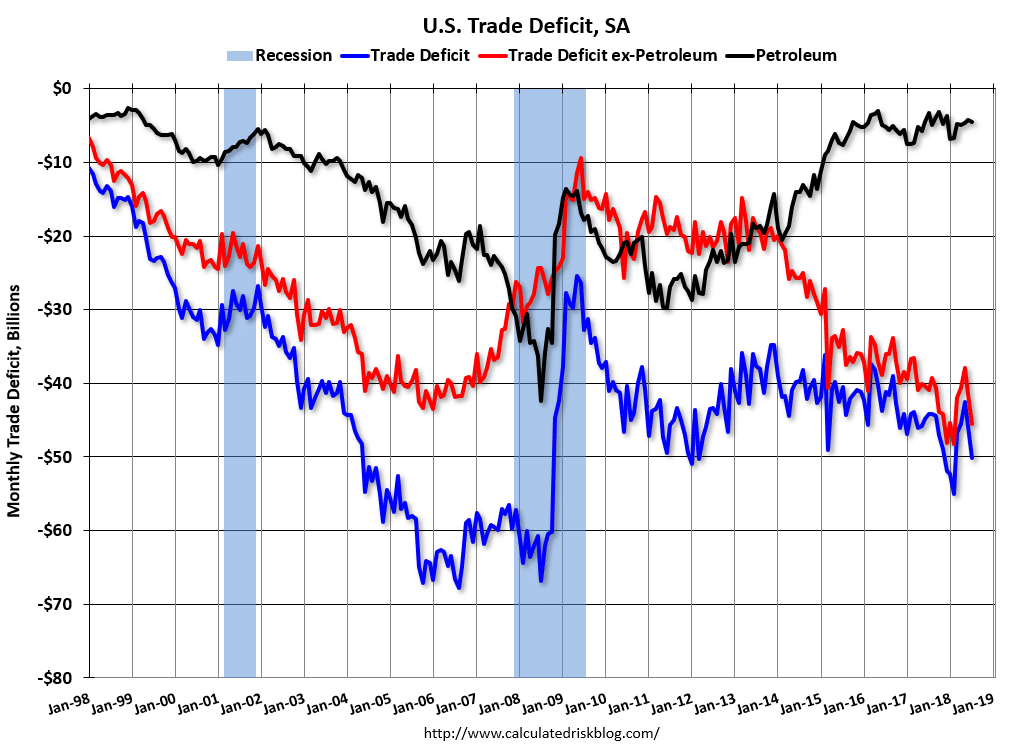 These two factors appeared to have overwhelmed the dampening effect of the recently enacted U.S. tariffs. Imports climbed 0.9% in July, the most in five months, due to gains in food, vehicles, capital goods ex-autos (predominantly computers and computer accessories) and other merchandise. Exports fell 1%, with the most notable drop being a 6.3% plummet in food exports as China’s retaliatory tariffs hit soybeans and other farm products.
Interesting “Tidbit” of the Week
Nine years into the current bull market more and more are beginning to wonder “how much longer can it go on?” Tony Dwyer, equity strategist at Canaccord Genuity, reiterated his S&P 500 target of 3,200 for the end of this year (a nearly 11% rise from current levels), based on the strong manufacturing report this week.
Dwyer went further and projected the index to rise to 3,360 in 2019, highlighting his view that a recession isn’t lurking “anywhere close”. He wrote “The Institute for Supply Management (ISM) showed that the manufacturing sector remains on very solid ground.
History shows that since 1950, the ISM typically peaks well before the economy enters recession or the S&P 500 hits the cycle high, especially over the past three levered economic periods.” Dwyer notes that on average the Institute for Supply Management’s manufacturing reading peaked a median 31.5 months before the start of a recession, and that the S&P 500 usually gains about 35.4% in the subsequent two years following the peak. While there are a couple of exceptions to his rule, Dwyer notes that the inflation and interest rate environments then were quite different from the current situation. source: Canaccord Genuity
source: Canaccord Genuity
Market Indicators
The Big Picture
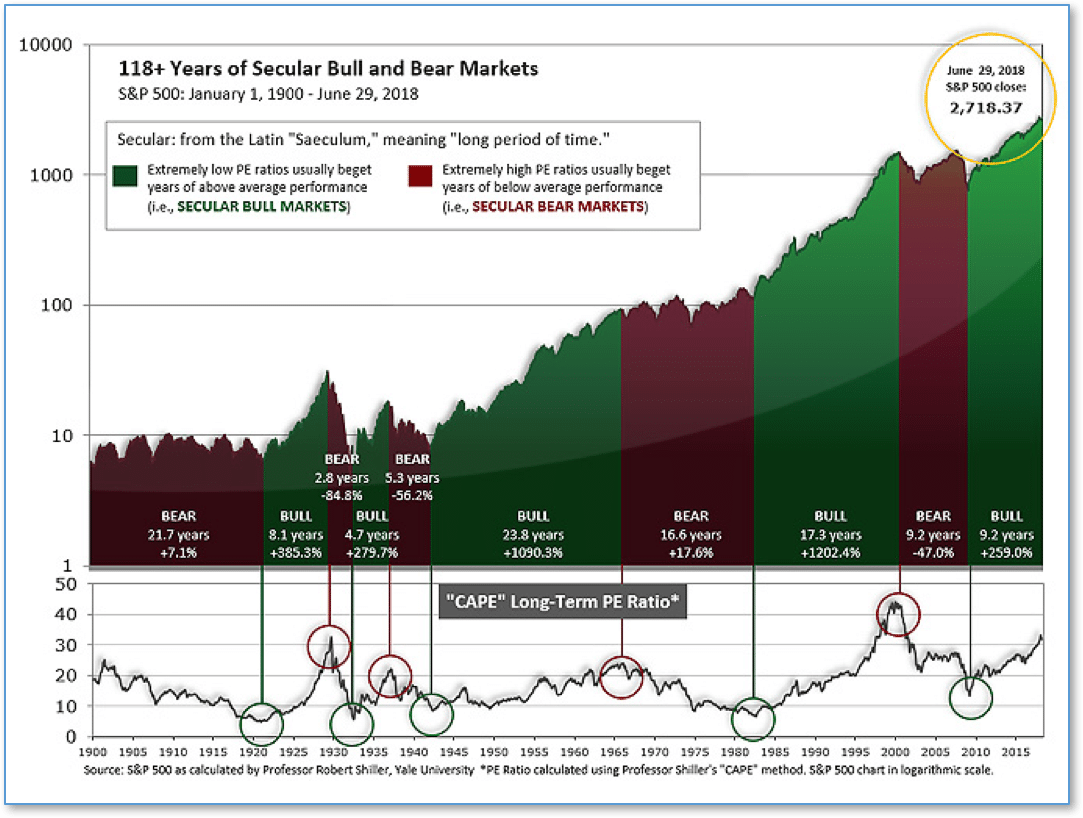
Fig 1
In the “decades” timeframe, the current Secular Bull Market could turn out to be among the shorter Secular Bull markets on record. This is because of the long-term valuation of the market which, after only eight years, has reached the upper end of its normal range.
The long-term valuation of the market is commonly measured by the Cyclically Adjusted Price to Earnings ratio, or “CAPE”, which smooths out shorter-term earnings swings in order to get a longer-term assessment of market valuation. A CAPE level of 30 is considered to be the upper end of the normal range, and the level at which further PE-ratio expansion comes to a halt (meaning that increases in market prices only occur in a general response to earnings increases, instead of rising “just because”).
Of course, a “mania” could come along and drive prices higher – much higher, even – and for some years to come. Manias occur when valuation no longer seems to matter, and caution is thrown completely to the wind as buyers rush in to buy first and ask questions later.
Two manias in the last century – the 1920’s “Roaring Twenties” and the 1990’s “Tech Bubble” – show that the sky is the limit when common sense is overcome by a blind desire to buy. But, of course, the piper must be paid and the following decade or two are spent in Secular Bear Markets, giving most or all of the mania gains back.
See Fig. 1 for the 100-year view of Secular Bulls and Bears. The CAPE is now at 33.00, down from the prior week’s 33.33, and exceeds the level reached at the pre-crash high in October, 2007. This value is in the lower end of the “mania” range. Since 1881, the average annual return for all ten year periods that began with a CAPE around this level have been in the 0% – 3%/yr. range. (see Fig. 2).
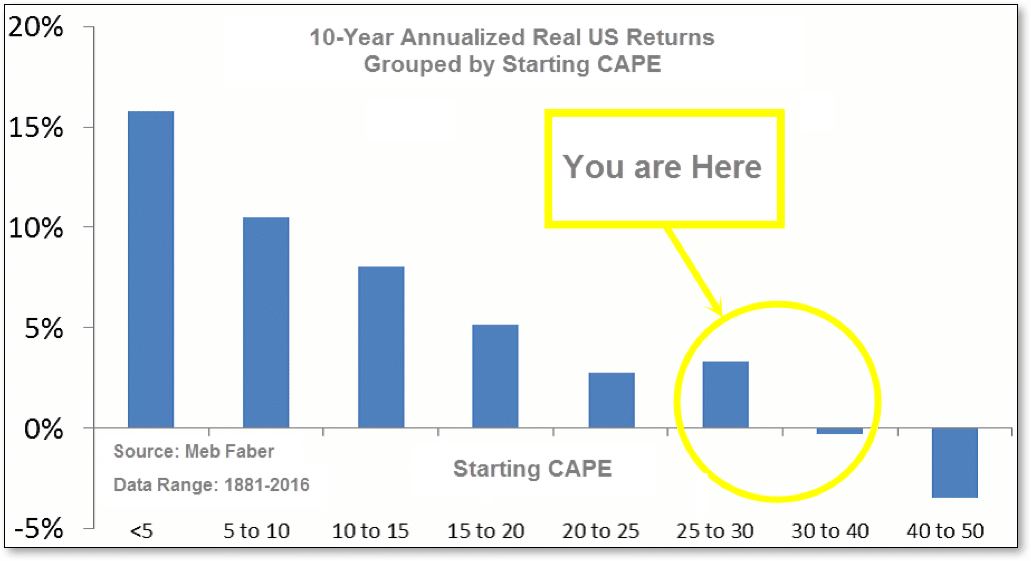
Fig 2
Long Term Indicators
The “big picture” is the months-to-years timeframe – the timeframe in which Cyclical Bulls and Bears operate. The U.S. Bull-Bear Indicator (see Fig. 3) is in Cyclical Bull territory at 76.09, down from the prior week’s 78.22.
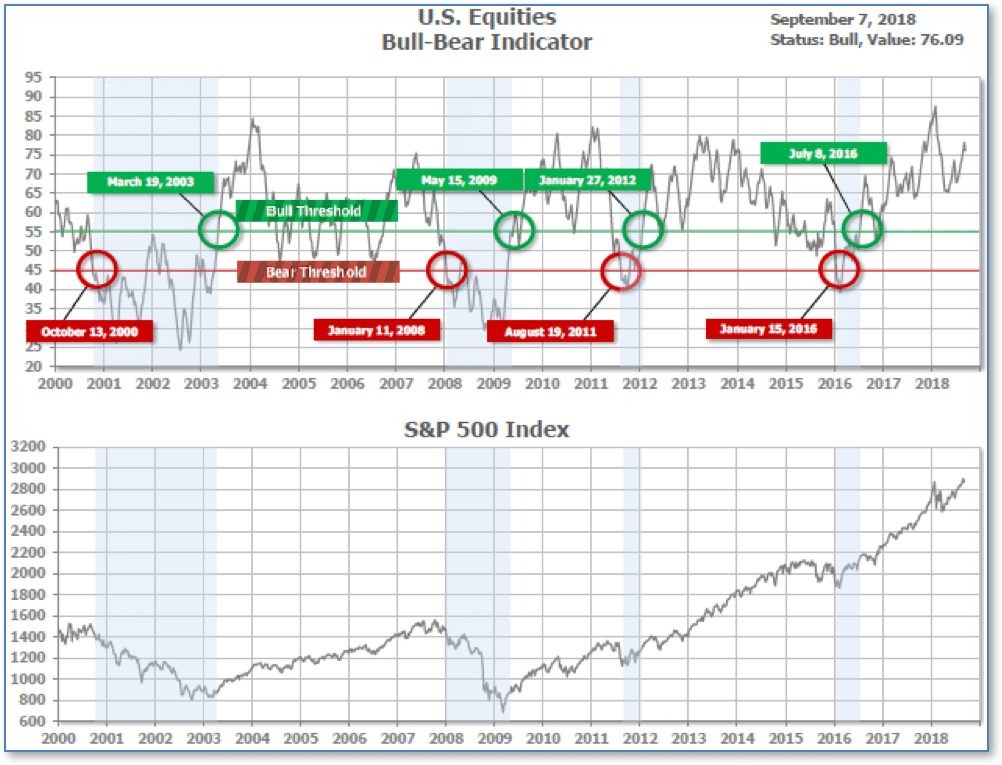
Fig 3
Intermediate and Short-Term Indicators
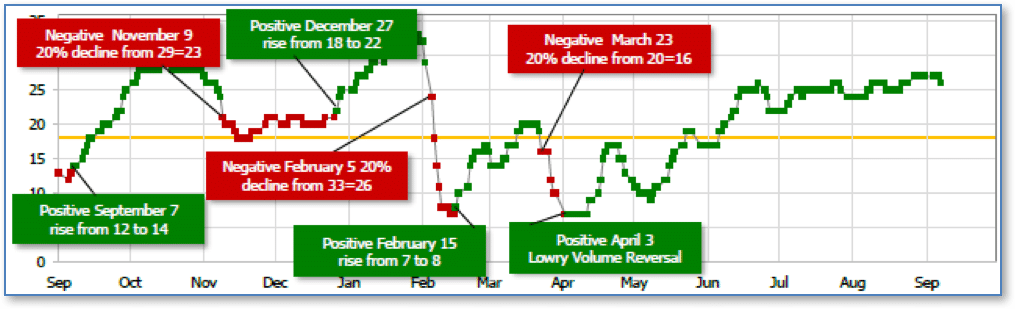
The Shorter-term (weeks to months) Indicator (see Fig. 4) turned positive on April 3rd. The indicator ended the week at 26, down from the prior week’s 27. Separately, the Intermediate-term Quarterly Trend Indicator – based on domestic and international stock trend status at the start of each quarter – was positive entering July, indicating positive prospects for equities in the third quarter of 2018.
Indicator Summary
In the Secular (years to decades) timeframe (Figs. 1 & 2), the long-term valuation of the market is simply too high to sustain rip-roaring multi-year returns – but the market has entered the low end of the “mania” range, and all bets are off in a mania. The only thing certain in a mania is that it will end badly…someday.
The Bull-Bear Indicator (months to years) is positive (Fig. 3), indicating a potential uptrend in the longer timeframe.
In the intermediate timeframe, the Quarterly Trend Indicator (months to quarters) is positive for Q3, and the shorter (weeks to months) timeframe (Fig. 4) is positive. Therefore, with all three indicators positive, the U.S. equity markets are rated as Positive.
Institutional Sentiment
The ranking relationship between the defensive SHUT sectors is one way to gauge institutional investor sentiment in the market.
“S”=Staples [a.k.a. consumer non-cyclical]
“H”=Healthcare
“U”=Utilities and
“T”=Telecom
and the offensive DIME sectors:
“D”=Discretionary [a.k.a. Consumer Cyclical]
“I”=Industrial,
“M”=Materials
“E”=Energy
The average ranking of Defensive SHUT sectors rose to 15.75 from last week’s 16.50, while the average ranking of Offensive DIME sectors fell to 16.25 from last week’s 15.25. The Offensive DIME sectors now lag behind the Defensive SHUT sectors by a modest amount.
Note: these are “ranks”, not “scores”, so smaller numbers are higher ranks and larger numbers are lower ranks.
___________________
(sources: all index return data from Yahoo Finance; Reuters, Barron’s, Wall St Journal, Bloomberg.com, ft.com, guggenheimpartners.com, ritholtz.com, markit.com, financialpost.com, Eurostat, Statistics Canada, Yahoo! Finance, stocksandnews.com, marketwatch.com, wantchinatimes.com, BBC, 361capital.com, pensionpartners.com, cnbc.com, FactSet)
© 2018 Riverbend Investment Management, LLC. This presentation is intended for informational purposes only.
The information and statistical data contained herein have been obtained from sources we believe to be reliable but in no way are warranted by us as to accuracy or completeness. The opinions expressed are those of Riverbend Investment Management, LLC. and are subject to change without notice. No part of this presentation may be reproduced in any manner without the written permission of Riverbend Investment Management, LLC. Any securities discussed should not be construed as a recommendation to buy or sell and there is no guarantee that these securities will be held for a client’s account nor should it be assumed that they were or will be profitable. Past performance does not guarantee future comparable results.
Riverbend Investment Management, LLC is a Registered Investment Adviser


