Market Recap and Observations
U.S. Markets
The major U.S. benchmarks ended the week mixed with large cap indexes far outperforming smaller cap indexes and the technology-heavy NASDAQ Composite finishing down. One of the week’s most notable events was Facebook’s dramatic 19% plunge following a disappointing earnings report that wiped $120 billion from its market cap.
The Dow Jones Industrial Average rose 393 points on the week, closing at 25,451 – a gain of 1.6%. The NASDAQ Composite retreated for a second week, falling 1.1% to close at 7,737. The large cap S&P 500 added 0.6% while the mid cap S&P 400 and small cap Russell 2000 went the other way, ending down ‑1.2% and ‑2.0%, respectively.
International Markets
Canada’s TSX fell a second consecutive week, retreating -0.3%, while the United Kingdom’s FTSE rose for a third week in a row, up 0.3%. On Europe’s mainland, France’s CAC 40 and Germany’s DAX gained 2.1% and 2.4%, while Italy’s Milan FTSE added 0.7%. In Asia, China’s Shanghai Composite rallied 1.6% and Japan’s Nikkei ended the week essentially flat, up just 0.07%. As grouped by Morgan Stanley Capital International, developed markets added 1.1% last week, while emerging markets rose 1.7%.
Commodities
Gold continued its sell-off, now down six out of the last seven weeks. Gold finished the week at $1223.00 an ounce, a loss of -0.7%. Silver traded down -0.4%, ending the week at $15.49 an ounce.
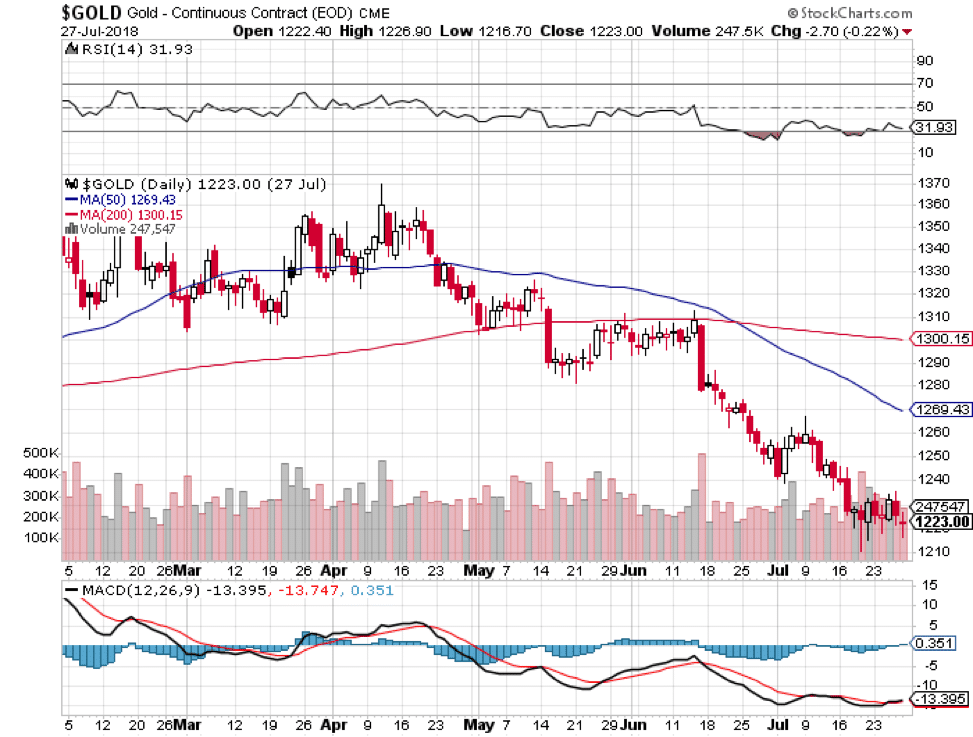
Energy, though, had a positive week after three consecutive down weeks. West Texas Intermediate crude oil rose 0.6% finishing the week at $68.69 a barrel.
Copper rebounded after falling for six consecutive weeks, finishing up 1.7%. With its variety of uses, the industrial metal is sometimes referred to as “Dr. Copper” by analysts for its ability to forecast global economic health.
U.S. Economy
The number of people seeking new unemployment benefits rose last week after hitting a 48-year low. The Labor Department reported initial jobless claims climbed by 9,000 to 217,000 in the week ended July 21, but below the 219,000 economists had estimated.
The more stable monthly average of new claims fell by 2,750 to 218,000. Overall, the labor market continues to be solid with job growth stronger so far this year than last year. In addition, continuing claims, which counts the number of people already receiving unemployment benefits, fell by 8,000 to 1.75 million. That number is reported with a one week delay.
The number of existing homes sold slid for a third consecutive month in June, hitting a 5-month low as the housing market continues to slow. The National Association of Realtors (NAR) reported existing home sales ran at a seasonally-adjusted annual rate of 5.38 million in June. The number was in line with consensus estimates but down 2.2% from the same time last year. At the current sales rate, it would take 4.3 months to exhaust the available inventory—significantly below the six months that is generally considered a balanced housing market.
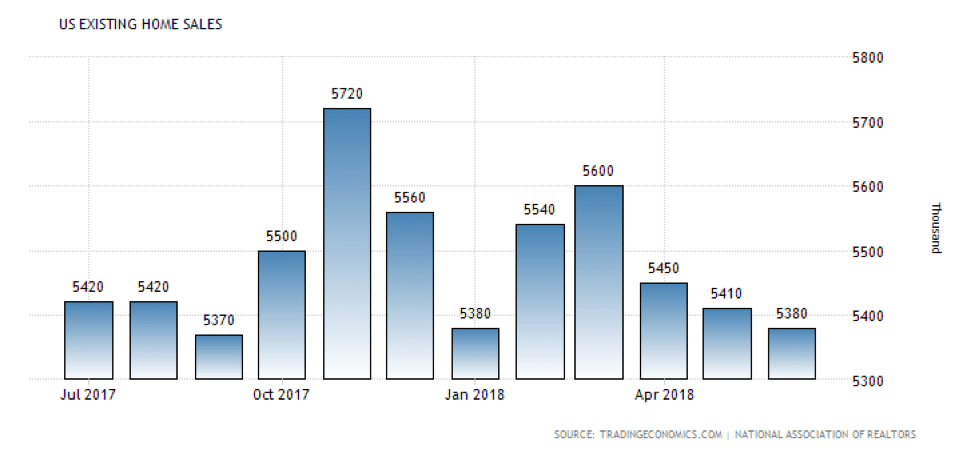
Homes were on the market for an average of 26 days in June. The median price of a home sold in June was $276,900—a new all-time high, and up 5.2% from June 2017. Higher prices and higher mortgage rates appear to be weighing on buyers. Sales were mixed regionally in the NAR report, rising 5.9% in the Northeast and 0.8% in the Midwest, but off 2.2% in the South and 2.6% in the West.
Along with existing home sales, sales of new homes also slid in June as higher mortgage rates, increasing home prices, and relatively few available homes weighed. The Commerce Department reported new home sales ran at a 631,000 annualized pace last month, missing economists’ forecasts of 660,000. From May, sales of new homes plunged 5.3%, but remain 2.4% higher than the same time last year. The median price of a new home sold during the month was $302,100, 4.2% lower than in June 2017. Year-to-date, sales are up 6.9% from the same time last year, but many housing analysts have suggested that there’s little momentum left in the market. At the current rate of sales, there is a 5.7 months’ supply of homes available on the market–the most since last summer. Analysts noted that the Commerce Department’s data is often heavily-revised and that it will likely take a few more months before clear trends emerge.
Research firm IHS Markit reported both the manufacturing and services sides of the economy showed steady and rapid growth in July in its latest preliminary, or “flash”, reading. The seasonally adjusted preliminary IHS Markit U.S. Composite Purchasing Managers’ Index (PMI) fell to 55.9 in July. Markit’s manufacturing index rose a tick to 55.5, while the services index slipped 0.3 point to 56.2 (readings over 50 indicate expansion, below 50 indicate contraction). The latest PMI report indicates the economy continued to expand at a healthy pace mid-summer despite the heightened concerns over global trade. Markit noted the biggest single worry for companies is rising prices. Higher input costs were passed on to consumers at the fastest pace since the firm began compiling reports in the fall of 2009.
Orders for goods expected to last longer than 3 years, so-called “durable goods”, rose 1% last month – the first increase in three months, according to the Commerce Department. In the details of the report, transportation equipment orders led the increase, rising 2.2% in June. Civilian aircraft orders rose 4.3% following an 11.6% drop in May. Orders for autos rose 4.4%, essentially reversing the 4.5% drop the prior month. Minus transportation, orders were up 4%, and excluding defense-related goods orders rose 1.5%. The closely-watched orders for nondefense capital goods, excluding aircraft, rose 0.6% following a 0.7% gain in May. Analysts state orders are growing at a healthy clip–year-over-year orders are up 8.4%.
A measure of the strength of the U.S. economy from the Chicago Federal Reserve rebounded last month following a sharp drop in May. The Chicago Fed’s National Activity Index came in at 0.43 for June following a -0.45 reading in May.
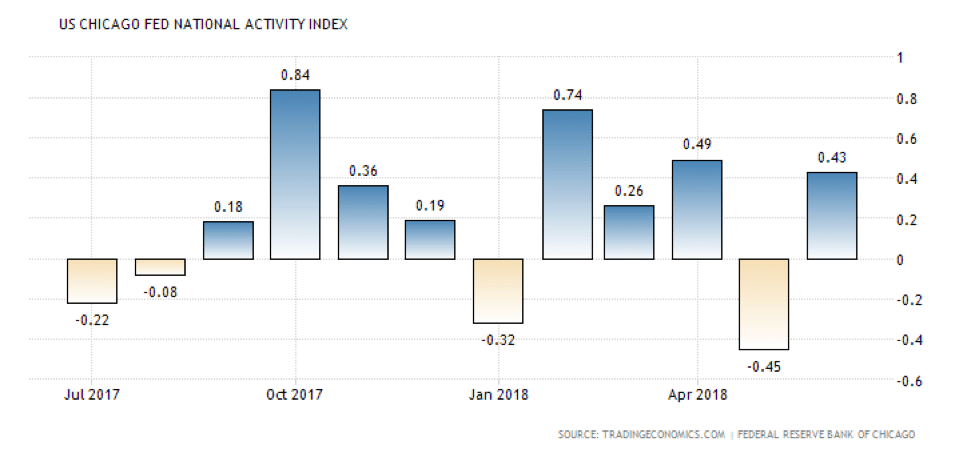
The index’s less-volatile three-month moving average edged up to 0.16, up 0.06 point from May. In the details of the report, 45 of the 85 indicators made positive contributions in June, while 40 weighed. Notably, production-related indicators, such as factory activity, contributed 0.36 to the index, a sharp rebound from the -0.56 drag in May. The Chicago Fed’s index is a weighted average of 85 economic indicators, constructed so that zero represents trend growth and a three-month average below -0.70 suggests a recession is underway.
The U.S. economy accelerated at a 4.1% rate in the second quarter of year, its fastest in almost four years. Strong consumer and business spending, as well as a surge in exports helped drive economic growth. The reading was the third-best growth rate since the end of the Great Recession.
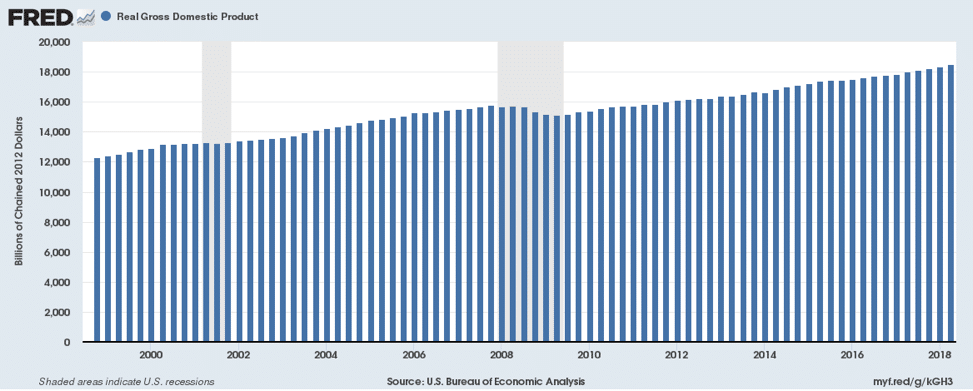
In addition to the strong second quarter, the Commerce Department revised its reading for the first quarter up 0.2% to 2.2%. Shortly after the release, President Donald Trump stated, “We’re on track to hit the highest annual growth rate in over 13 years. And I will say this right now and I will say it strongly, as the deals come in one by one, we’re going to go a lot higher than these numbers, and these are great numbers.” Peter Boockvar, chief investment officer at Bleakley Advisory Group noted that if it hadn’t been for a big upside to inflation, “GDP would have been much better.”
International
A Republican congressman from Wisconsin says Canada has committed “economic terrorism” by imposing tariffs on U.S. agricultural products. Wisconsin Representative Sean Duffy stated “We knew that Europe, China, Canada and Mexico would go after American Ag. That’s how they try to take us down. This is, I think, economic terrorism in a way.” Canada has imposed tariffs on more than 200 U.S. products including cucumbers, orange juice, and beef in response to President Donald Trump’s own tariffs on Canadian steel and aluminum.
The Organization for Economic Cooperation and Development (OECD) stated Canada’s economy would benefit from bringing more women, youth, seniors, and immigrants into its work force. In the OECD’s biennial report, it’s recommended that among other things, Canada invest more in affordable child care, raise its retirement age, and do a better job of matching immigrants’ qualifications and experience to specific skills needs. The OECD described Canada as being among the organization’s leaders in “delivering the best outcomes for its citizens,” and lauded its strong immigration policies.
Economic growth in the United Kingdom has rebounded in the second quarter on the strength of its service sector despite a weak first quarter, according to the latest data from research firm IHS Markit. Markit Chief Economist Chris Williamson cites evidence that suggests that the UK’s economy has grown 0.4% in the second quarter—double the growth rate recorded for the January to March quarter. Bad weather was predominantly to blame for the poor first quarter result. Consistent warm weather through the second quarter appears to have lured more Britons into spending at hotels, bars, and restaurants. Details of the survey showed that business and financial services saw strong demand, as well as manufacturing and construction.
For the second quarter in a row, France’s Gross Domestic Product expanded at just 0.2% according to the French National Institute of Statistics and Economic Studies, or INSEE. Economists had expected an uptick to 0.3% growth. The latest reading is significantly below the 0.7% rate averaged in 2017. Economists’ noted that bad weather and labor strikes played a large part in France’s poor economic performance in the first half of the year. France’s main growth engine, consumer spending, continued to stagnate. Spending contracted in the second quarter for the first time in almost two years. Separate data showed that for the month of June, households raised their spending by just 0.1% – well short of the 0.6% rebound expected.
Confidence among German business owners slid for a second month as companies grew increasingly nervous about exports amid growing trade tensions. The Ifo Institute’s business climate index for Germany downticked 0.1 point to 101.7 in June to its lowest level since March of 2017. Nonetheless, the reading exceeded economists’ estimates of a decline to 101.5.
Carsten Brzeski, chief economist at ING Germany, stated that the latest index “still points to solid growth but trade war fears continue to weigh on expectations.” U.S. President Donald Trump has threatened to impose a 20% tariff on European car imports and wants Europe to reduce its 10% tax on U.S. car imports (the U.S. only applies a 2.5% tariff currently). Germany’s economy is particularly exposed to the latest threat because of the size of its auto industry.
China is reacting quickly to its slowing economy amid escalating global trade tensions. Beijing announced a range of measures including tax cuts, increased infrastructure spending and new loans to businesses as it seeks to stimulate growth. The country’s cabinet, the State Council, this week encouraged local governments to tap the bond market, while its central bank lent more than 500 billion yuan ($74 billion) to banks in a push to get them to lend.
It was the largest one-time amount since such injections started in 2014. The Chinese government said in its statement this week that the new stimulus was intended to help the country cope with “an uncertain external environment.” The world’s second-biggest economy grew by an annualized 6.7% in the quarter ended June 30, its slowest rate of growth in almost two years.
Japanese Finance Minister Taro Aso stated he wanted next years’ Group of 20 meetings in Osaka to focus on identifying problems in the global economy before they worsen. The G20 policymakers from wealthy and developing countries address a range of problems that could derail global growth such as trade protectionism, monetary policy, investment flows, and currency swings he noted.
“The role the G20 should play next year is to nip crises in the bud before they develop further,” Aso added, saying he wanted next year’s gathering “to promote investment in high-quality infrastructure to ensure economic growth.” Aso also stated Japan’s talks with U.S. Trade Representative Robert Lighthizer will take place in August, rather than July as had originally been expected. U.S. President Donald Trump and Japanese Prime Minister Shinzo Abe agreed this year to set up the dialogue as the Trump administration renegotiates trade relationships it considers unfair to U.S. companies and workers.
Interesting “Tidbit” of the Week
The next time you hear a 30-something complaining about how much tougher it is now than in earlier generations, well…maybe they’re right.
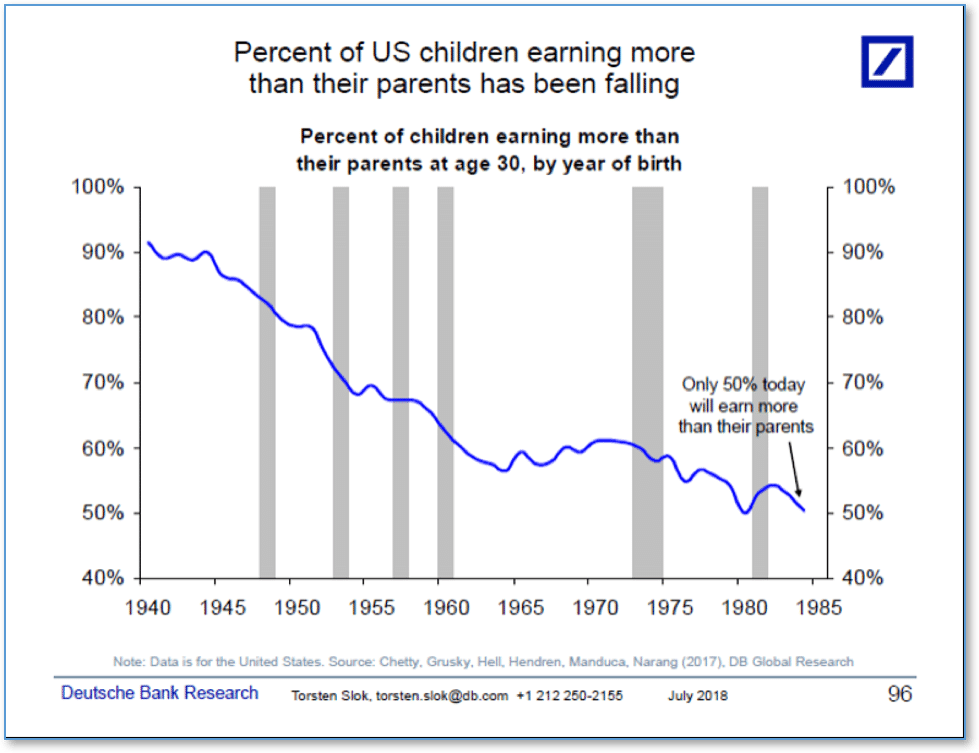
Deutsche Bank analyst Torsten Slok distributed a research note showing the overall decline in earnings power for 30-year old Americans over the last several decades. In the note, Slok stated that the “percentage of children earning more than their parents has been falling steadily since 1945.”
In 1955, 70% of 30-year-olds were earning more than their parents.
Today, just 50% are expected to earn more—and that number is trending down.
Bloomberg recently used data from the Federal Reserve Bank of St. Louis to show that today’s 30-year-olds are “weighed down by student debt and stagnant wages.” Slok’s note corresponds with separate data from research firm Axios that showed more of today’s 30-year-olds are living with their parents, paying higher college tuition, taking on more debt, and buying fewer homes than 30-year-olds four decades ago.
Institutional Sentiment
The ranking relationship between the defensive SHUT sectors is one way to gauge institutional investor sentiment in the market.
“S”=Staples [a.k.a. consumer non-cyclical]
“H”=Healthcare
“U”=Utilities and
“T”=Telecom
and the offensive DIME sectors:
“D”=Discretionary [a.k.a. Consumer Cyclical]
“I”=Industrial,
“M”=Materials
“E”=Energy
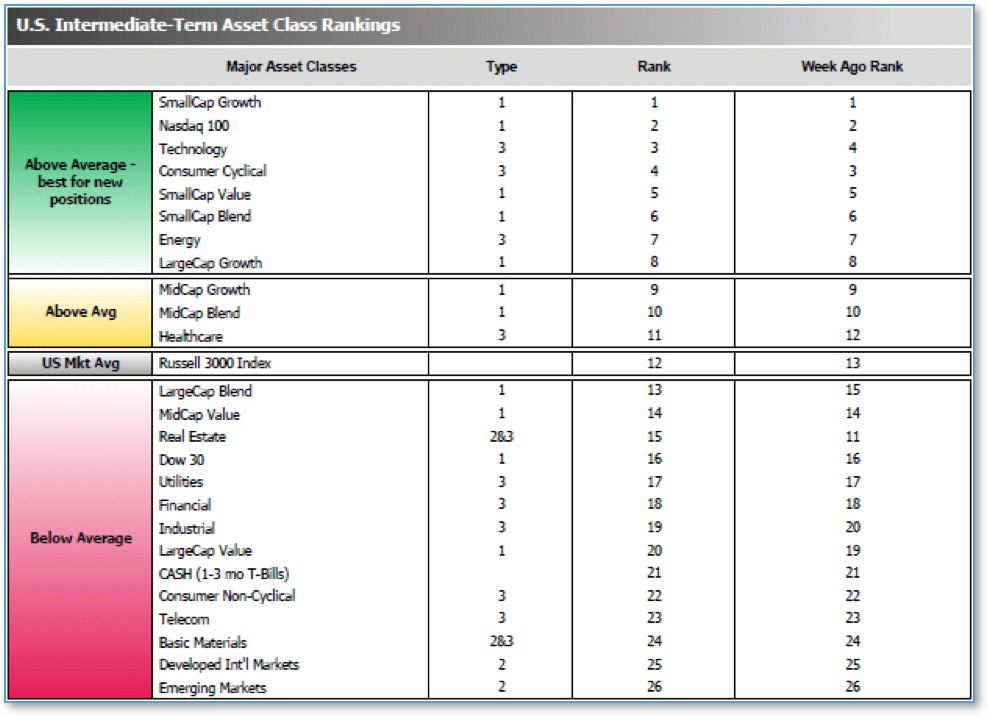
The average ranking of Defensive SHUT sectors rose to 18.25 from the prior week’s 18.50, while the average ranking of Offensive DIME sectors was unchanged at 13.50. The lead of the Offensive DIME sectors over the Defensive SHUT sectors shrank a bit.
Note: these are “ranks”, not “scores”, so smaller numbers are higher ranks and larger numbers are lower ranks.
___________________
(sources: all index return data from Yahoo Finance; Reuters, Barron’s, Wall St Journal, Bloomberg.com, ft.com, guggenheimpartners.com, ritholtz.com, markit.com, financialpost.com, Eurostat, Statistics Canada, Yahoo! Finance, stocksandnews.com, marketwatch.com, wantchinatimes.com, BBC, 361capital.com, pensionpartners.com, cnbc.com, FactSet)
© 2018 Riverbend Investment Management, LLC. This presentation is intended for informational purposes only.
The information and statistical data contained herein have been obtained from sources we believe to be reliable but in no way are warranted by us as to accuracy or completeness. The opinions expressed are those of Riverbend Investment Management, LLC. and are subject to change without notice. No part of this presentation may be reproduced in any manner without the written permission of Riverbend Investment Management, LLC. Any securities discussed should not be construed as a recommendation to buy or sell and there is no guarantee that these securities will be held for a client’s account nor should it be assumed that they were or will be profitable. Past performance does not guarantee future comparable results.
Riverbend Investment Management, LLC is a Registered Investment Adviser


