Market Recap and Observations
U.S. Markets
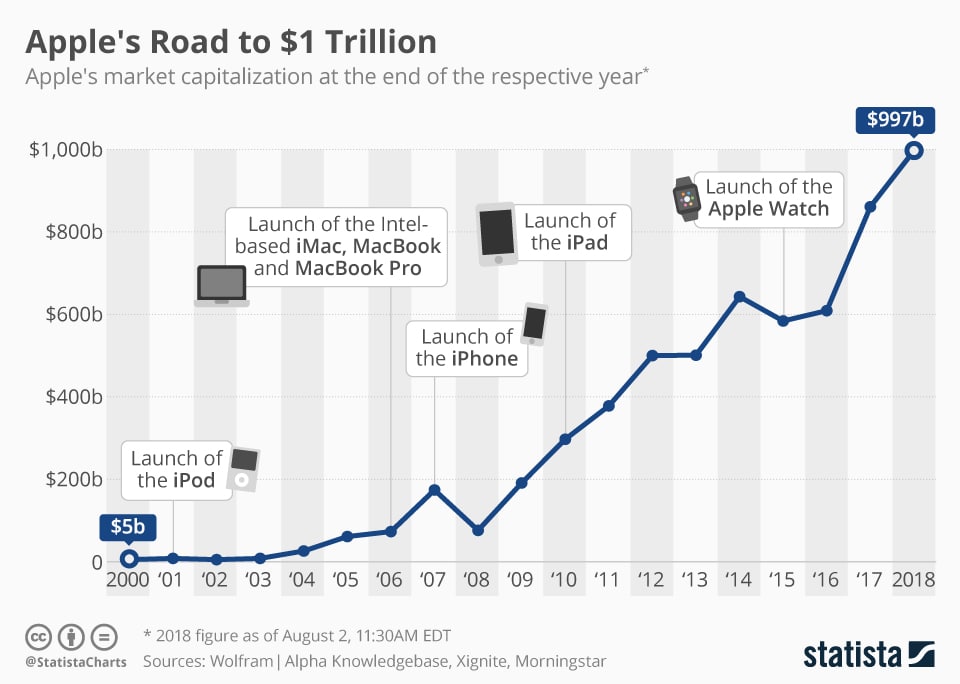
The broader U.S. stock market indexes were generally up for the week as Apple lifted the information technology sector out of a brief slump. Apple became the first company to reach $1 trillion in market capitalization after its stock rallied more than 8% in the days following its earnings release.
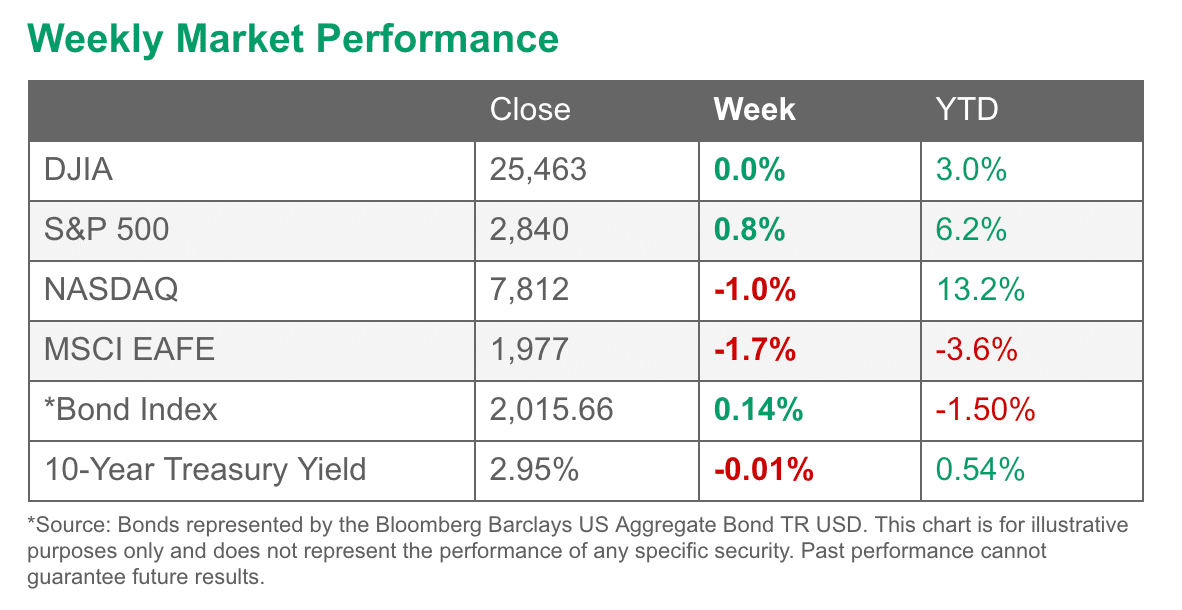
The Dow Jones Industrial Average added 11 points, or 0.05%, to close at 25,462. The technology-heavy NASDAQ Composite shrugged off early weakness and surged 74 points to close at 7,812, a gain of 1.0%.
By market cap, mid caps were the clear leader with the S&P 400 mid cap index adding 1.3%, while the large cap S&P 500 and small cap Russell 2000 indexes added 0.8% and 0.6%, respectively.
International Markets
Canada’s TSX added 0.2%, rebounding from last week’s 0.3% loss while the United Kingdom’s FTSE retreated -0.6%. On Europe’s mainland, France’s CAC 40 slipped -0.6%, Germany’s DAX dropped ‑1.9%, and Italy’s Milan FTSE ended down -1.7%. In Asia, China’s Shanghai Composite plunged -4.6%, while Japan’s Nikkei was off -0.8%. As grouped by Morgan Stanley Capital International, developed markets fell ‑1%, while emerging markets were off -1.1%.
Commodities
Precious metals ended the week down modestly, with Gold off 20 cents to $1223.20 an ounce and Silver down 3 cents to $15.46 an ounce. In energy, West Texas Intermediate crude oil retreated -0.3% to finish the week at $68.49 per barrel. Copper, seen by some analysts as a barometer of global economic health due to its variety of uses, finished the week down -1.4%.
July Summary
The Dow Jones Industrial Average was the clear leader among US indexes in July, adding over 1100 points, a gain of 4.7%, while the Nasdaq added 2.2%.
By market cap, the large cap S&P 500 added 3.6% in July, while mid caps and small caps lagged, each rising a lesser 1.7%. International markets were generally higher in July, as well. Canada rose 1%, the UK added 1.5%, France’s CAC 40 gained 3.5%, Germany’s DAX rose 4%, and Italy’s Milan FTSE finished up 2.7%.
Asian markets were weaker than their European counterparts, but still positive. China’s Shanghai Composite managed a 1% gain, while Japan’s Nikkei added 1.1%. As grouped by Morgan Stanley Capital International, developed markets added 2.9% and emerging markets rose 3.5%.
Commodities, on the other hand, had a tough month. Oil was off -6.6% for the month, Gold retreated -1.6%, Silver fell a deeper -3.6%, and Copper brought up the rear among metals by finishing July down -4.6%.
U.S. Economic News
Initial claims for new unemployment benefits inched up by 1,000 to 218,000 last week remaining below economists’ forecasts of a 220,000 reading. Claims haven’t been this low since the early 1970’s. The less volatile monthly average of new claims dropped by 3,500 to 214,500—its second-lowest reading in the past nine years.
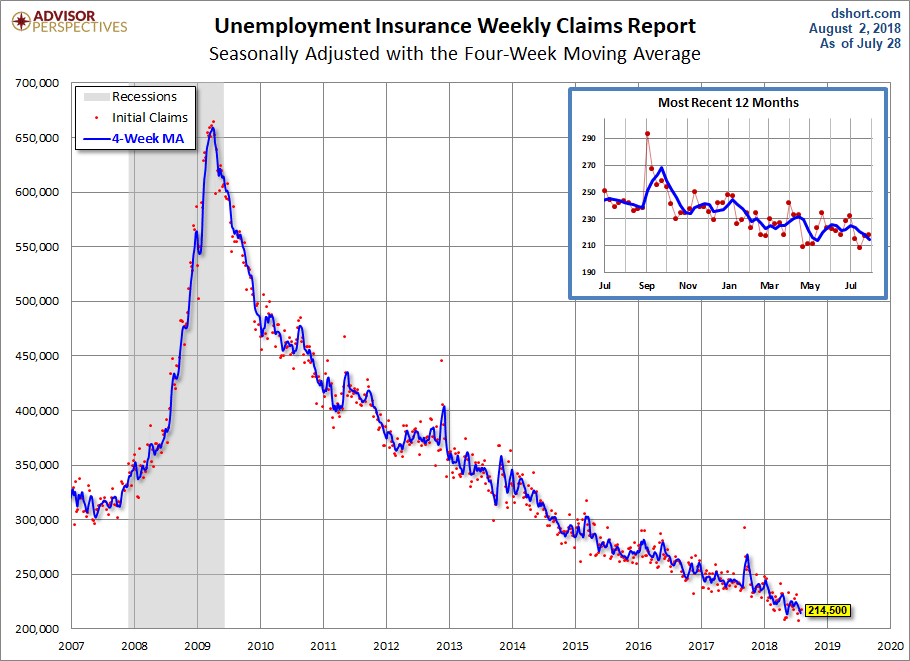
Healthy consumer spending and business investment helped propel the economy to a 4.1% rate of growth in the spring. The strong growth has led to more hiring and knocked unemployment down to its lowest level in 18 years. The number of people already collecting unemployment benefits, known as “continuing claims”, declined by 23,000 to 1.72 million. That number is almost a quarter of a million lower compared to the same time last year.
Private U.S. employers created an additional 219,000 new jobs in July, according to private payroll processor ADP. The increase in hiring was the strongest since February and blew away expectations of only a 173,000 increase. Despite widespread complaints of labor shortages, private-sector hiring remained strong.
In the details of the report, small businesses created 52,000 jobs in July, medium-sized firms added 119,000 and large corporations filled 48,000 positions. The report from ADP is often used to get an indication of the Labor Department report that comes later in the week. In this case it was spot-on.
The Labor Department reported another solid jump in hiring last month, showing that companies are still actively looking for workers to meet the needs of the rapidly expanding U.S. economy. Some 157,000 new jobs were created last month even as businesses continued to complain about the shortage of skilled labor.
White collar professional firms added 51,000 jobs last month, while manufacturers filled 37,000 jobs and health care providers added 34,000. Bars and restaurants boosted staff by 26,000. The financial industry and government were the only industries to trim employment. Banks and insurers cut 5,000 jobs, while government jobs declined by 13,000. Overall unemployment slipped to 3.9% – nearly a two-decade low.
Pending home sales, which measures the number of real-estate transactions in which a contract has been signed but hasn’t yet closed, ticked up 0.9% in June, the National Association of Realtors (NAR) reported. However, of concern is that June’s number was lower than year-ago levels for the sixth month in a row, this time by 2.5%. Economists’ had forecast a 0.8% increase for the month.
Analysts note that the housing market appears to be in a continuous state of demand overwhelming supply, which limits sales. Still, June marked the first inventory increase in three years and that most likely helped pending-home sales, said the NAR. All four regions reported increases in pending home sales for June. The Northeast jumped 1.4%, the Midwest added 0.5%, the South gained 1.1%, and the West rose 0.7%.
Home prices across the country continued to moderate last month, according to the monthly S&P/Case-Shiller report. The S&P/Case-Shiller national index rose a seasonally-adjusted 0.4% in May, up 6.4% for the year. The more narrowly focused 20-city index rose a seasonally-adjusted 0.2%, up 6.5% from the same time last year.
Overall, home prices are still climbing, running well ahead of wage gains and inflation, but the rate of growth is leveling off. In the three-month period ending in May, three cities had percent annual price increases in the double digits—Las Vegas, San Francisco, and Seattle. None of the 20 cities studied had monthly declines, though prices in New York were flat.
The Federal Reserve’s preferred inflation measure, the Personal Consumption Expenditures (PCE) price index, rose just 0.1% in June, along with the core rate which strips out the volatile food and energy sectors. Per this measure, the rate of inflation remained 2.2% last month, matching its six-year high. After a series of steady increases, inflation appears to have crested—at least for now.
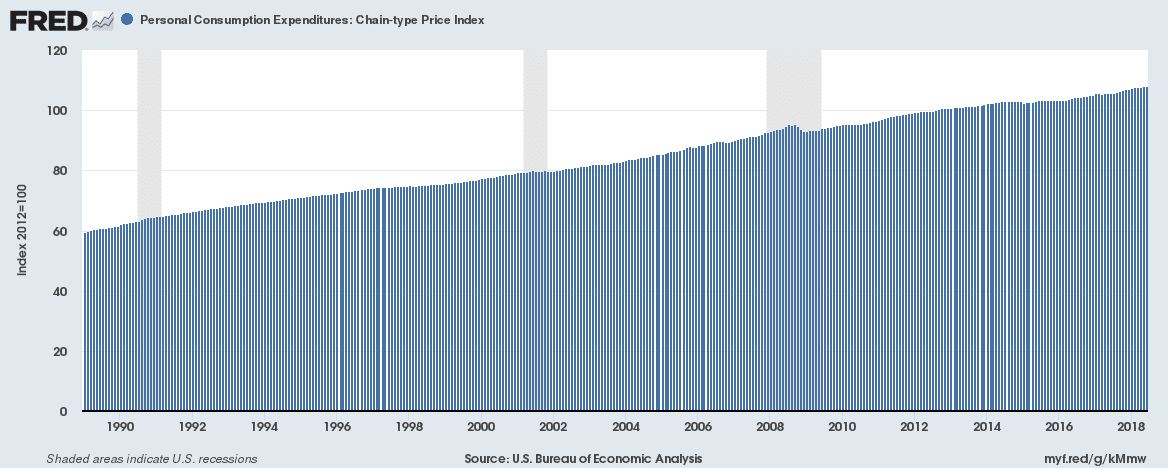
The yearly core rate also remained unchanged at 1.9%. Chris Low, Chief Economist at FTN Financial stated, “Both wages and inflation were tame in the second quarter after popping higher. Consumers find themselves in much better shape than previously reported with more income…and a much higher saving rate than you’d expect to see this far into a business cycle expansion.”
Analysts say that the Federal Reserve has signaled another rate hike may be coming soon, as the word “strong” appeared throughout its latest statement. This week, the Federal Reserve upgraded its assessment of the economy but voted unanimously to hold its benchmark federal-funds rate in the range of 1.75% and 2%.
In its Federal Open Market Committee (FOMC) statement, the Fed noted that job gains and economic activity has been “strong”. The Fed wrote, “The FOMC expects that further gradual increases in the target range for the federal funds rate will be consistent with sustained expansion of economic activity, strong labor market conditions, and inflation near the committee’s symmetric 2% objective over the medium term.”
Analysts note that the language suggests another tightening in September. Since the Fed’s last meeting, the government reported the economy grew at a solid 4.1% annual rate in the second quarter.
Confidence among the nation’s consumers rose in July to 127.4, up 0.3 point from the prior month, according to The Conference Board. July’s reading sits just below the recent peak of 130 and is one of the highest readings in 18 years.
In the details, the Present Situation Index, which measures how people feel the economy is doing right now, rose to 165.9 from 161.7. However, their views of the future slipped. The Expectations Index that looks six months into the future retreated 2.3 points to 101.7.
Lynn Franco, director of economic indicators at the board made note of the weakness, writing “while expectations continue to reflect optimism in the short-term economic outlook, back-to-back declines suggest consumers do not foresee growth accelerating.”
The U.S. trade deficit rose in June, marking its first increase in four months as the U.S. remains on track to post its largest annual trade gap in a decade despite U.S. President Donald Trump’s escalating tariffs. The deficit rose 7% to $46.3 billion in May, the Commerce Department reported; economists had forecast a slightly larger $46.6 billion gap. So far this year, the trade deficit adds up to $291 billion, compared to $272 billion in the first half of 2017. U.S. exports dropped 0.6% to $213.8 billion a month after hitting a record high.
The biggest drop was in new cars and trucks, with exports of drugs, jewelry, and passenger planes also declining. Soybean exports surged again following a similar spike in May as buyers sought to stock up before tariffs took effect. Soybean shipments were nearly 50% higher in the first six months of the year compared to the same time in 2017. Pantheon Macroeconomics Chief U.S. economist Ian Shepherdson notes, “Exports will rise over the quarter, but strong domestic demand growth will lift imports more rapidly.”
International Economic News
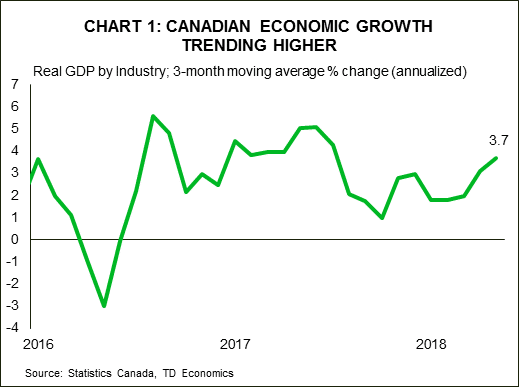
Despite escalating trade tensions with the United States, Canada’s economy is actually gaining strength instead of weakening. As U.S. President Donald Trump hit Canada with tariffs on steel and aluminum, exports rose to a record high in June and Canada’s gross domestic product expanded at its fastest clip in a year, according to data released by Statistics Canada.
The unexpected strength has economists now anticipating second-quarter growth of more than 3% and talk of a second interest rate increase from the Bank of Canada. Royce Mendes, a senior economist at Canadian Imperial Bank of Commerce wrote in a note, “The Bank of Canada is on course to raise rates in the coming months, and while our call remains for a hike in October, a September move isn’t out of the question.”
The Bank of England raised its benchmark interest rate for the second time in a decade to its highest level since 2009. The rate hike highlights how concern over rising inflation remains a bigger worry for central banks than a brewing global trade war.
The move was the latest step by a major central bank to roll back the monetary stimulus that has been supporting the world economy since the financial crisis triggered a world recession in 2009. Bank of England officials voted unanimously to raise the central bank’s policy rate from 0.5% to 0.75% – its second rate increase in less than a year.
French President Emmanuel Macron and British Prime Minister Theresa May met in France for “informal” talks regarding Britain’s exit from the European Union, known as “Brexit”. Observers state that the event was an attempt by May to enlist Macron’s support to soften EU resistance to her Brexit plan.
However, despite whatever May’s expectations were, Macron made it clear before the meeting that he would do nothing to undermine the efforts of the EU’s designated negotiator Michel Barnier. France is seen as having taken a particularly hard line in negotiations, especially in regards to financial services (Paris is expecting to gain thousands of new banking jobs as financial operations move out of London).
The public debt in Germany has dropped below 2 trillion euro for the first time in years as Germany’s robust economic growth continues. Public debt in Germany fell to 1.967 trillion euro in 2017, a drop of 2.1% compared with 2016 according to the latest figures from German statistics office Destatis.
The drop is a result of high tax receipts from the booming economy and historically low interest rates. Reductions in public debt were seen at all levels of government from local all the way up to federal administration. Saxony was the state with the most prudent monetary policy, cutting its debt by a whopping 16%.
Italy’s statistics office Istat said Italian economic growth is likely to weaken in the coming months as its latest composite leading indicator “continues to decline”. Gross domestic product rose just 0.2% in the second quarter, following a 0.3% rise in the first. The 0.2% increase was the slowest reading since the third quarter of 2016. Economy Minister Giovanni Tria said last month its 1.5% full-year forecast for 2018 will probably have to be revised downward due to slowing exports and industrial output.
China pledged to keep its economy stable despite “challenges”, the state-run news agency Xinhua reported. The announcement from Beijing came as recent data suggests that the country is beginning to feel the weight of U.S. tariffs.
In a statement carried by China’s state media after a meeting of the Politburo, a top decision-making body of the ruling Communist Party, Beijing said it will take targeted measures to solve issues in the economy.
Macquarie economists Larry Hu and Irene Wu wrote in a note, “China’s top policy makers are clearly concerned about two issues: the sharp slowdown of credit growth and the uncertainty due to the trade war. As such, they called for more proactive fiscal policy and infrastructure spending.”
Japan’s ageing society will require artificial intelligence and robots to make up for the decline in the labor force and its effect on economic growth, a recent Japanese government report wrote. The white paper noted that the world’s third-largest economy is currently on firm footing with “corporate profits at record highs, labor and income conditions improving, and increased income leading to an expansion in consumption and investment.”
However, the report also warned that the country is experiencing its worst labor shortage in a quarter century, and some industries such as transportation services and construction are already seeing earnings suffer as a result. Although Japan is already a leader in industrial robotics, it is surprising that only about 20% of Japanese companies currently make use of them, compared with more than 40% in the U.S. The report was presented to the Japanese Cabinet by Toshimitsu Motegi, Minister of Economic and Fiscal Policy.
Interesting “Tidbit” of the Week
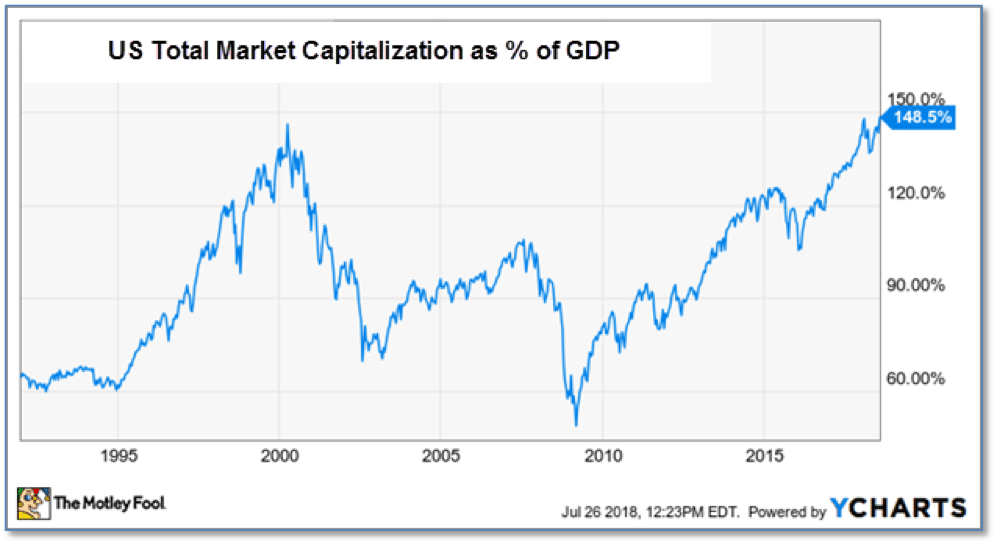
Legendary investor Warren Buffett’s favorite metric of stock valuations is currently suggesting that a stock market setback could be coming.
While anything from Buffett brings up memories of the television commercials from the 1970’s that with the tag line “When E.F. Hutton talks, people listen”, Buffett’s favorite indicator is both historically effective and remarkably simple to calculate.
The indicator is simply the ratio of the total market capitalization of all U.S. stocks divided by the latest Gross Domestic Product (GDP) reading. Of concern is that the current value of this ratio has never been higher.
While no indicator is correct 100% of the time, the Buffett indicator is remarkably accurate.
As a general rule, if the indicator falls below 80-90%, it has historically signaled that stocks are cheap. Likewise, levels significantly higher than 100% can indicate stocks are too expensive.
For example, the Buffett indicator peaked at 145% right before the dot.com bubble burst, and reached 110% before the financial crisis. Where does it stand now? 149%. (Chart from motleyfool.com)
Institutional Sentiment
The ranking relationship between the defensive SHUT sectors is one way to gauge institutional investor sentiment in the market.
“S”=Staples [a.k.a. consumer non-cyclical]
“H”=Healthcare
“U”=Utilities and
“T”=Telecom
and the offensive DIME sectors:
“D”=Discretionary [a.k.a. Consumer Cyclical]
“I”=Industrial,
“M”=Materials
“E”=Energy
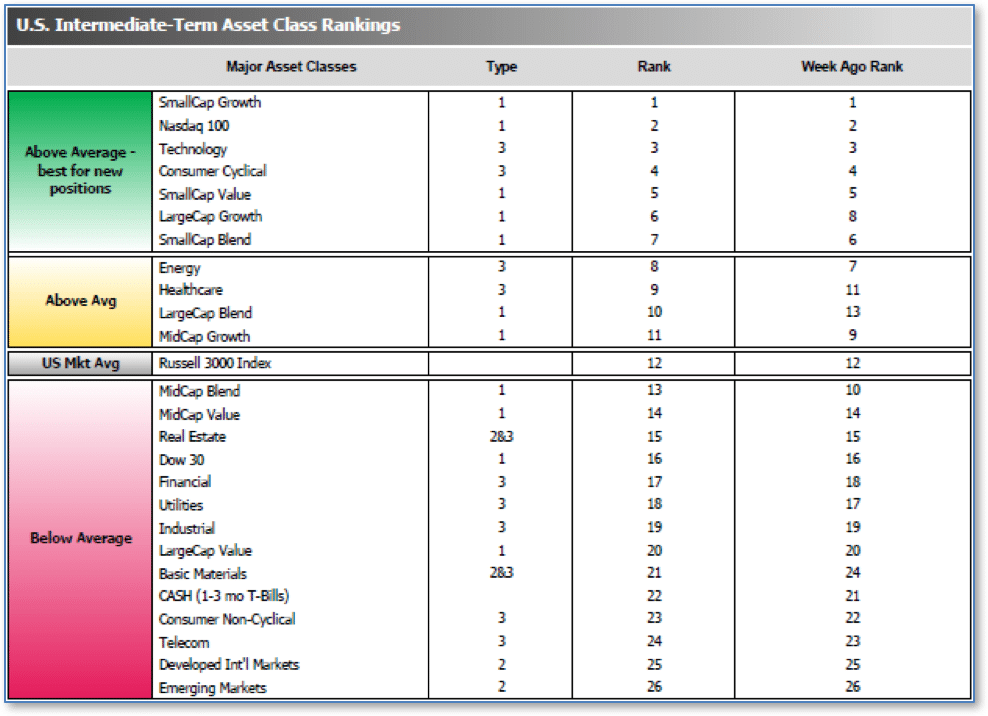
The average ranking of Defensive SHUT sectors fell to 18.50 from the prior week’s 18.25, while the average ranking of Offensive DIME sectors rose to 13.00 from the prior week’s 13.50. The lead of the Offensive DIME sectors over the Defensive SHUT sectors expanded a bit.
Note: these are “ranks”, not “scores”, so smaller numbers are higher ranks and larger numbers are lower ranks.
___________________
(sources: all index return data from Yahoo Finance; Reuters, Barron’s, Wall St Journal, Bloomberg.com, ft.com, guggenheimpartners.com, ritholtz.com, markit.com, financialpost.com, Eurostat, Statistics Canada, Yahoo! Finance, stocksandnews.com, marketwatch.com, wantchinatimes.com, BBC, 361capital.com, pensionpartners.com, cnbc.com, FactSet)
© 2018 Riverbend Investment Management, LLC. This presentation is intended for informational purposes only.
The information and statistical data contained herein have been obtained from sources we believe to be reliable but in no way are warranted by us as to accuracy or completeness. The opinions expressed are those of Riverbend Investment Management, LLC. and are subject to change without notice. No part of this presentation may be reproduced in any manner without the written permission of Riverbend Investment Management, LLC. Any securities discussed should not be construed as a recommendation to buy or sell and there is no guarantee that these securities will be held for a client’s account nor should it be assumed that they were or will be profitable. Past performance does not guarantee future comparable results.
Riverbend Investment Management, LLC is a Registered Investment Adviser


