Market Recap and Observations
U.S. Markets
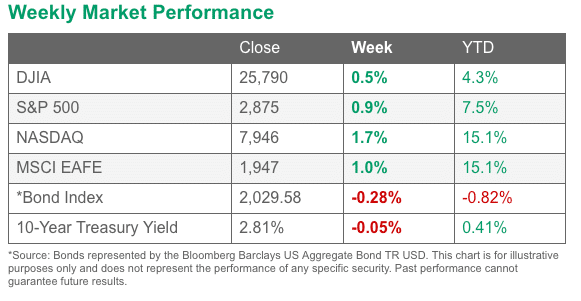
U.S. stocks posted gains for the week, led higher by technology and energy shares. The Dow Jones Industrial Average advanced 121 points to 25,790, a gain of 0.5%.
The technology-heavy NASDAQ Composite added 130 points or 1.7% to close at 7,945. By market cap, smaller cap indexes outperformed large caps. The large cap S&P 500 added 0.9% while the mid cap S&P 400 and small cap Russell 2000 added 1.2% and 1.9% respectively.
As of 8/24/18 Market Close. Source FMeX
International Markets
Canada’s TSX and the United Kingdom’s FTSE were the laggards among major international markets, rising 0.2% and 0.3% respectively. On Europe’s mainland all larger markets finished the week in the green with France’s CAC 40 up 1.6%, Germany’s DAX up 1.5%, and Italy’s Milan FTSE up 1.6%.
Asian markets were similarly higher – China’s Shanghai Composite added 2.3%, while Japan’s Nikkei added 1.5% and Hong Kong’s Hang Seng added 1.7%. As grouped by Morgan Stanley Capital International, emerging markets added 2.8% and developed markets were up 1.4%.
Commodities
Precious metals recovered much of last week’s plunge as Gold added 2.5% or $29.10 to end the week at $1213.30 per ounce, and Silver added 1.1% to end the week at $14.79 per ounce.
 Crude oil surged 5.4% to close at $68.72 per barrel of West Texas Intermediate. The industrial metal copper – sometimes referred to as “Dr. Copper” for its ability to forecast global economic growth – rebounded 2.7% after 3 weeks of negative returns.
U.S. Economic News
The labor market remains very tight as new claims for unemployment benefits fell by 2,000 to 210,000 nearly matching its lowest level since December of 1969. Economists had expected a rise to 215,000 claims.
The current decline in new claims is the third lowest reading during the current nine-year-old economic expansion, just 2,000 above the post-recession low set in July.
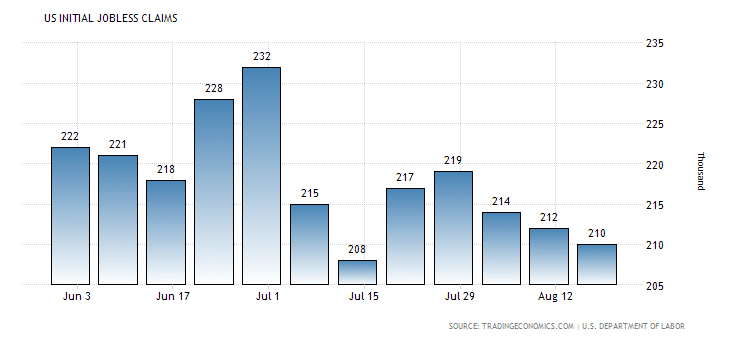
The four week average of claims, smoothed to iron out the weekly volatility, fell by 1,750 to 213,750, also near its lowest level since 1969. The number of people already collecting unemployment benefits, known as continuing claims, remained barely changed at 1.73 million.
The number of existing homes sold in July fell for a fourth consecutive month as a shortage of properties on the market and rising mortgage rates are thought to have sidelined some potential buyers.
The National Association of Realtors (NAR) reported existing home sales fell 0.7% to a seasonally-adjusted annual rate of 5.34 million units, widely missing economists’ forecast of a 0.6% gain to 5.40 million units. July’s drop marks the longest streak of sales declines since 2013. By region, sales fell across the Northeast, South, and Midwest, but were up in the West.
There were 1.92 million homes on the market in July, unchanged from a year earlier. It was the first month in three years in which inventory did not fall on a year-on-year basis, said Lawrence Yun, the NAR’s chief economist.
July’s drop marks the longest streak of sales declines since 2013., the third decline in the past four months. The Commerce Department reported new home sales ran at a 627,000 annualized rate, the lowest level in nine months.
The reading widely missed economists’ forecasts for a gain of 2.2%. On a positive note, sales were 12.8% higher than at the same time last year, and the median home price remained at a lofty $328,700. Despite their recent weakness, new home sales have not broken below their long-term upward trend line, which suggests that the market is still holding up. 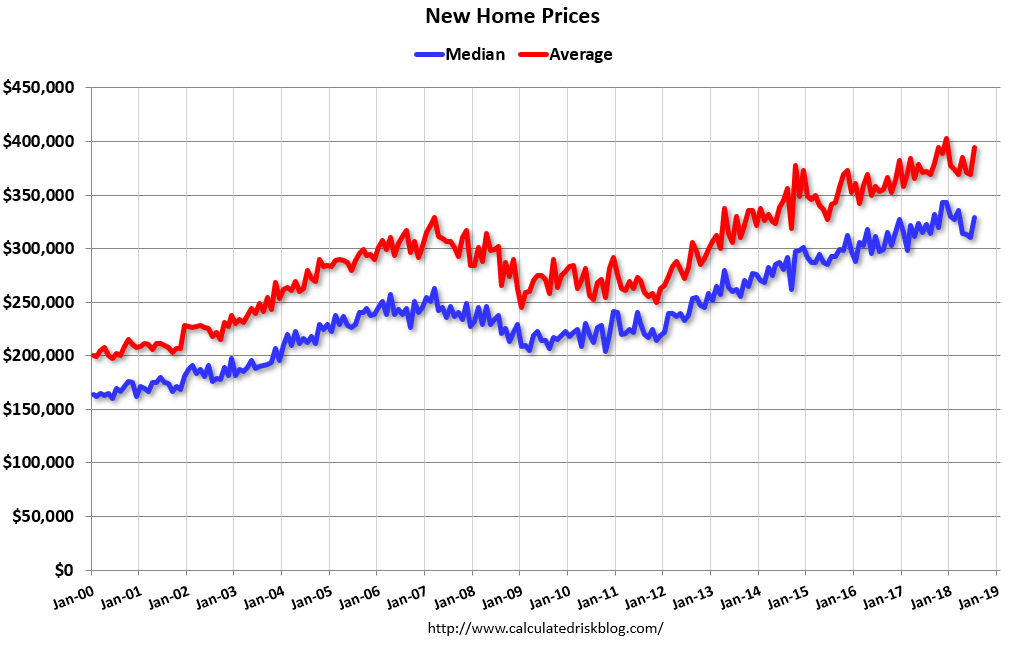
The new home sales decline in July was led by a 52.3% plunge in the Northeast, which more than reversed its double-digit gain the previous month. At the current sales pace, available supply rose to 5.9 months of inventory—close to the 6 month supply consistent with a balanced housing market.
A big drop in new contracts for passenger jets caused orders for durable goods to fall 1.7% last month, its third decline in the past four months and the most since the beginning of the year. Economists had forecast a 1.1% decline.
In the report, the decline was led by weaker aircraft orders in the often-volatile transportation group. Excluding transportation, orders were actually up 0.2% – a sixth straight monthly gain for the ex-transportation grouping. Nondefense capital goods orders ex-aircraft, or core business orders, rose 1.4%, the fourth gain in a row.
They are up a healthy 7.2% in the first seven months of 2018, compared with the same period a year ago. U.S. economist Andrew Hunter of Capital Economics stated, “Despite the decline in headline orders, the July durable goods data suggest that business equipment investment growth is set to rebound in the third quarter. That provides further reason to think that overall GDP has continued to expand at a healthy 3.0% to 3.5% annualized pace.”
An index that tracks U.S. manufacturers and service-oriented companies showed slower growth this month, suggesting that economic growth may be tapering from its three-year peak this spring. Research firm IHS Markit’s flash Purchasing Managers Index (PMI) manufacturing sub-index fell to a nine-month low of 54.5 from 55.3, while its services sub-index hit a four-month low of 55.2, down 0.8 point.
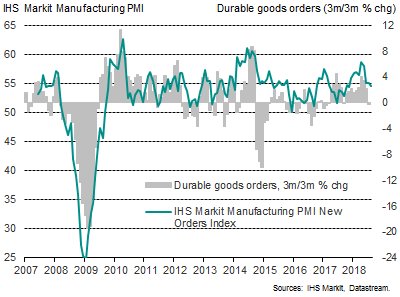
Despite the dual declines, readings over 50 signify expansion and results over 55 are considered exceptional, so analysts see no cause for concern. Companies continue to report shortages of skilled labor and depending on the industry shortages of key raw materials due to tariffs that have triggered “panic buying”. Transportation has also become an issue due to a shortage of truck drivers.
Minutes of the Federal Reserve’s meeting earlier this month signaled broad support for another interest-rate hike in September if the data continued to support their outlook. The minutes said, “It would likely soon be appropriate to take another step in removing policy accommodation.” However, officials cautioned that it may have to pause its gradual rate hike path if international trade tensions continued to escalate.
Fed officials were unanimous in their view that trade disagreements represented a downside risk to the economy. Fed officials also agreed they would “fairly soon” need to scrap the language describing their policy stance as “accommodative” because the level of rates is getting closer to neutral.
International Economic News
Bank of Canada Governor Stephen Poloz stated he still sees rate hikes ahead for Canada, but it is dependent on future economic data and the outcome of NAFTA talks with the United States. The Bank of Canada raised its benchmark interest rate in July, a month after the U.S. Federal Reserve raised U.S. interest rates.
A rate increase in the U.S. generally puts pressure on the Bank of Canada to follow as a stronger dollar puts pressure on the Canadian Loonie. Poloz noted that he’s wary of the factors in Canada that make it so he can’t move in tandem with the U.S. such as higher levels of debt and Canada’s heavier reliance on trade. The uncertainty over NAFTA and U.S. President Trump’s repeated threats to cancel the deal have already had a negative impact on investment in Canada, he said.
The European press has shown very little sympathy for the ‘no-deal’ Brexit guidance published by UK Brexit Secretary Dominic Raab. The German press provided the most coverage of Raab’s publication with most papers summarizing Raab’s writings as “too little, too late”.
The prevailing feeling on the European continent is that “it is the Brits’ own damn fault” for the current chaos and uncertainty. Journalist Stephanie Bolzen said in a column for the German conservative daily Die Welt that “this attitude is arrogant” and “detrimental”. If a no-deal Brexit leads to the end of the free market this will create “shock waves well beyond Europe”, she wrote.
Business morale in France fell to its lowest level since Emmanuel Macron became the President in May 2017, French statistics agency INSEE reported. Sentiment soared following Macron’s election promising investor-friendly reforms and a return to fiscal discipline, but has soured since then. The composite business morale index dropped to 105 in August, down almost 6 points from its multi-year high last year.
INSEE gave no reason for August’s decline, though respondents in recent business surveys have cited uncertain trade prospects and rising energy prices as negatives. On a positive note, the latest reading still remains above the long-term average of 100.
Strong domestic demand drove Germany’s economic expansion in the months leading up to summer as second quarter gross domestic product rose 0.5%, matching estimates. Overall economic growth was supported by a 0.5% increase in capital investment, mostly due to construction. Net trade, however, weighed as imports rose 1.7% but exports were up just 0.7%.
The country’s solid performance in the second quarter helped alleviate concerns that slowdown in the first quarter would persist. Nonetheless, several large corporations in Germany expressed concern over the outlook, with growth in China slowing and emerging markets experiencing a slowdown. The Bundesbank stated German expansion is likely to cool this quarter, though the economy remains on a “sound growth path”.
Analysts note that China’s economy is slowing down, but they debate about how much trouble it is really in. The recent weakness appears at least partly due to a budding trade war with the United States, in which each country has imposed tariffs of $50 billion on each other’s goods and each are threatening far more. While China’s economy expanded 6.9% in 2017 according to government figures, official data showed a slowdown in investment, factory production and retail sales in July.
Chang Liu, China economist at Capital Economics wrote in a note to clients, “The US-China trade conflict will be a drag on activity, though probably a small one. Instead, we expect the economy to weaken mainly due to domestic headwinds caused by slower credit growth.” Some experts feel that the slowdown fears are overblown. Doug Morton, head of Asia research at Northern Trust Capital Markets, pointed out that some indicators like demand for oil and the property markets are still strong. “Headlines on growth concerns may prove to be somewhat exaggerated,” he wrote in a note to clients this week.
Japanese trade minister Hiroshige Seko stated U.S. President Donald Trump’s tariff policies reflect a serious misunderstanding of the importance of free trade and of Japanese contributions to the U.S. economy. Seko told the Associated Press, “Japanese automakers are a major contributor to the American economy.
If the Japanese auto industry is weakened, it will not be able to further invest in the U.S.” Seko also expressed worries about the escalating trade dispute between the U.S. and China and said such moves threaten the entire global economy. Seko said he empathized with Trump’s “feelings” of worry over the ballooning U.S. trade deficit but pointed out that the annual U.S. trade deficit with Japan totaled just $68 billion last year, compared to the U.S. deficit with China which was nearly $376 billion.
Interesting “Tidbit” of the Week
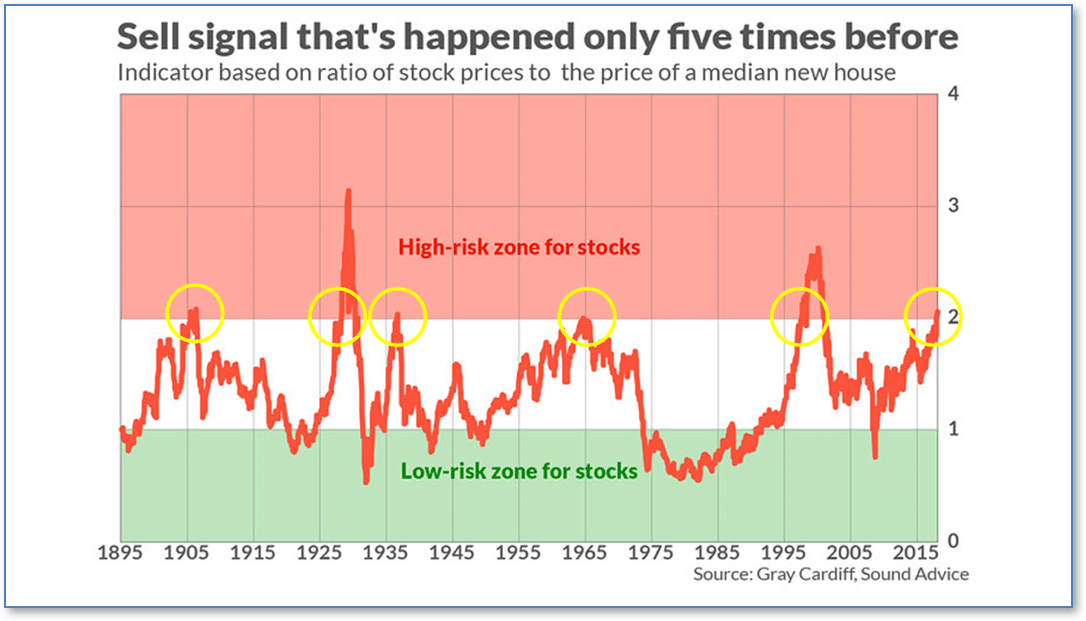
As the bull market continues through its ninth year, a little-known stock market indicator with a “5 for 5” record since 1895 has just generated a sell signal.
The indicator is the creation of Gray Cardiff, editor of the Sound Advice newsletter. He calls it the “Sound Advice Risk Indicator”, which is simply the ratio of the S&P 500 to the median price of a new home.
Cardiff explains that the indicator quantifies the “struggle for capital” between stocks and real estate. When the indicator rises above 2.0, he explains, it means the stock market has absorbed a “larger proportion of available investment capital than economic conditions can justify.”
The last time the indicator flashed a sell signal was in 1998—conveniently before the dot.com implosion that followed.
Note, however, that this indicator did NOT give a sell signal in 2007, since it was Real Estate that had proportionately too much investment then!
Institutional Sentiment
The ranking relationship between the defensive SHUT sectors is one way to gauge institutional investor sentiment in the market.
“S”=Staples [a.k.a. consumer non-cyclical]
“H”=Healthcare
“U”=Utilities and
“T”=Telecom
and the offensive DIME sectors:
“D”=Discretionary [a.k.a. Consumer Cyclical]
“I”=Industrial,
“M”=Materials
“E”=Energy
The average ranking of Defensive SHUT sectors rose to 15.75 from last week’s 16.50, while the average ranking of Offensive DIME sectors rose slightly to 17.00 from last week’s 17.25.
The Offensive DIME sectors trail the Defensive SHUT sectors by a modest amount. 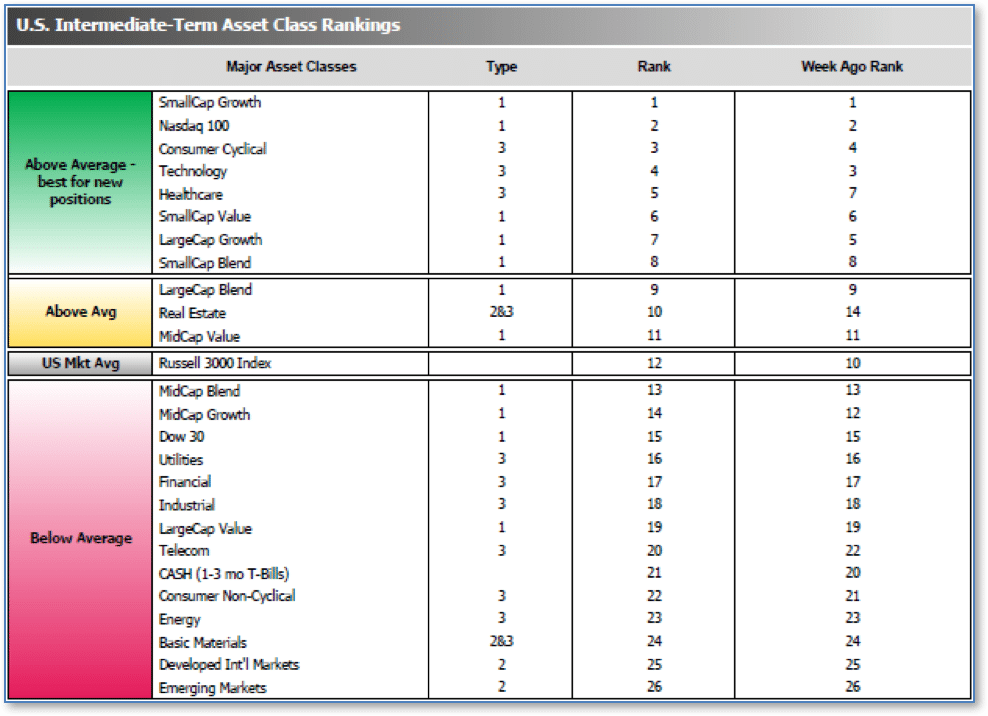
Note: these are “ranks”, not “scores”, so smaller numbers are higher ranks and larger numbers are lower ranks.
___________________
(sources: all index return data from Yahoo Finance; Reuters, Barron’s, Wall St Journal, Bloomberg.com, ft.com, guggenheimpartners.com, ritholtz.com, markit.com, financialpost.com, Eurostat, Statistics Canada, Yahoo! Finance, stocksandnews.com, marketwatch.com, wantchinatimes.com, BBC, 361capital.com, pensionpartners.com, cnbc.com, FactSet)
© 2018 Riverbend Investment Management, LLC. This presentation is intended for informational purposes only.
The information and statistical data contained herein have been obtained from sources we believe to be reliable but in no way are warranted by us as to accuracy or completeness. The opinions expressed are those of Riverbend Investment Management, LLC. and are subject to change without notice. No part of this presentation may be reproduced in any manner without the written permission of Riverbend Investment Management, LLC. Any securities discussed should not be construed as a recommendation to buy or sell and there is no guarantee that these securities will be held for a client’s account nor should it be assumed that they were or will be profitable. Past performance does not guarantee future comparable results.
Riverbend Investment Management, LLC is a Registered Investment Adviser


