Market Recap and Observations
U.S. Markets
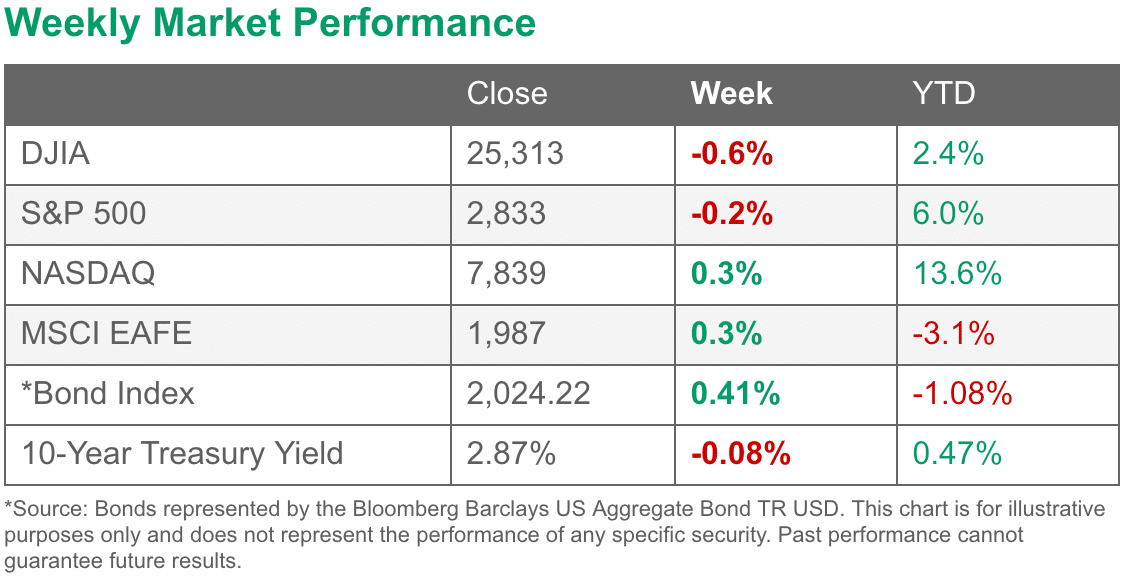
*as of 8/11/18
The major benchmarks ended the week mixed after a downturn on Friday reversed earlier gains. The technology-heavy NASDAQ Composite and smaller cap indexes ended the week modestly higher, while mid and large caps finished down. The Dow Jones Industrial Average declined 149 points or -0.6% to close at 25,313. The NASDAQ Composite added a third of a percent finishing the week at 7,839. By market cap, the large cap S&P 500 fell -0.3%, the mid cap S&P 400 retreated -0.2% and small cap Russell 2000 gained 0.8%
International Markets
Canada’s TSX reversed last week’s modest gain and closed down -0.6%. Across the Atlantic the United Kingdom managed a slight 0.1% gain while major markets were red across the board on Europe’s mainland. France’s CAC 40 retreated -1.2%, Germany’s DAX gave up -1.5%, and Italy’s Milan FTSE plunged -2.3%. In Asia, China’s Shanghai Composite rebounded 2% after losing -4.6% last week, but Japan’s Nikkei finished down a second week losing -1%. As grouped by Morgan Stanley Capital International, developed markets fell -2% along with emerging markets which declined a steeper -2.3%.
Commodities
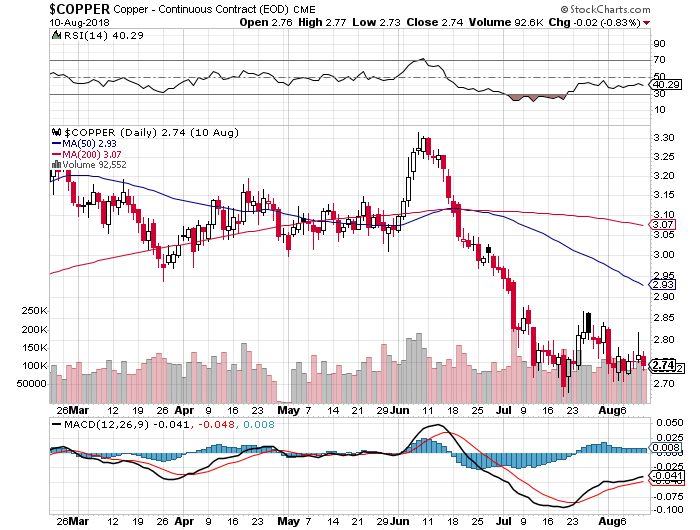
Energy finished the week down with West Texas Intermediate crude oil retreating -1.3% to end the week at $67.63 per barrel. Precious metals also finished down, with Gold falling -0.3% to $1219 an ounce, and Silver fell a steeper -1.1% to $15.29 an ounce. Copper, viewed by some analysts as a barometer of global economic health due to its variety of industrial uses, finished the week down -0.8%.
U.S. Economic News
The Labor Department reported that the number of Americans seeking new unemployment benefits unexpectedly fell last week by 6,000 to 213,000. The reading came in below economists’ estimates of 217,000 layoffs. The more stable monthly average of claims fell by 500 to 214,250. Continuing claims, which counts the number of people already receiving unemployment benefits, rose by 29,000 to 1.76 million. That number is reported with a one-week delay.
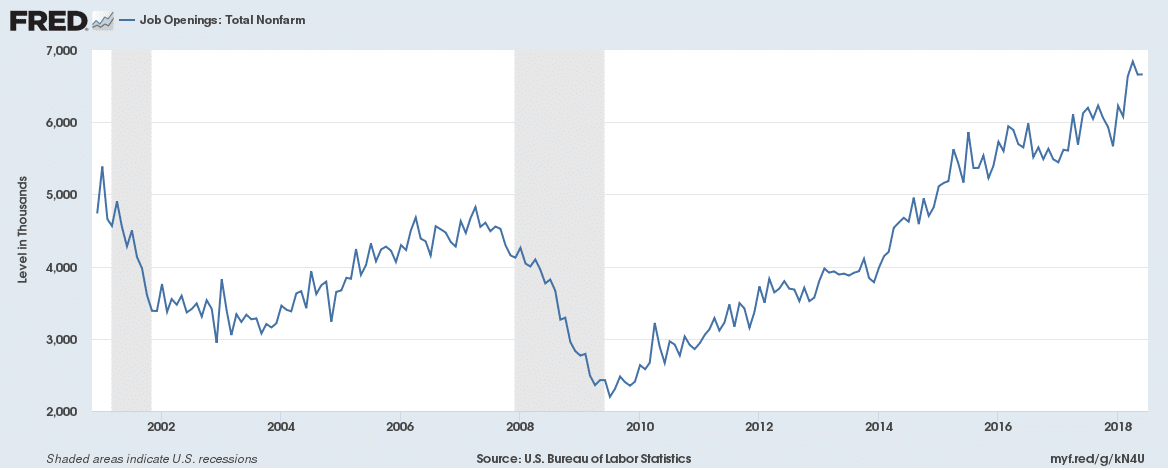
The Labor Department’s monthly JOLTS (Job Openings and Labor Turnover Survey) report showed the number of job openings in the country hit its third highest reading in history in June. There were 6.66 million job openings in the latest reading, up fractionally from May’s levels. However, perhaps more notable is that the ‘quits rate’, or the number of people who left jobs in favor of presumably better ones, remained at a solid 2.3% for the fourth month in a row.
That number is known to be closely watched by Federal Reserve officials as a more accurate assessment of the quality of the jobs market. Counterintuitively, a higher quit rate is better. In the details, openings increased in educational services but decreased in transportation, warehousing, and utilities. Overall, the jobs market is one of the strongest in decades given the high number of job openings and just a 3.9% unemployment rate.
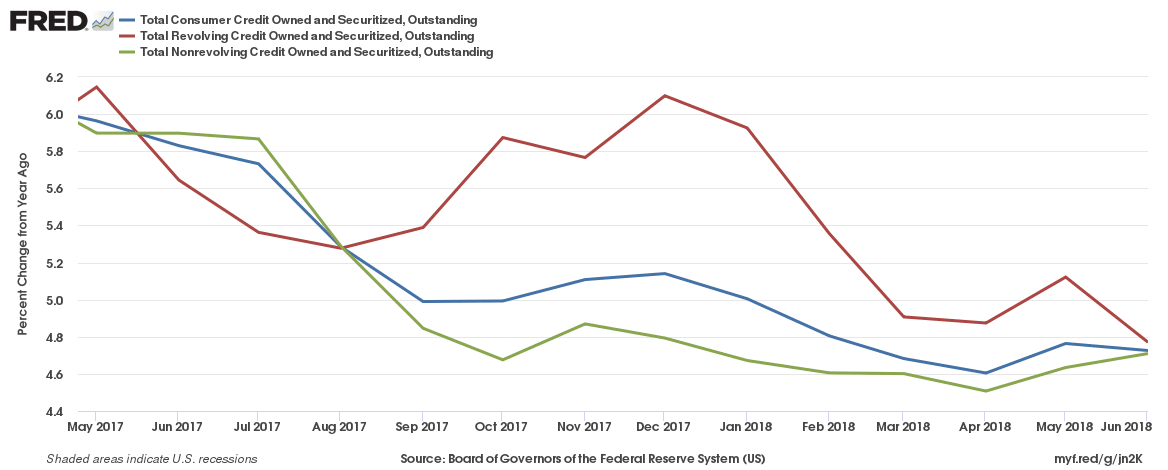
Borrowing among the nation’s consumers moderated in June after hitting a six-month high in May, the Federal Reserve reported. Total consumer credit increased by $10.2 billion to a seasonally-adjusted $3.91 trillion – an annual growth rate of 3.1%. Economists had expected a $16 billion increase. In the details, revolving credit such as credit cards declined by 0.2% after surging 11.2% in May. Credit card use has declined twice in the past four months. The Fed reported this week that banks had tightened standards on credit cards in the second quarter, which may account for some of the slowing trend. Non-revolving credit, such as auto and student loans, continued its steady rise with a 4.4% increase.
Inflation at the wholesale level remained unchanged last month according to the Labor Department. The Producer Price Index (PPI) reading was below economists’ forecast of a 0.2% gain. The flat reading for July brought the 12-month rate of wholesale inflation down 0.1% to 3.3%. The producer-price report also specifically tracks intermediate demand prices, or the cost charged for goods and services sold to businesses as inputs in production. This is an indicator of cost pressures building in the pipeline for many businesses, which can be a precursor to broader inflation. Core PPI, which strips out food, energy, and trade margins, rose 0.1% for a second consecutive month. The 12-month rate of core PPI advanced to 2.8% in July—its highest reading since March.
At the consumer level, inflation rose 0.2% in July as rising costs for shelter offset a decline in energy prices. The Consumer Price Index (CPI) is up 2.9% over the past 12 months, unchanged from June. Shelter costs rose 0.3% in July and accounted for nearly two-thirds of the increase for the CPI. Stripping out the volatile food and energy categories, the more closely watched core rate of inflation rose 0.2% last month. The gain in the core rate was driven by several categories including shelter, cars and trucks, household furnishings and recreation.
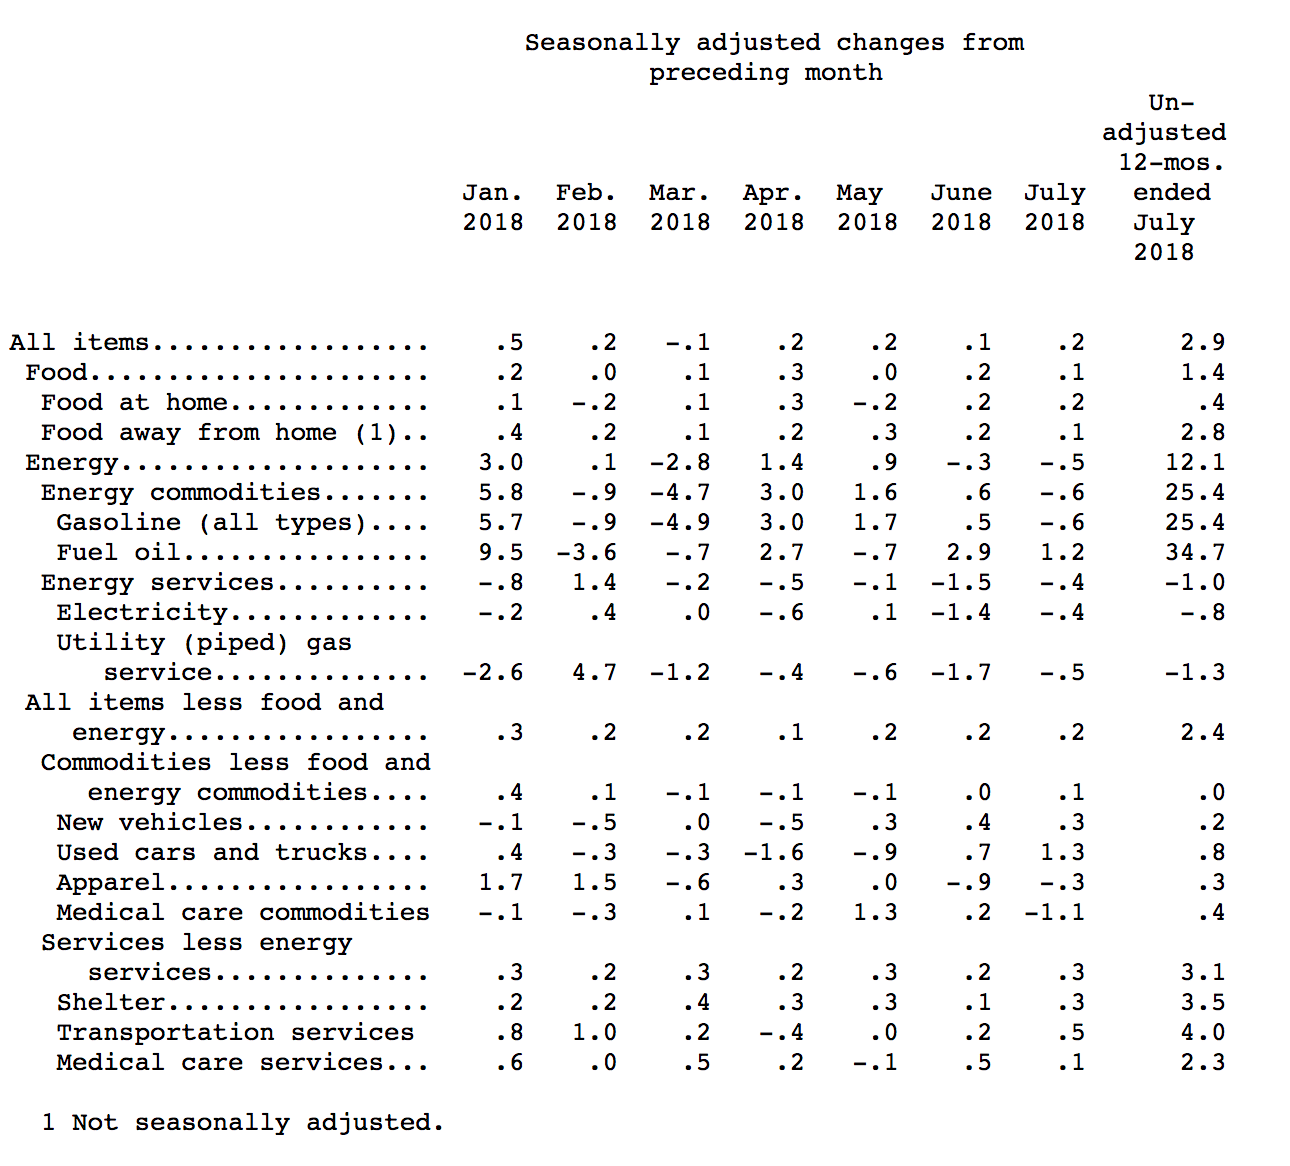
Source: Bureau of Labor Statistics
The 12‑month core rate of inflation rose to 2.4% – the highest since September of 2008. Analysts and Fed officials were quick to point out that they expected inflation pressures to moderate in the second half of the year. Chicago Fed President Charles Evans noted he thought inflation wouldn’t exceed 2% “by too much” and that a restrictive monetary policy may be needed next year or in 2020, while senior U.S. economist at Societe Generale Omair Sharif stated that headline and core inflation “will moderate by the end of the year”.
International Economic News
Canada’s Finance Minister Bill Morneau stated that Canada will not adopt retaliatory economic sanctions against Saudi Arabia in its escalating diplomatic war. Riyadh is upset that Canada publicly criticized the kingdom for not releasing jailed human rights activists. The Saudi government said Canada was meddling in its domestic affairs and it would not be tolerated. Saudi Arabia recalled its ambassador from Ottawa and ordered its Canadian ambassador to leave.
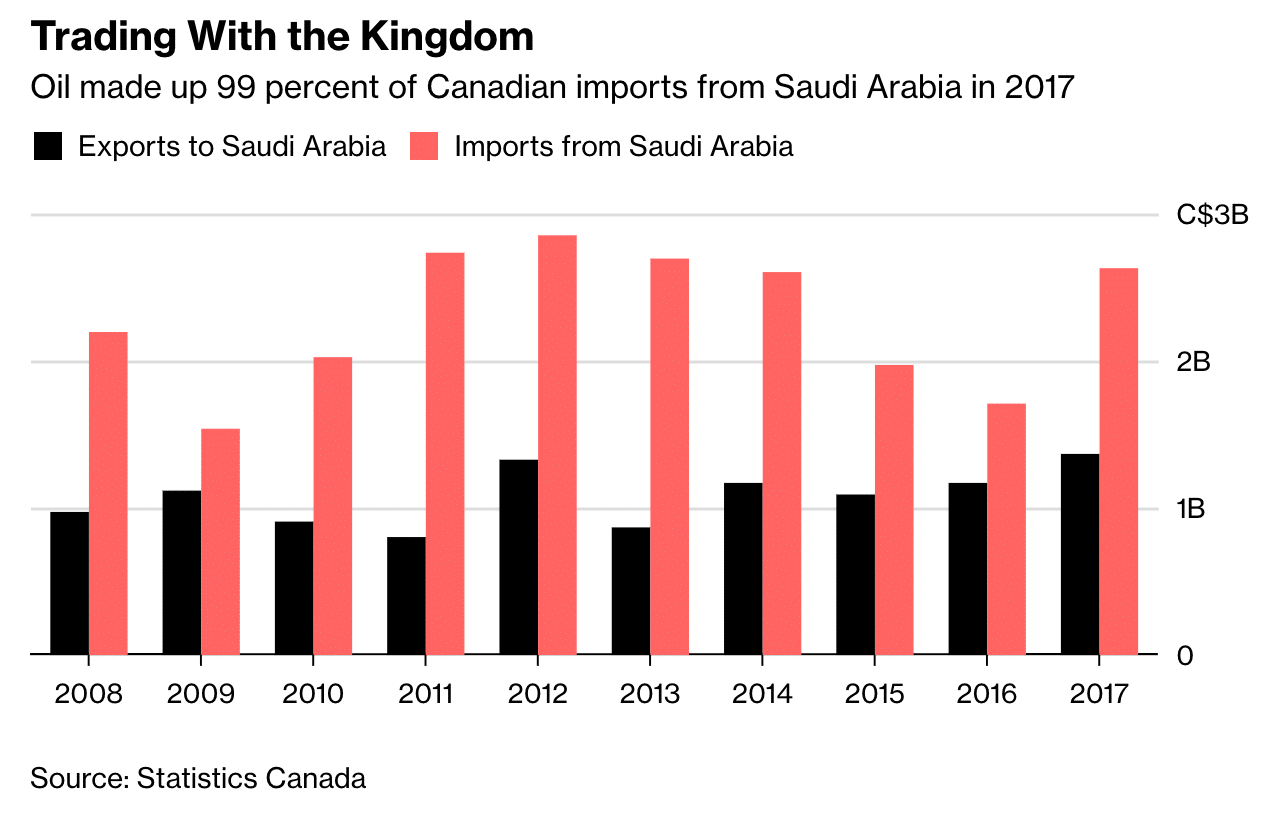
In addition, Saudi Arabia froze all new trade deals, stopped imports of wheat and barley, ordered Saudi students to leave Canadian schools and began selling off Canadian assets. The kingdom wants Canadian officials to fly to Saudi Arabia and make a public apology for meddling in the kingdom’s internal affairs, something Canadian Prime Minister Justin Trudeau said is not going to happen.
After a sluggish start to the year the United Kingdom’s economy has bounced back to register GDP growth of 0.4% in the spring and early summer. The U.K. economy expanded at an annualized rate of 1.5% in the second quarter as consumer spending rose amid good weather and the activity surrounding the World Cup.
The figures suggest that the UK’s economy is poised for another year of slow but steady growth ahead of Britain’s planned exit from the European Union in March 2019. London and Brussels have yet to agree on terms for withdrawal with just seven months to go until “Brexit day” at the end of March 2019. The Office for National Statistics preliminary estimate suggests the U.K. outpaced its neighboring Eurozone in the second quarter where growth came in at an annualized 1.4% – the slowest reading in three years.
Industrial orders in Germany fell the most in nearly 1 ½ years, suggesting that trade tensions are beginning to curtail growth in Europe’s largest economy. German companies have been caught in the middle of an escalating trade conflict between the U.S. and China.
The U.S. is Germany’s biggest export market while China is its most important trading partner. The Federal Statistics Office said on Monday that contracts for “Made in Germany” goods fell by 4.0% on the month in June after rising 2.6% the previous month.
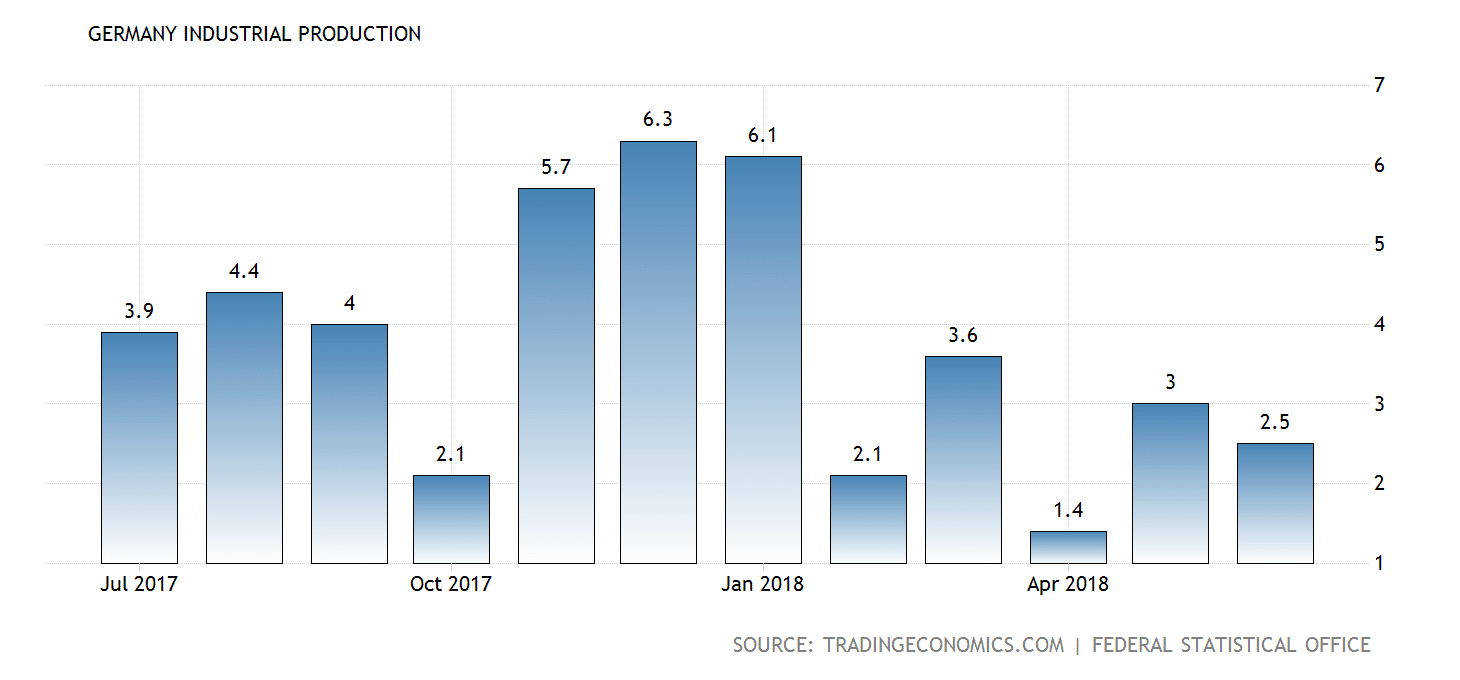
That was the biggest drop since January 2017 and markedly undershot a Reuters poll of analysts, who had predicted a 0.4% decrease. ING Bank economist Carsten Brzeski stated, “Disappointing new orders data show tentative signs of trade tensions hitting the German economy, which doesn’t bode well for the industrial outlook in the second half of the year.”
Data from the China Banking and Insurance Regulatory Commission (CBIRC) showed that new loans by Chinese banks totaled 1.45 trillion yuan ($211.8 billion) last month, a 75% increase from the same period last year. Analysts conjecture that China is opening up its lending spigots as it seeks to support its economy for what could be a long trade fight with the U.S.
The CBIRC stated it has encouraged banks and insurance companies to increase funding to meet the financing demands of the real economy. Lenders should “make full use of current liquidity” as well as “stable and declining financing costs,” the statement said. In another sign that the government is allowing credit to flow more freely, short-term interest rates between Chinese banks have sunk to three-year lows.
Japan’s Cabinet Office reported that Japan’s economy rebounded in the second quarter, returning to growth. The world’s third-largest economy expanded at an annualized pace of 1.9% in the second quarter of 2018 after a revised 0.9% contraction in the first quarter, which ended the longest stretch of growth in 28 years.
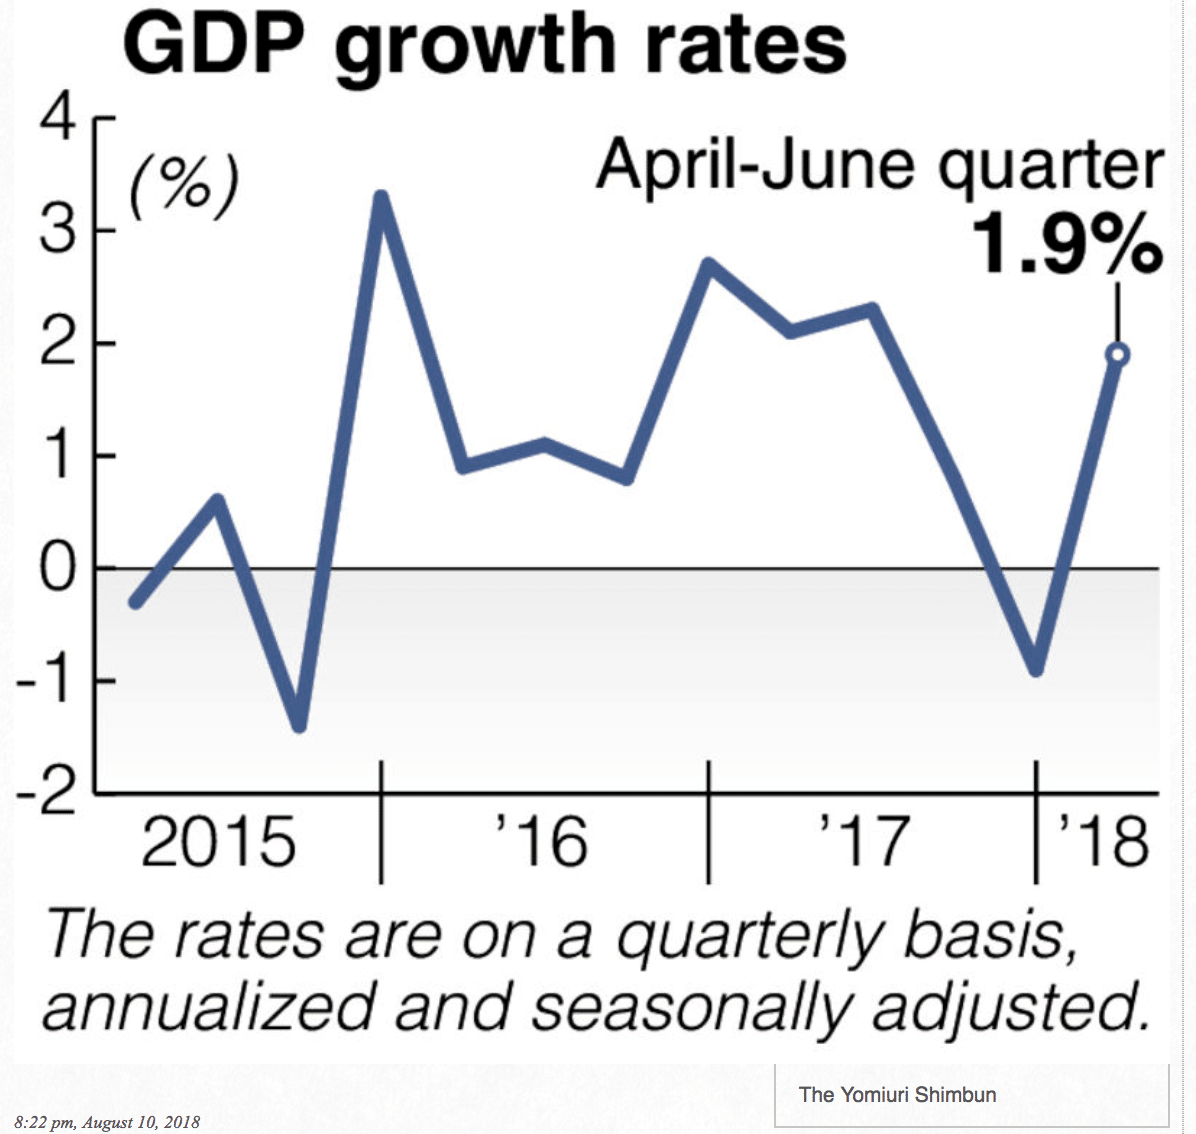
Private consumption, which accounts for nearly 60% of GDP in Japan, increased 0.7% in the second quarter. In addition, that consumption shows no signs of slowing down as nominal compensation of employees hit a record in the second quarter, rising 4.3% from a year earlier. Société Générale economist Takuji Aida stated, “A firm uptrend in wages—as summer bonuses increase significantly on the back of solid corporate earnings—is expected to support consumer spending.”
Interesting “Tidbit” of the Week
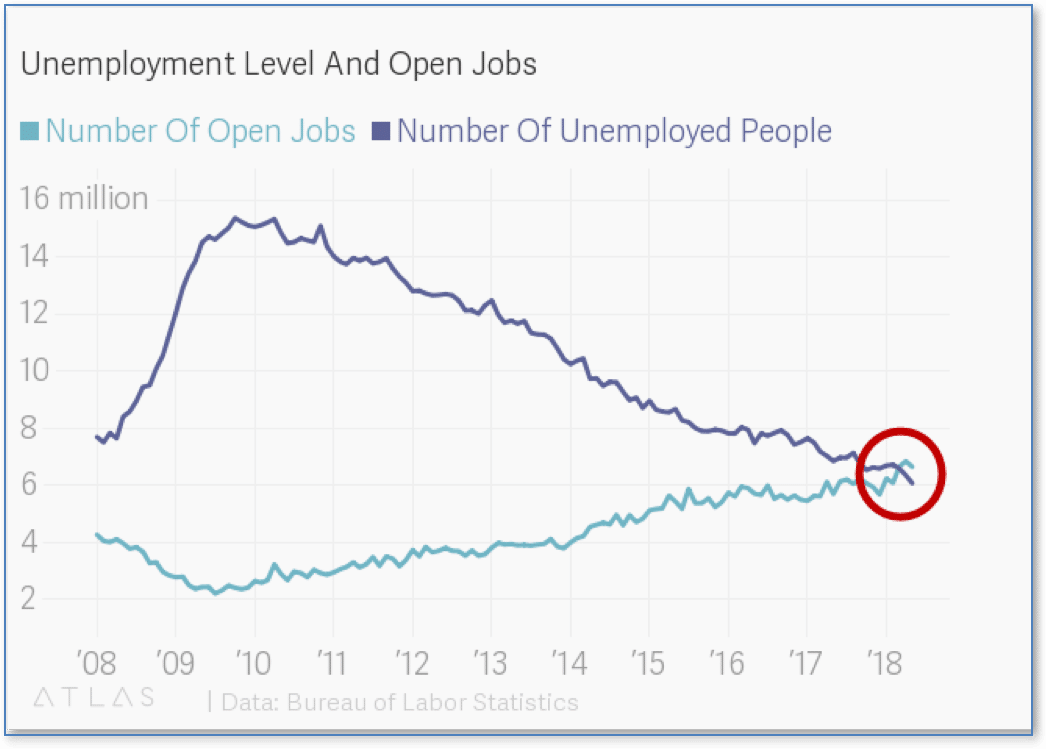
Touting the success of the Trump administration and Republican leadership, Rep. Lou Barletta (R-Pa) said in a recent campaign stop that “there are now more job openings than there are unemployed people in the United States.” Many in the media cried foul at that assertion, labeling it typical Trumpian hyperbole, but it turns out to be true.
According to the Labor Department’s JOLTS (Job Openings and Labor Turnover Survey) report, since March there have indeed been fewer unemployed Americans than available jobs. This has not happened since the Labor Department began tracking job openings 18 years ago, in 2000.
It is indisputably a significant milestone, and one wonders why it hasn’t been promoted more loudly and widely. Could it be that Democrats don’t want to acknowledge Trump’s economic successes…and that Republicans don’t want to acknowledge that maybe just maybe we could use some immigrants to help ease the acute labor shortage?
The chart below was published on theatlas.com:
Institutional Sentiment
The ranking relationship between the defensive SHUT sectors is one way to gauge institutional investor sentiment in the market.
“S”=Staples [a.k.a. consumer non-cyclical]
“H”=Healthcare
“U”=Utilities and
“T”=Telecom
and the offensive DIME sectors:
“D”=Discretionary [a.k.a. Consumer Cyclical]
“I”=Industrial,
“M”=Materials
“E”=Energy
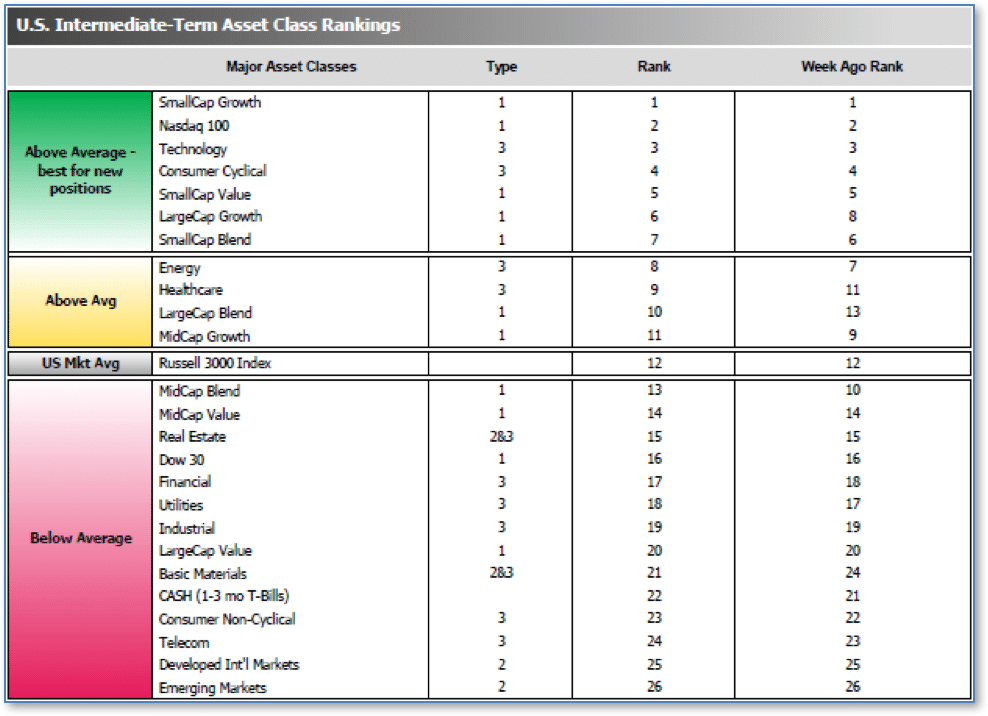
The average ranking of Defensive SHUT sectors fell to 18.50 from the prior week’s 18.25, while the average ranking of Offensive DIME sectors rose to 13.00 from the prior week’s 13.50. The lead of the Offensive DIME sectors over the Defensive SHUT sectors expanded a bit.
Note: these are “ranks”, not “scores”, so smaller numbers are higher ranks and larger numbers are lower ranks.
___________________
(sources: all index return data from Yahoo Finance; Reuters, Barron’s, Wall St Journal, Bloomberg.com, ft.com, guggenheimpartners.com, ritholtz.com, markit.com, financialpost.com, Eurostat, Statistics Canada, Yahoo! Finance, stocksandnews.com, marketwatch.com, wantchinatimes.com, BBC, 361capital.com, pensionpartners.com, cnbc.com, FactSet)
© 2018 Riverbend Investment Management, LLC. This presentation is intended for informational purposes only.
The information and statistical data contained herein have been obtained from sources we believe to be reliable but in no way are warranted by us as to accuracy or completeness. The opinions expressed are those of Riverbend Investment Management, LLC. and are subject to change without notice. No part of this presentation may be reproduced in any manner without the written permission of Riverbend Investment Management, LLC. Any securities discussed should not be construed as a recommendation to buy or sell and there is no guarantee that these securities will be held for a client’s account nor should it be assumed that they were or will be profitable. Past performance does not guarantee future comparable results.
Riverbend Investment Management, LLC is a Registered Investment Adviser


