Last week the Federal Reserve raised rates again. This time they raised by .75%. Up until about two weeks ago, the market expected the Fed to raise rates by 1/2% for the foreseeable future.
However, recent inflation data has been higher than expected and the Fed has become more aggressive. The markets have been declining over the past two weeks as investors adjusted to the change.
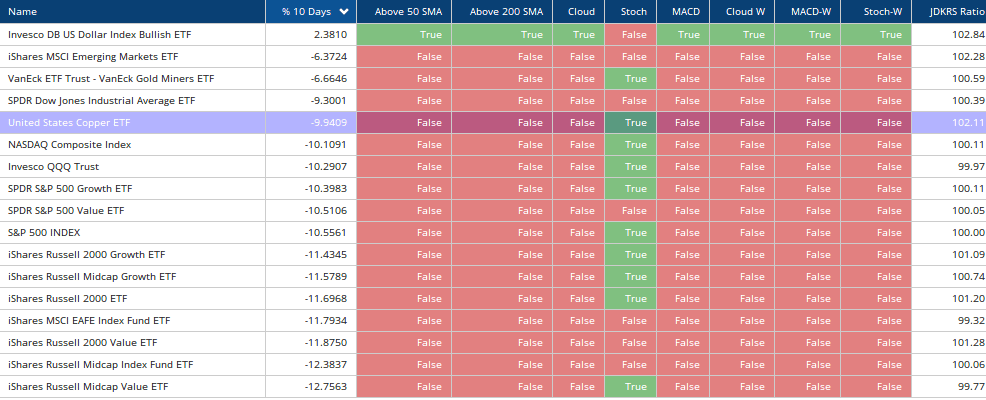
Looking at where we stand, the markets still remain weak. The below chart shows some of our short and long-term signals.
Simply, red means stop and green means go. We are seeing a lot more red than green right now.
The US equity market is very oversold in the short term and a bounce may occur this week. Most likely it will be short-term in nature as the technicals still point to a weak market. (Note: Numerous Fed members will be speaking this weak, which may add additional market volatility.)
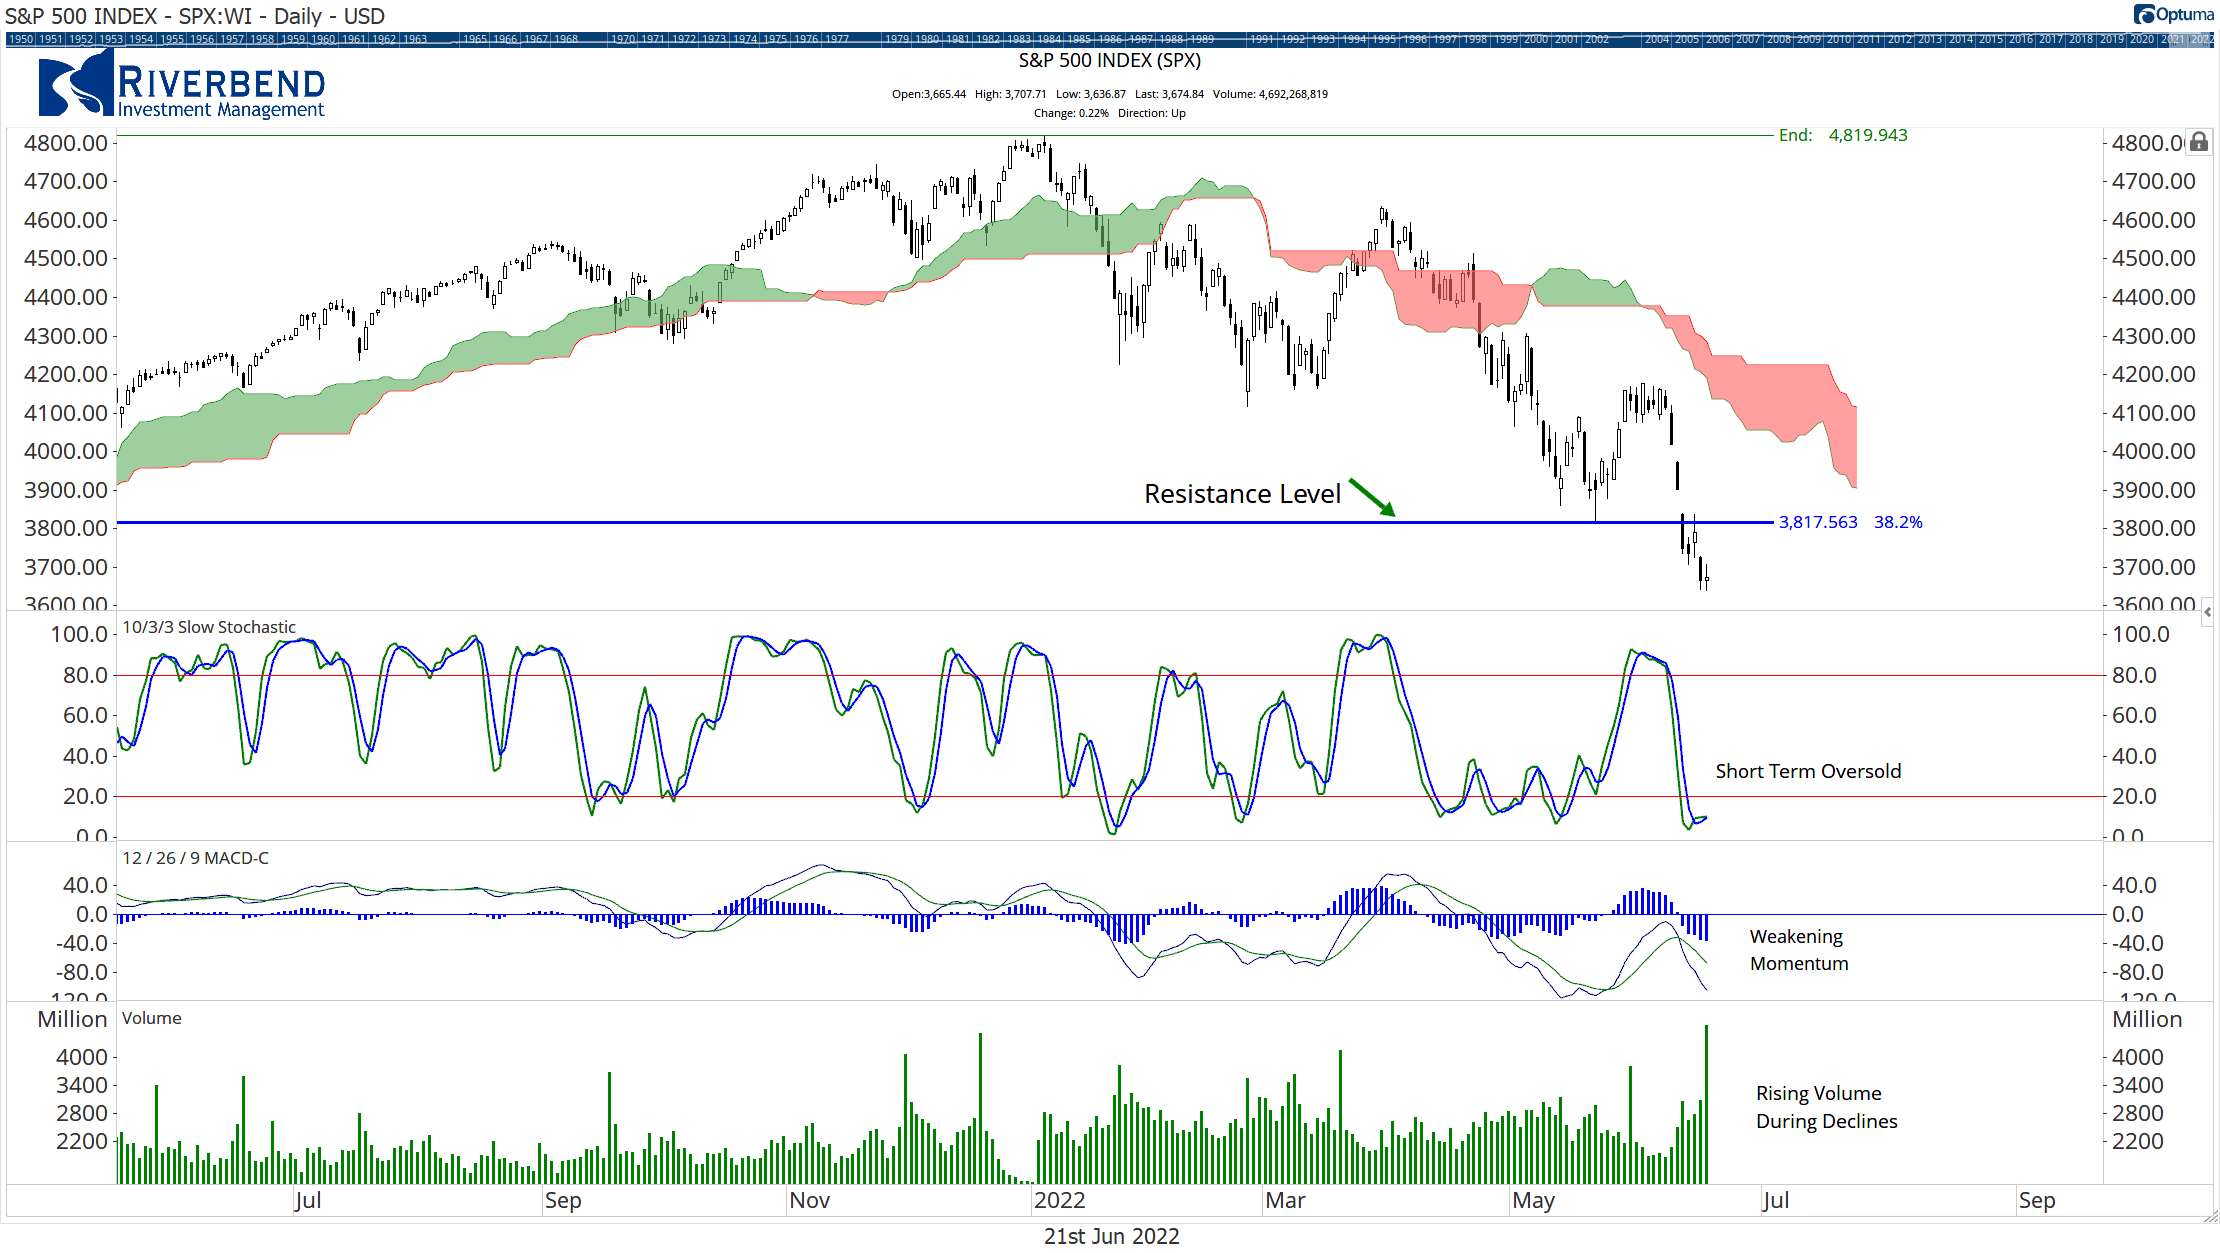
The S&P 500 index is still trading well below the Cloud model with momentum continuing to weaken.
The stochastics oscillator is showing an oversold market and is indicating a short-term buy signal.
The S&P 500 has resistance at the 38.2% retracement level. For the market to attract more buyers from the sidelines, we need to start trading above this level.
While the market has been declining, investors don’t seem to be panicking yet.
When investors panic, they tend to sell all asset classes at once. This causes a high correlation among sectors. As investors become more comfortable with the state of the market, the correlations will begin to return to historical levels.
Correlations are getting tighter, but they are nowhere near “panic” levels. The chart below shows the current level of correlation vs the panic selloff during COVID.
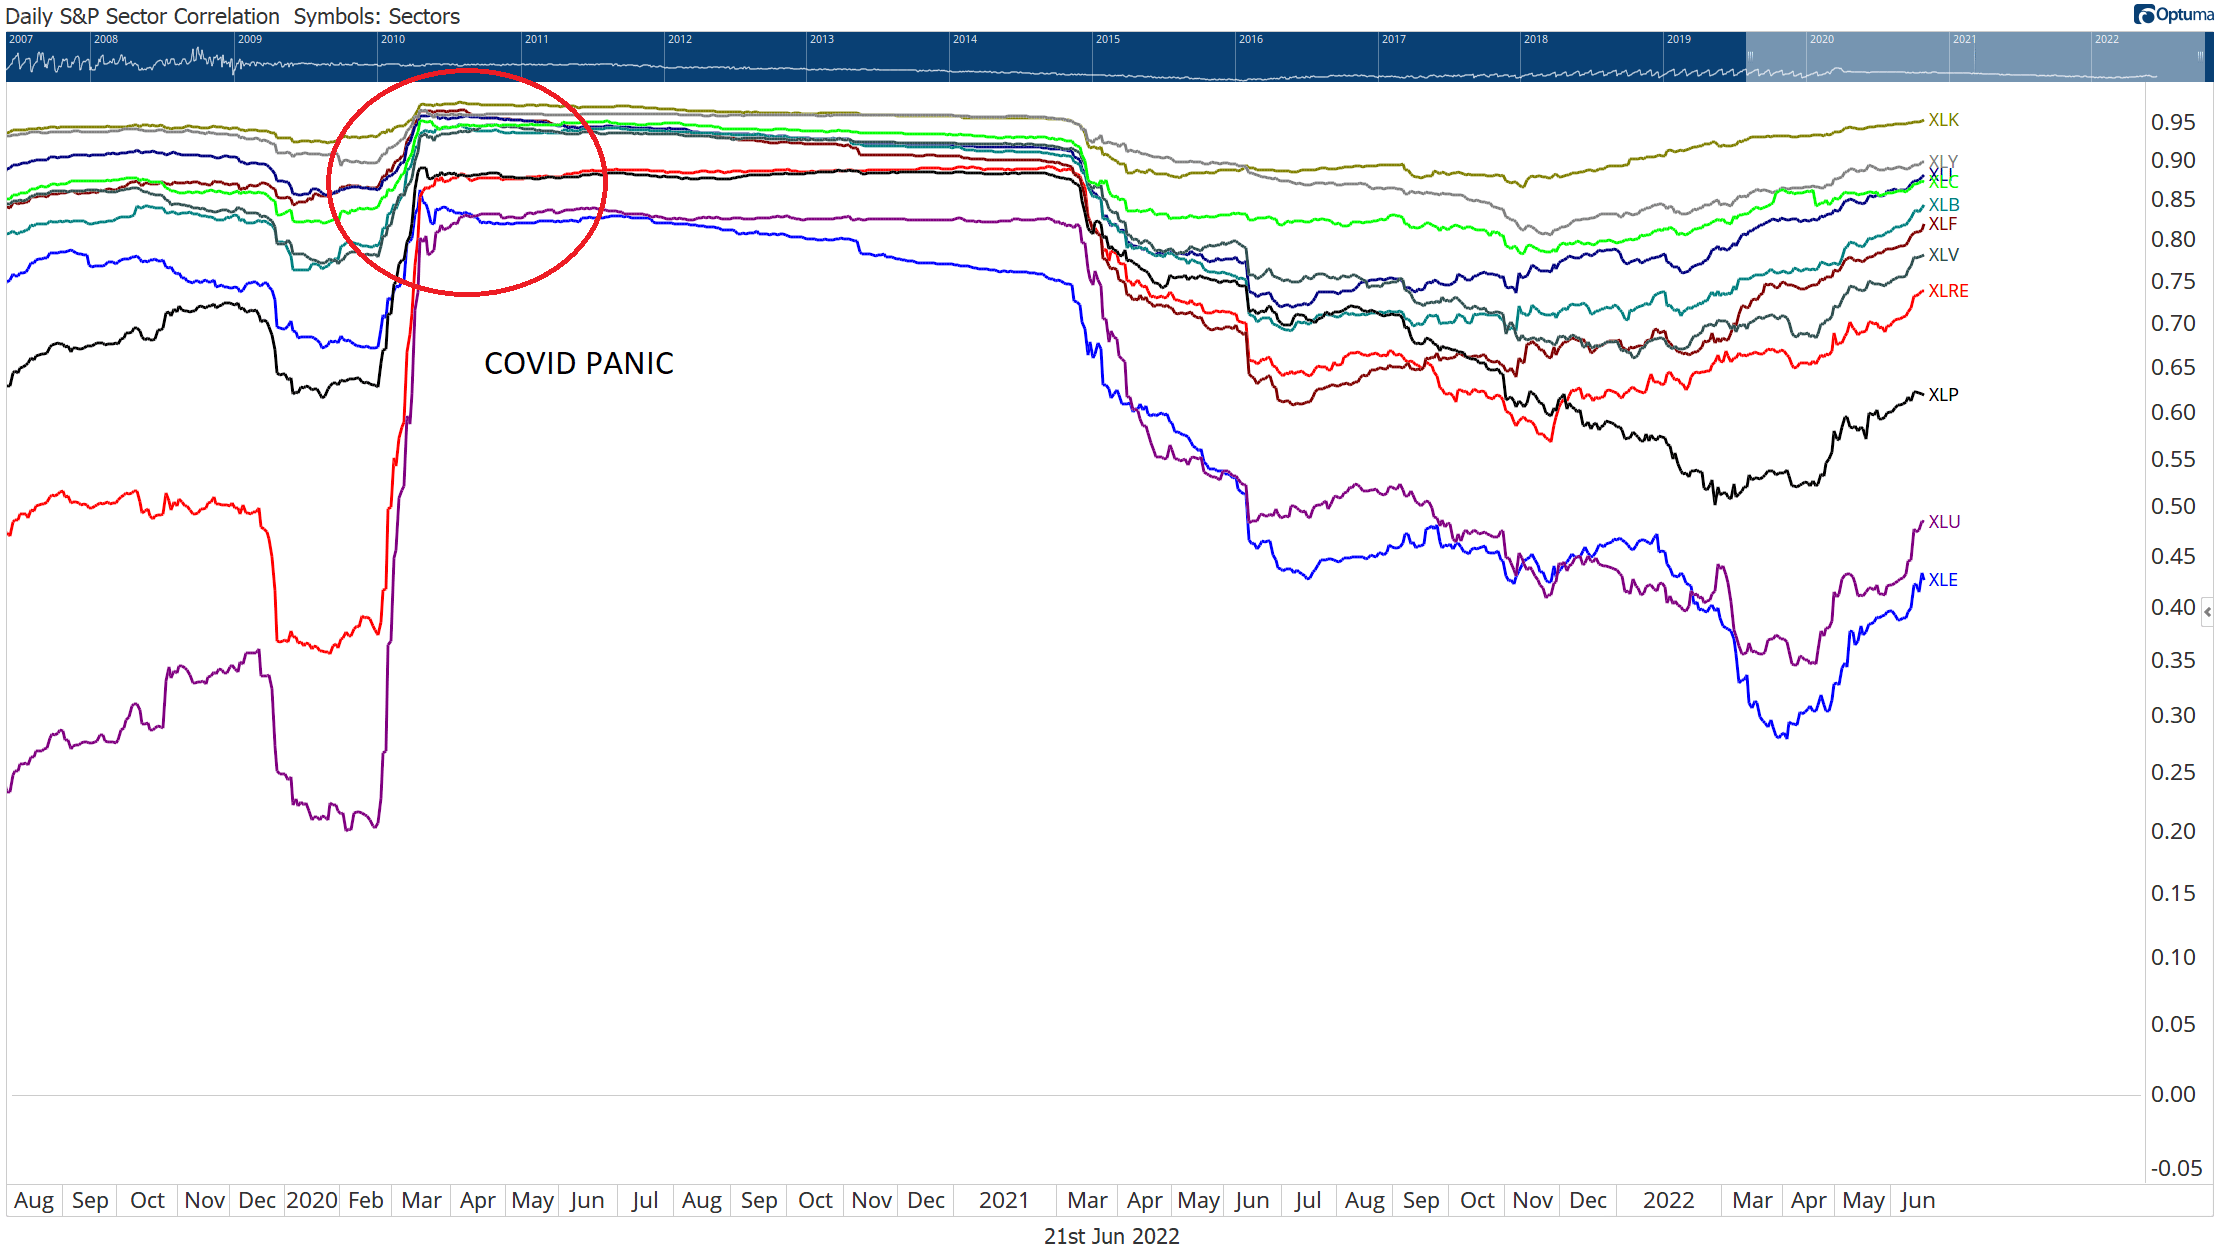
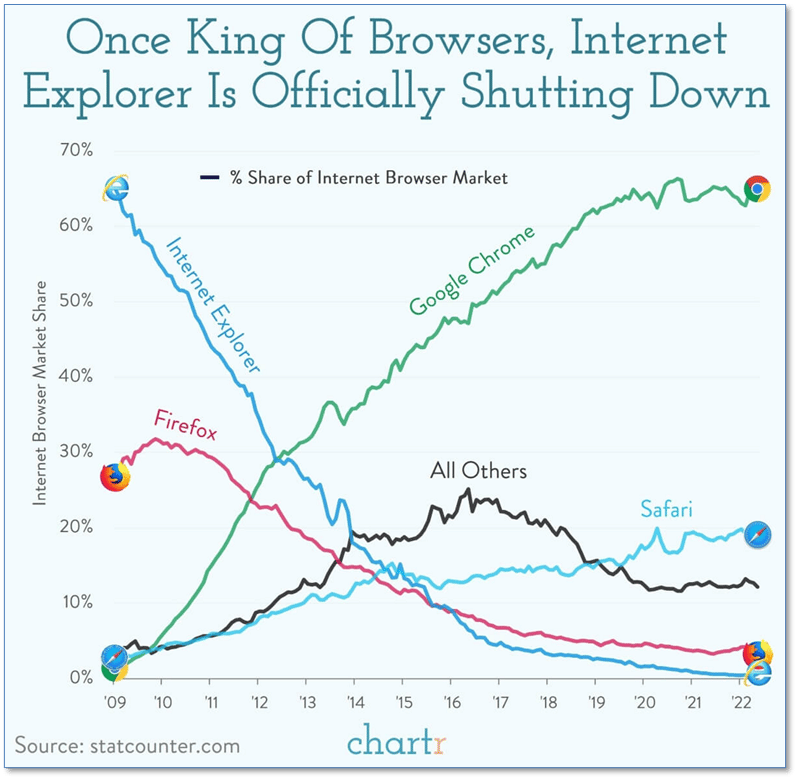
Chart of the Week:
After 27 years, Microsoft’s support for its once-dominant internet browser ‘Internet Explorer’ (IE) has come to an end.
At one point, IE’s market share was estimated to be as high as 90%, primarily due to its bundling with the Windows operating system that essentially forced its use over other 3rd party options, like Netscape Navigator. And while Microsoft has tried to push its current browser “Edge”, it’s had little success there as well—currently holding only about 4% of market share.
The clear current winner is Google’s Chrome browser, whose users report much faster loading speeds and tabs that crash less frequently.
Riverbend Indicators:
- As a reading of our Bull-Bear Indicator for U.S. Equities (comparative measurements over a rolling one-year timeframe), we remain in Cyclical Bull territory.
- Counting up the number of all our indicators that are ‘Up’ for U.S. Equities, the current tally is that zero of four are Positive, representing a multitude of timeframes (two that can be solely days/weeks, or months+ at a time; another, a quarter at a time; and lastly, the {typically} years-long reading, that being the Cyclical Bull or Bear status).
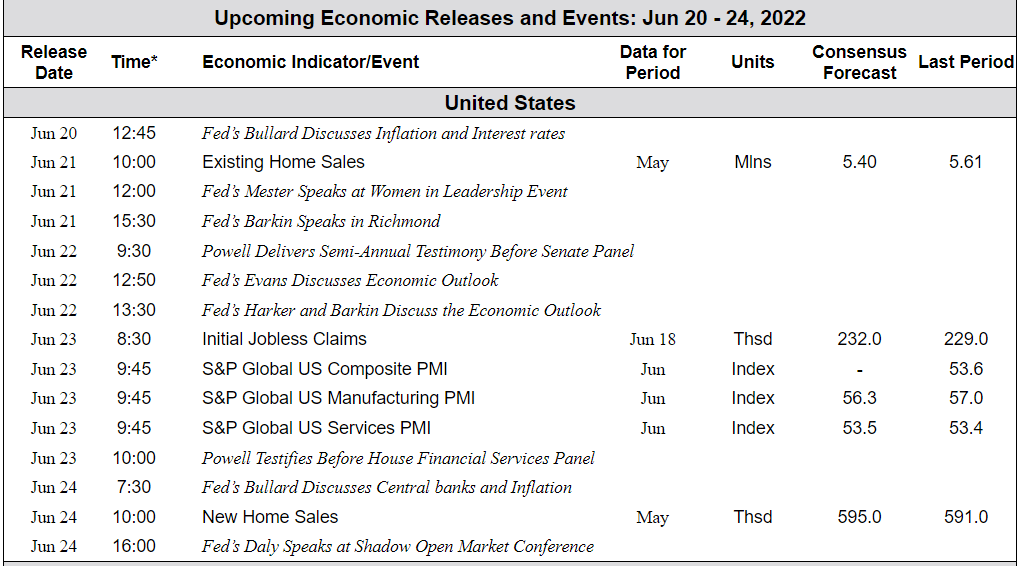
The Week Ahead: