[fusion_builder_container hundred_percent=”no” equal_height_columns=”no” menu_anchor=”” hide_on_mobile=”small-visibility,medium-visibility,large-visibility” class=”” id=”” background_color=”” background_image=”” background_position=”center center” background_repeat=”no-repeat” fade=”no” background_parallax=”none” parallax_speed=”0.3″ video_mp4=”” video_webm=”” video_ogv=”” video_url=”” video_aspect_ratio=”16:9″ video_loop=”yes” video_mute=”yes” overlay_color=”” video_preview_image=”” border_size=”” border_color=”” border_style=”solid” padding_top=”” padding_bottom=”” padding_left=”” padding_right=””][fusion_builder_row][fusion_builder_column type=”1_6″ layout=”1_6″ spacing=”” center_content=”no” link=”” target=”_self” min_height=”” hide_on_mobile=”small-visibility,medium-visibility,large-visibility” class=”” id=”” hover_type=”none” border_size=”0″ border_color=”” border_style=”solid” border_position=”all” border_radius=”” box_shadow=”no” dimension_box_shadow=”” box_shadow_blur=”0″ box_shadow_spread=”0″ box_shadow_color=”” box_shadow_style=”” padding_top=”” padding_right=”” padding_bottom=”” padding_left=”” margin_top=”” margin_bottom=”” background_type=”single” gradient_start_color=”” gradient_end_color=”” gradient_start_position=”0″ gradient_end_position=”100″ gradient_type=”linear” radial_direction=”center” linear_angle=”180″ background_color=”” background_image=”” background_image_id=”” background_position=”left top” background_repeat=”no-repeat” background_blend_mode=”none” animation_type=”” animation_direction=”left” animation_speed=”0.3″ animation_offset=”” filter_type=”regular” filter_hue=”0″ filter_saturation=”100″ filter_brightness=”100″ filter_contrast=”100″ filter_invert=”0″ filter_sepia=”0″ filter_opacity=”100″ filter_blur=”0″ filter_hue_hover=”0″ filter_saturation_hover=”100″ filter_brightness_hover=”100″ filter_contrast_hover=”100″ filter_invert_hover=”0″ filter_sepia_hover=”0″ filter_opacity_hover=”100″ filter_blur_hover=”0″ last=”no”][/fusion_builder_column][fusion_builder_column type=”2_3″ layout=”1_1″ background_position=”left top” background_color=”” border_size=”” border_color=”” border_style=”solid” border_position=”all” spacing=”yes” background_image=”” background_repeat=”no-repeat” padding_top=”” padding_right=”” padding_bottom=”” padding_left=”” margin_top=”0px” margin_bottom=”0px” class=”” id=”” animation_type=”” animation_speed=”0.3″ animation_direction=”left” hide_on_mobile=”small-visibility,medium-visibility,large-visibility” center_content=”no” last=”no” min_height=”” hover_type=”none” link=””][fusion_text]
[/fusion_text][fusion_vimeo id=”533314876″ alignment=”center” width=”1000″ height=”” autoplay=”false” api_params=”” hide_on_mobile=”small-visibility,medium-visibility,large-visibility” class=”” css_id=”” /][fusion_text]
U.S. Markets: 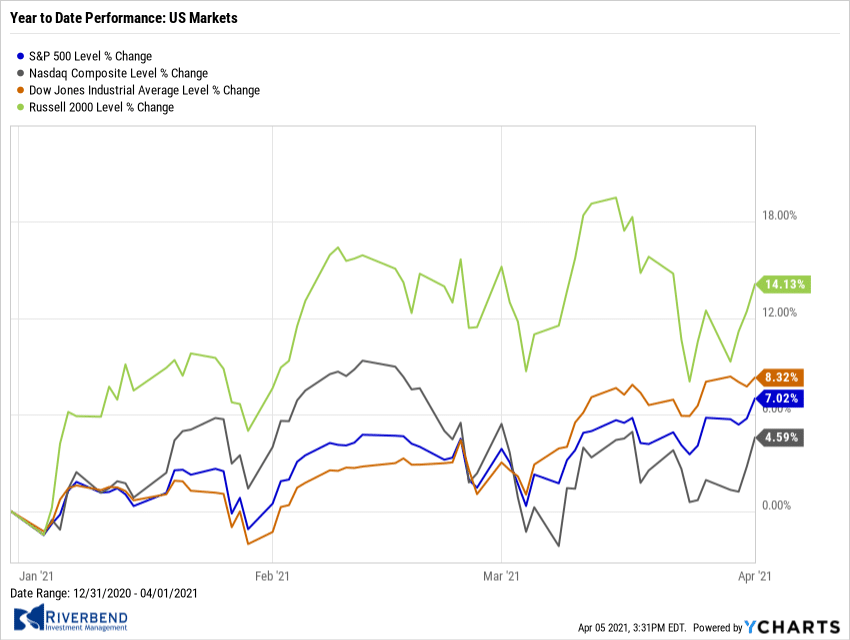
The major U.S. benchmarks ended the holiday-shortened week higher. The large-cap S&P 500 index crossed the 4,000 threshold for its first time, and the mid cap S&P 400 also set a new intraday record. The technology-heavy NASDAQ Composite led the advance, rebounding after selling off the most among U.S. indices in the first quarter. The Dow Jones Industrial Average rose 80 points finishing the week at 33,153—a gain of 0.2%. The NASDAQ Composite jumped 2.6% to 13,480. By market cap, the large cap S&P 500 added 1.1%, while the mid cap S&P 400 and small cap Russell 2000 rose 0.8% and 1.5%, respectively.
International Markets: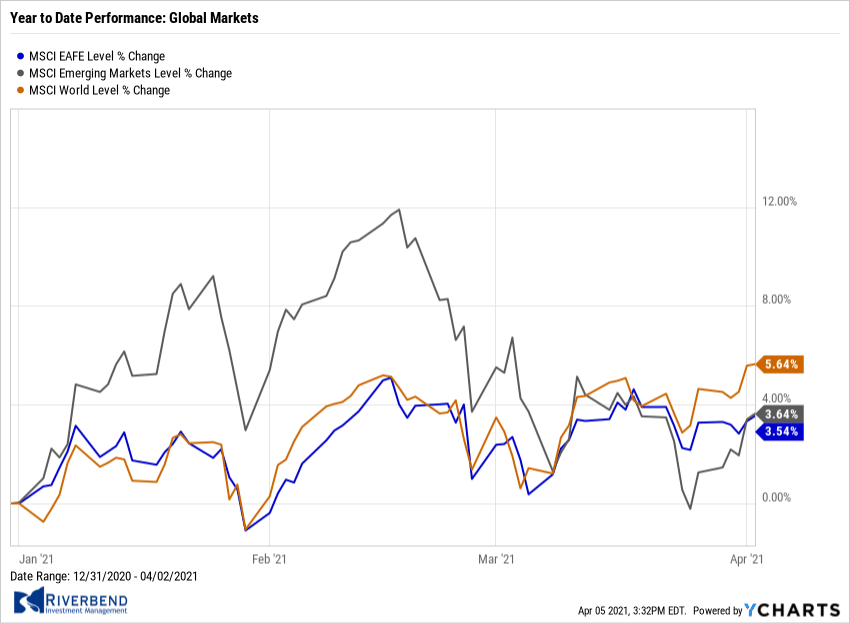
Canada’s TSX rose 1.3%, while the United Kingdom’s FTSE 100 ticked down -0.1%. On Europe’s mainland, France’s CAC 40 rose 1.9%, while Germany’s DAX jumped 2.4%. In Asia, China’s Shanghai Composite added 1.4% and Japan’s Nikkei added 0.7%. As grouped by Morgan Stanley Capital International, developed markets added 0.3%, while emerging markets tacked on 1.1% for the week.
Commodities: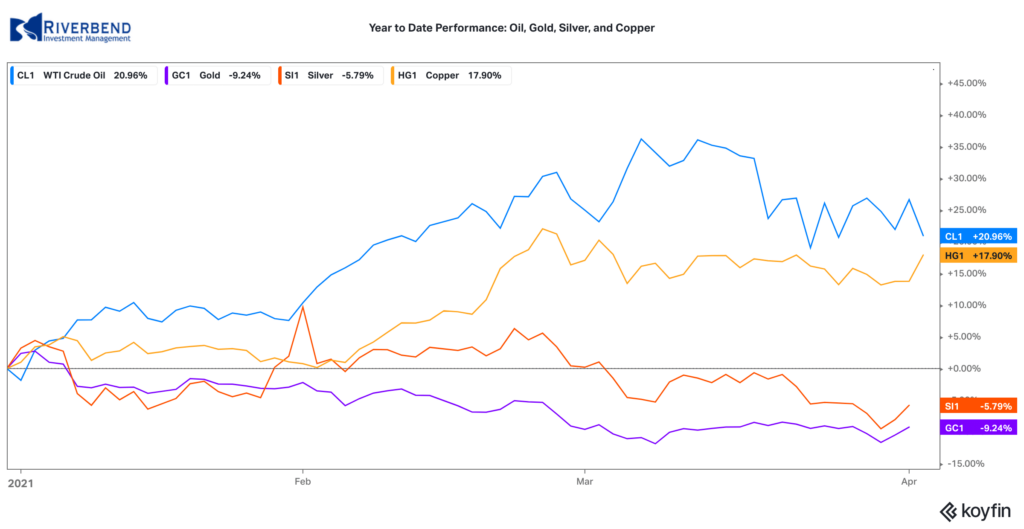
Precious metals ended the week down. Gold ticked down -0.2% to $1728.40 an ounce, while Silver finished down -0.7% to $24.95 per ounce. Energy was bid higher following three down weeks. West Texas Intermediate crude oil rose 0.8% to $61.45 per barrel. The industrial metal copper, viewed by some analysts as a barometer of world economic health due to its wide variety of uses, fell for a third consecutive week, ending down -1.9%.
U.S. Economic News:
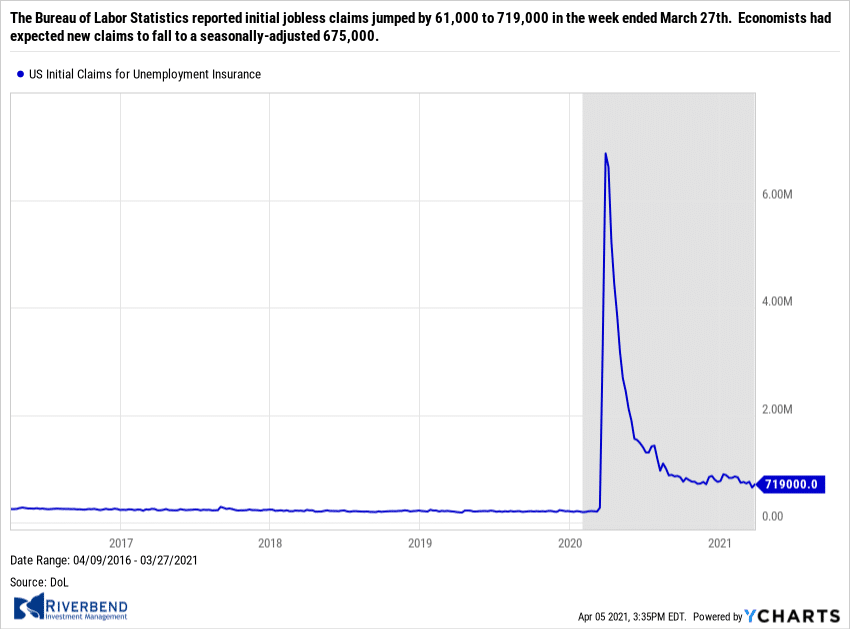 The number of Americans filing for first-time unemployment benefits rose at the end of the March, but economists expect the increase is just a temporary blip. The Bureau of Labor Statistics reported initial jobless claims jumped by 61,000 to 719,000 in the week ended March 27th. Economists had expected new claims to fall to a seasonally-adjusted 675,000. New claims increased the most in Virginia, along with smaller increases in Kentucky, Georgia, New Jersey and California. They declined the most in Ohio, Massachusetts and Florida. The number of people already collecting unemployment benefits declined to 46,000 to 3.79 million. These so-called “continuing claims” are now at their lowest level in a year. Analysts are expecting a quick rebound in the labor market. Senior economist Bill Adams of PNC Financial Services stated, “Job growth will accelerate dramatically in coming months as the U.S. reaches herd immunity and the high-contact service sector revives.”
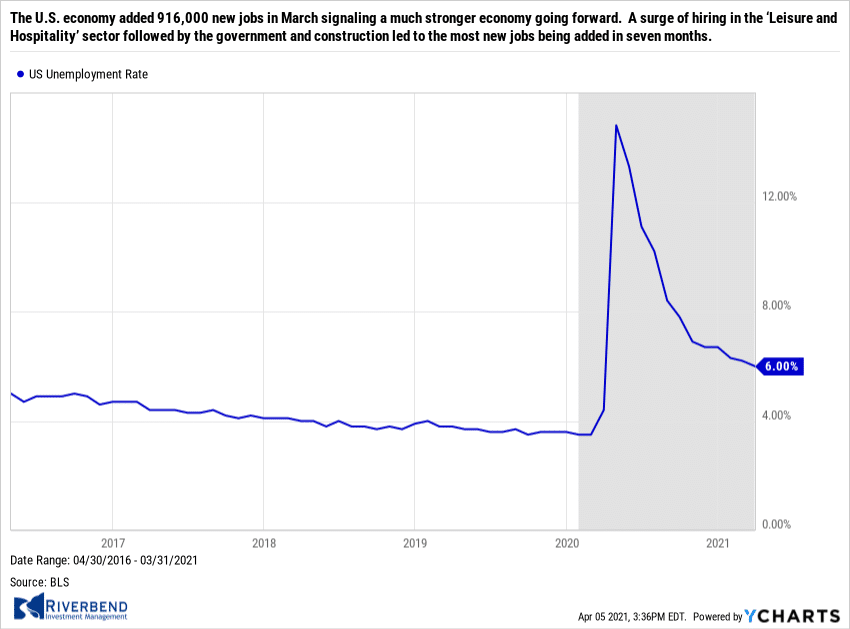 The U.S. economy added 916,000 new jobs in March signaling a much stronger economy going forward. A surge of hiring in the ‘Leisure and Hospitality’ sector followed by the government and construction led to the most new jobs being added in seven months. The growth in jobs easily exceeded economists’ forecasts. Economists had expected just 675,000 new jobs. Economists predict even faster hiring in the months ahead if most Americans get vaccinated and the coronavirus pandemic fades away. Meanwhile, the official unemployment rate slipped 0.2% to 6%. Sal Guatieri of senior economist at BMO Capital Markets stated, “Job growth is now accelerating across the nation, helped by massive fiscal stimulus and a now speedy vaccination program.”
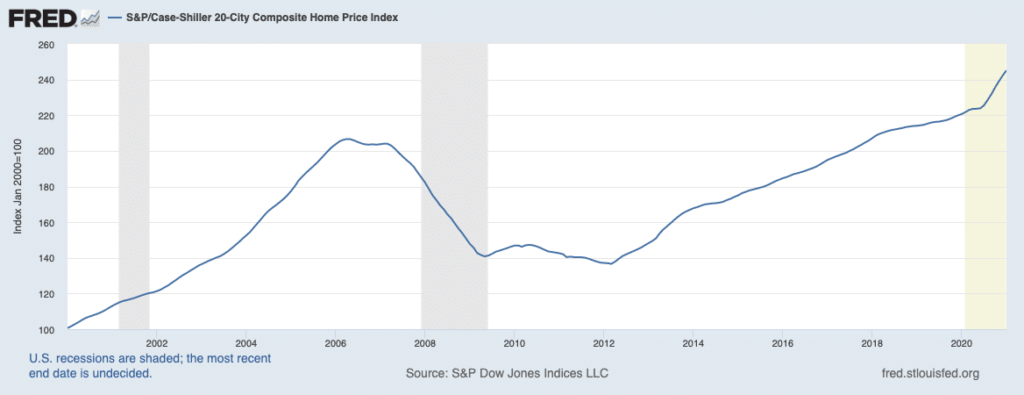 Home prices continued to increase at a double-digit pace around the country according to two separate widely-followed housing market indexes. The S&P CoreLogic Case-Shiller 20-city home price index posted an 11.1% annual gain in January—up from 10.2% the previous month. On a monthly basis, the 20-city index increased 0.9% between December and January. Prices rose on a monthly basis in 19 of the 20 large cities tracked by Case-Shiller. Phoenix saw the highest rate of price appreciation with a 15.8% gain year-over-year, followed by Seattle and San Diego. Cleveland was the only city to see prices drop. Craig Lazzara, managing director and global head of index investment strategy at S&P DJI said in the report, “January’s data remain consistent with the view that COVID has encouraged potential buyers to move from urban apartments to suburban homes.” In addition, the broader Case-Shiller national price index which covers the entire country, posted an 11.2% year-over-year gain in January—its biggest monthly increase in almost 15 years. Separately, the Federal Housing Finance Agency released its own home-price index which showed a 12% increase in home prices nationwide compared to a year ago and a 1% uptick month-over month.
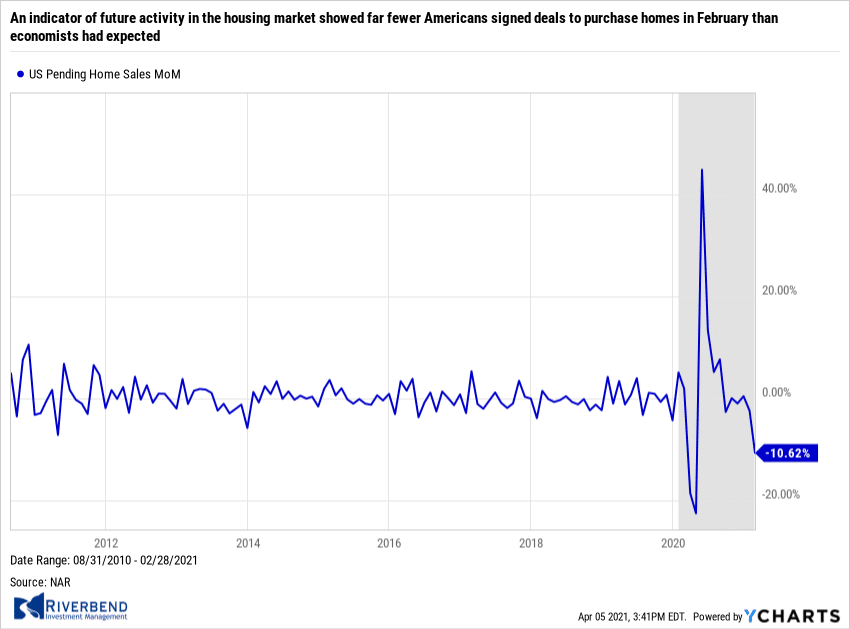 An indicator of future activity in the housing market showed far fewer Americans signed deals to purchase homes in February than economists had expected. The National Association of Realtors (NAR) reported its index of pending home sales fell 10.6% in February—the fifth consecutive month in which this measure declined. The index tracks real-estate transactions in which a contract has been signed but the sale has not yet closed. The median forecast of economists had called for a 3.1% decline in pending sales on a monthly basis. Compared to 2020, pending sales were down 0.5%, representing the first annual decline in eight months. Pending home sales fell in every region of the country. The South notched the largest decline, with a 13% monthly decrease, while the West had the smallest drop at 7.4%.

Source: Bloomberg
Confidence among the nation’s consumers surged in March to a one-year high as more Americans got vaccinated and the government distributed $1,400 stimulus checks to boost the economy. The Conference Board reported its index of consumer confidence surged 19.3 points to 109.7 in March from the previous month. Economists had expected a smaller increase to just 96.8. For perspective, the index had stood at a 20-year high of 132.6 in February of 2020, shortly before the onset of the coronavirus pandemic. The part of the survey that tracks how consumers feel about the economy right now, known as the “present situation index”, jumped to 110 from 89.6. Lynn Franco, senior director of economic indicators at the nonprofit board stated, “Consumers’ renewed optimism boosted their purchasing intentions for homes, autos and several big-ticket items.” Another gauge that assesses how Americans view the next six months–future expectations index–leaped to 109.6 from 90.9. That’s the highest level in 21 months. One growing worry: higher inflation, mainly at the gas pump. That “may temper spending intentions in the months ahead,” Franco said.
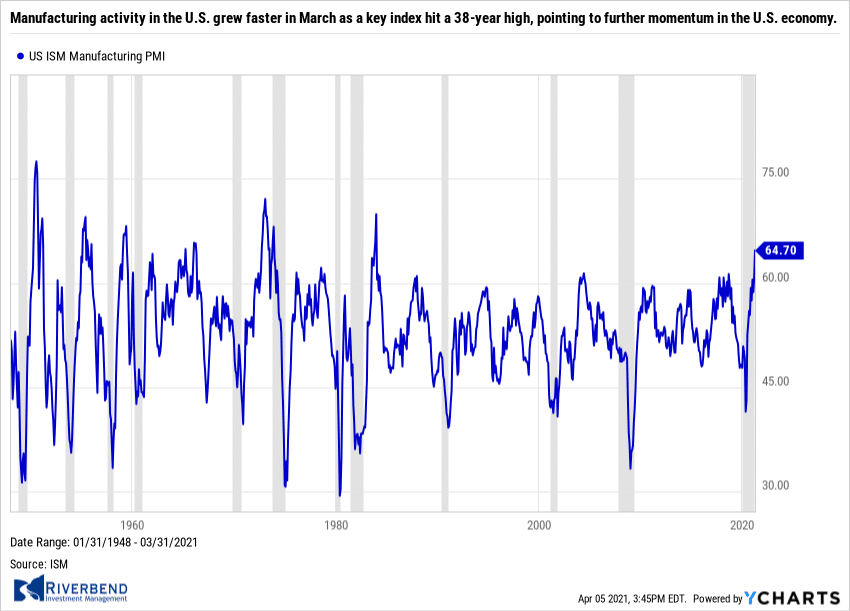 Manufacturing activity in the U.S. grew faster in March as a key index hit a 38-year high, pointing to further momentum in the U.S. economy. The Institute for Supply Management (ISM) reported its manufacturing index jumped to 64.7 from 60.8 in the prior month. Readings over 50 indicate growth, while anything over 55 is considered exceptional. The increase far surpassed Wall Street’s expectations of 61.7. In the details, the improvement in manufacturing activity was widespread across almost all industries. Seventeen of the 18 industries tracked by ISM expanded in March, with most reporting increases in production, new orders and employment. The biggest problems manufacturers face right now are shortages of some key supplies – and workers – that are hindering production and raising prices. Finding enough skilled workers, especially in a pandemic, has also been a chronic problem. In the report, a senior executive at a maker of transportation equipment stated, “Business conditions are positive for our industry and company. The constraints are mainly related to parts availability. Manpower is also a constraint. Hiring new workers is a challenge.”
Chart of the Week:
Volkswagen pulled an early April Fool’s joke on the world when it announced that it was henceforth changing its name to “Voltswagen”. Later, VW admitted it was indeed an April Fool’s joke, but it certainly succeeded in drawing attention to VWs very large ambitions in the Electric Vehicle (EV) industry. In fact, around the globe VW has been gaining market share rather sharply, and the consulting firm Wood Mackenzie predicts that VW will become the world’s largest EV producer by the end of this decade, producing about half of the total EV unit output. (Chart from chartr.co)
The Week Ahead:
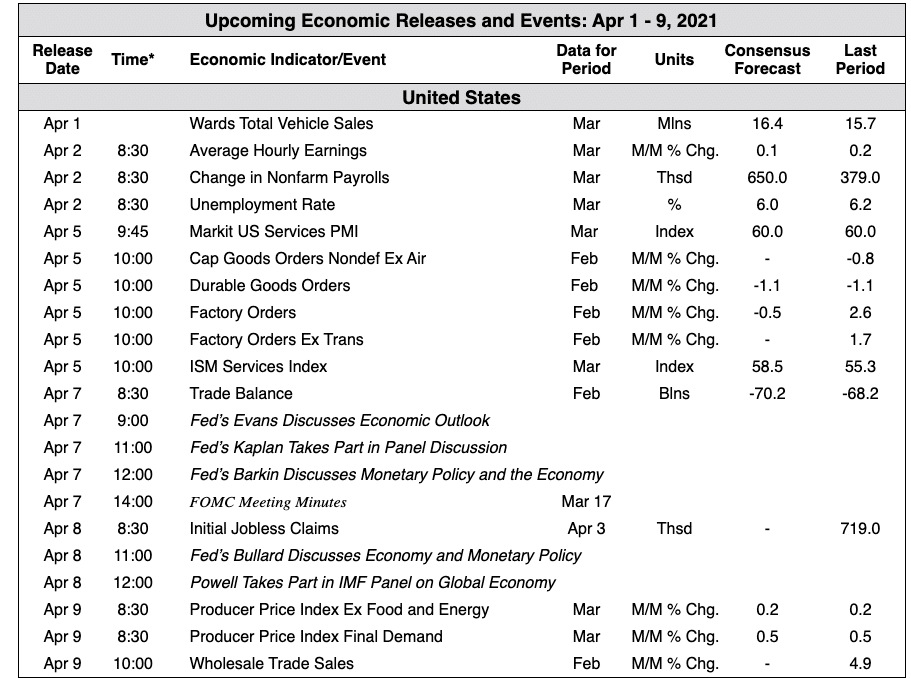
Source: Bloomberg, TD Economics
(Sources: All index- and returns-data from Yahoo Finance; news from Reuters, Barron’s, Wall St. Journal, Bloomberg.com, ft.com, guggenheimpartners.com, zerohedge.com, ritholtz.com, markit.com, financialpost.com, Eurostat, Statistics Canada, Yahoo! Finance, stocksandnews.com, marketwatch.com, wantchinatimes.com, BBC, 361capital.com, pensionpartners.com, cnbc.com, FactSet.)
[/fusion_text][/fusion_builder_column][fusion_builder_column type=”1_6″ layout=”1_6″ spacing=”” center_content=”no” link=”” target=”_self” min_height=”” hide_on_mobile=”small-visibility,medium-visibility,large-visibility” class=”” id=”” hover_type=”none” border_size=”0″ border_color=”” border_style=”solid” border_position=”all” box_shadow=”no” box_shadow_blur=”0″ box_shadow_spread=”0″ box_shadow_color=”” box_shadow_style=”” background_type=”single” gradient_start_position=”0″ gradient_end_position=”100″ gradient_type=”linear” radial_direction=”center” linear_angle=”180″ background_color=”” background_image=”” background_image_id=”” background_position=”left top” background_repeat=”no-repeat” background_blend_mode=”none” animation_type=”” animation_direction=”left” animation_speed=”0.3″ animation_offset=”” filter_type=”regular” filter_hue=”0″ filter_saturation=”100″ filter_brightness=”100″ filter_contrast=”100″ filter_invert=”0″ filter_sepia=”0″ filter_opacity=”100″ filter_blur=”0″ filter_hue_hover=”0″ filter_saturation_hover=”100″ filter_brightness_hover=”100″ filter_contrast_hover=”100″ filter_invert_hover=”0″ filter_sepia_hover=”0″ filter_opacity_hover=”100″ filter_blur_hover=”0″ last=”no”][/fusion_builder_column][/fusion_builder_row][/fusion_builder_container][fusion_builder_container hundred_percent=”no” hundred_percent_height=”no” hundred_percent_height_scroll=”no” hundred_percent_height_center_content=”yes” equal_height_columns=”no” menu_anchor=”” hide_on_mobile=”small-visibility,medium-visibility,large-visibility” status=”published” publish_date=”” class=”” id=”” border_size=”” border_color=”” border_style=”solid” margin_top=”” margin_bottom=”” padding_top=”” padding_right=”” padding_bottom=”” padding_left=”” gradient_start_color=”” gradient_end_color=”” gradient_start_position=”0″ gradient_end_position=”100″ gradient_type=”linear” radial_direction=”center” linear_angle=”180″ background_color=”” background_image=”” background_position=”center center” background_repeat=”no-repeat” fade=”no” background_parallax=”none” enable_mobile=”no” parallax_speed=”0.3″ background_blend_mode=”none” video_mp4=”” video_webm=”” video_ogv=”” video_url=”” video_aspect_ratio=”16:9″ video_loop=”yes” video_mute=”yes” video_preview_image=”” filter_hue=”0″ filter_saturation=”100″ filter_brightness=”100″ filter_contrast=”100″ filter_invert=”0″ filter_sepia=”0″ filter_opacity=”100″ filter_blur=”0″ filter_hue_hover=”0″ filter_saturation_hover=”100″ filter_brightness_hover=”100″ filter_contrast_hover=”100″ filter_invert_hover=”0″ filter_sepia_hover=”0″ filter_opacity_hover=”100″ filter_blur_hover=”0″][fusion_builder_row][/fusion_builder_row][/fusion_builder_container]


