The stock market continues its decline and has broken through key levels of long-term support.
Since its January peak, the S&P 500 index is down over 17% and NASDAQ has declined over 26%.
Historically, pullbacks are normal in the stock market. Since 1980, the average year sees a drop of -13.5%.
![]()
However, the market is beginning to behave less “ordinary” indicating that the current decline may be much larger than the historic average.
As I mentioned above, the S&P 500 has broken through some key support levels. These are levels where traders and institutional buyers expect the market to reverse. (Based on valuations, historical volume at price points, etc)
One tool I use to help visualize these support levels is the cloud model.
When the market is trading above “the cloud”, it indicates the market is trending upwards.
Currently, the S&P 500 has fallen below the cloud (weekly chart):
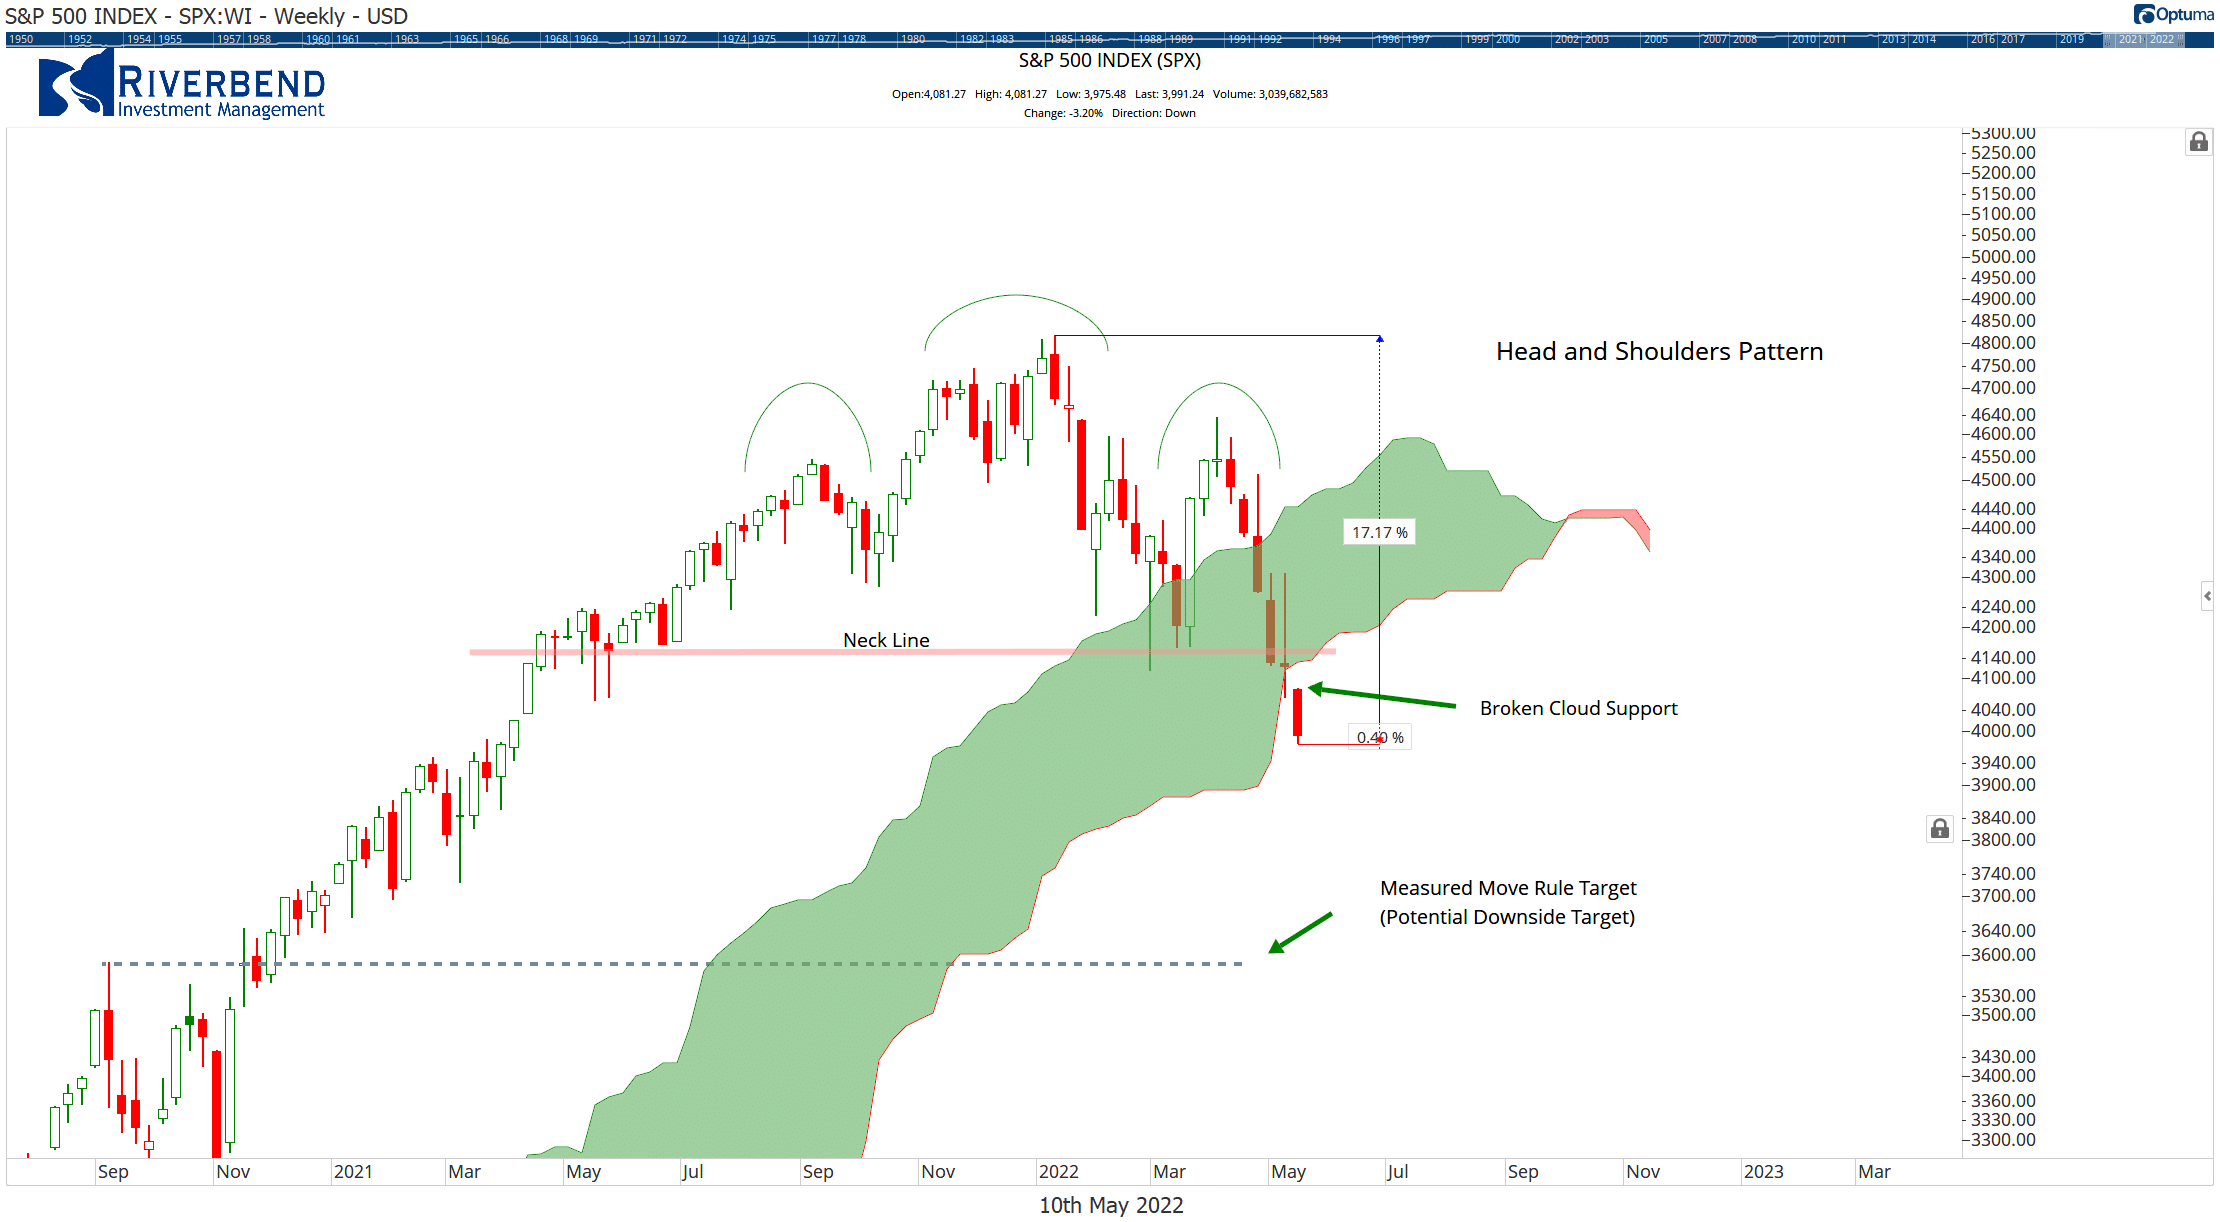
In the past, when the market trades below the cloud, a larger decline usually follows.
The below chart highlights the S&P 500 above and below the cloud. The green shaded areas represent when the S&P 500 is above the cloud. The non-shaded area represents when the market is trading below the cloud.
Until the market begins a new uptrend, our strategies are in cash/hedged positions.
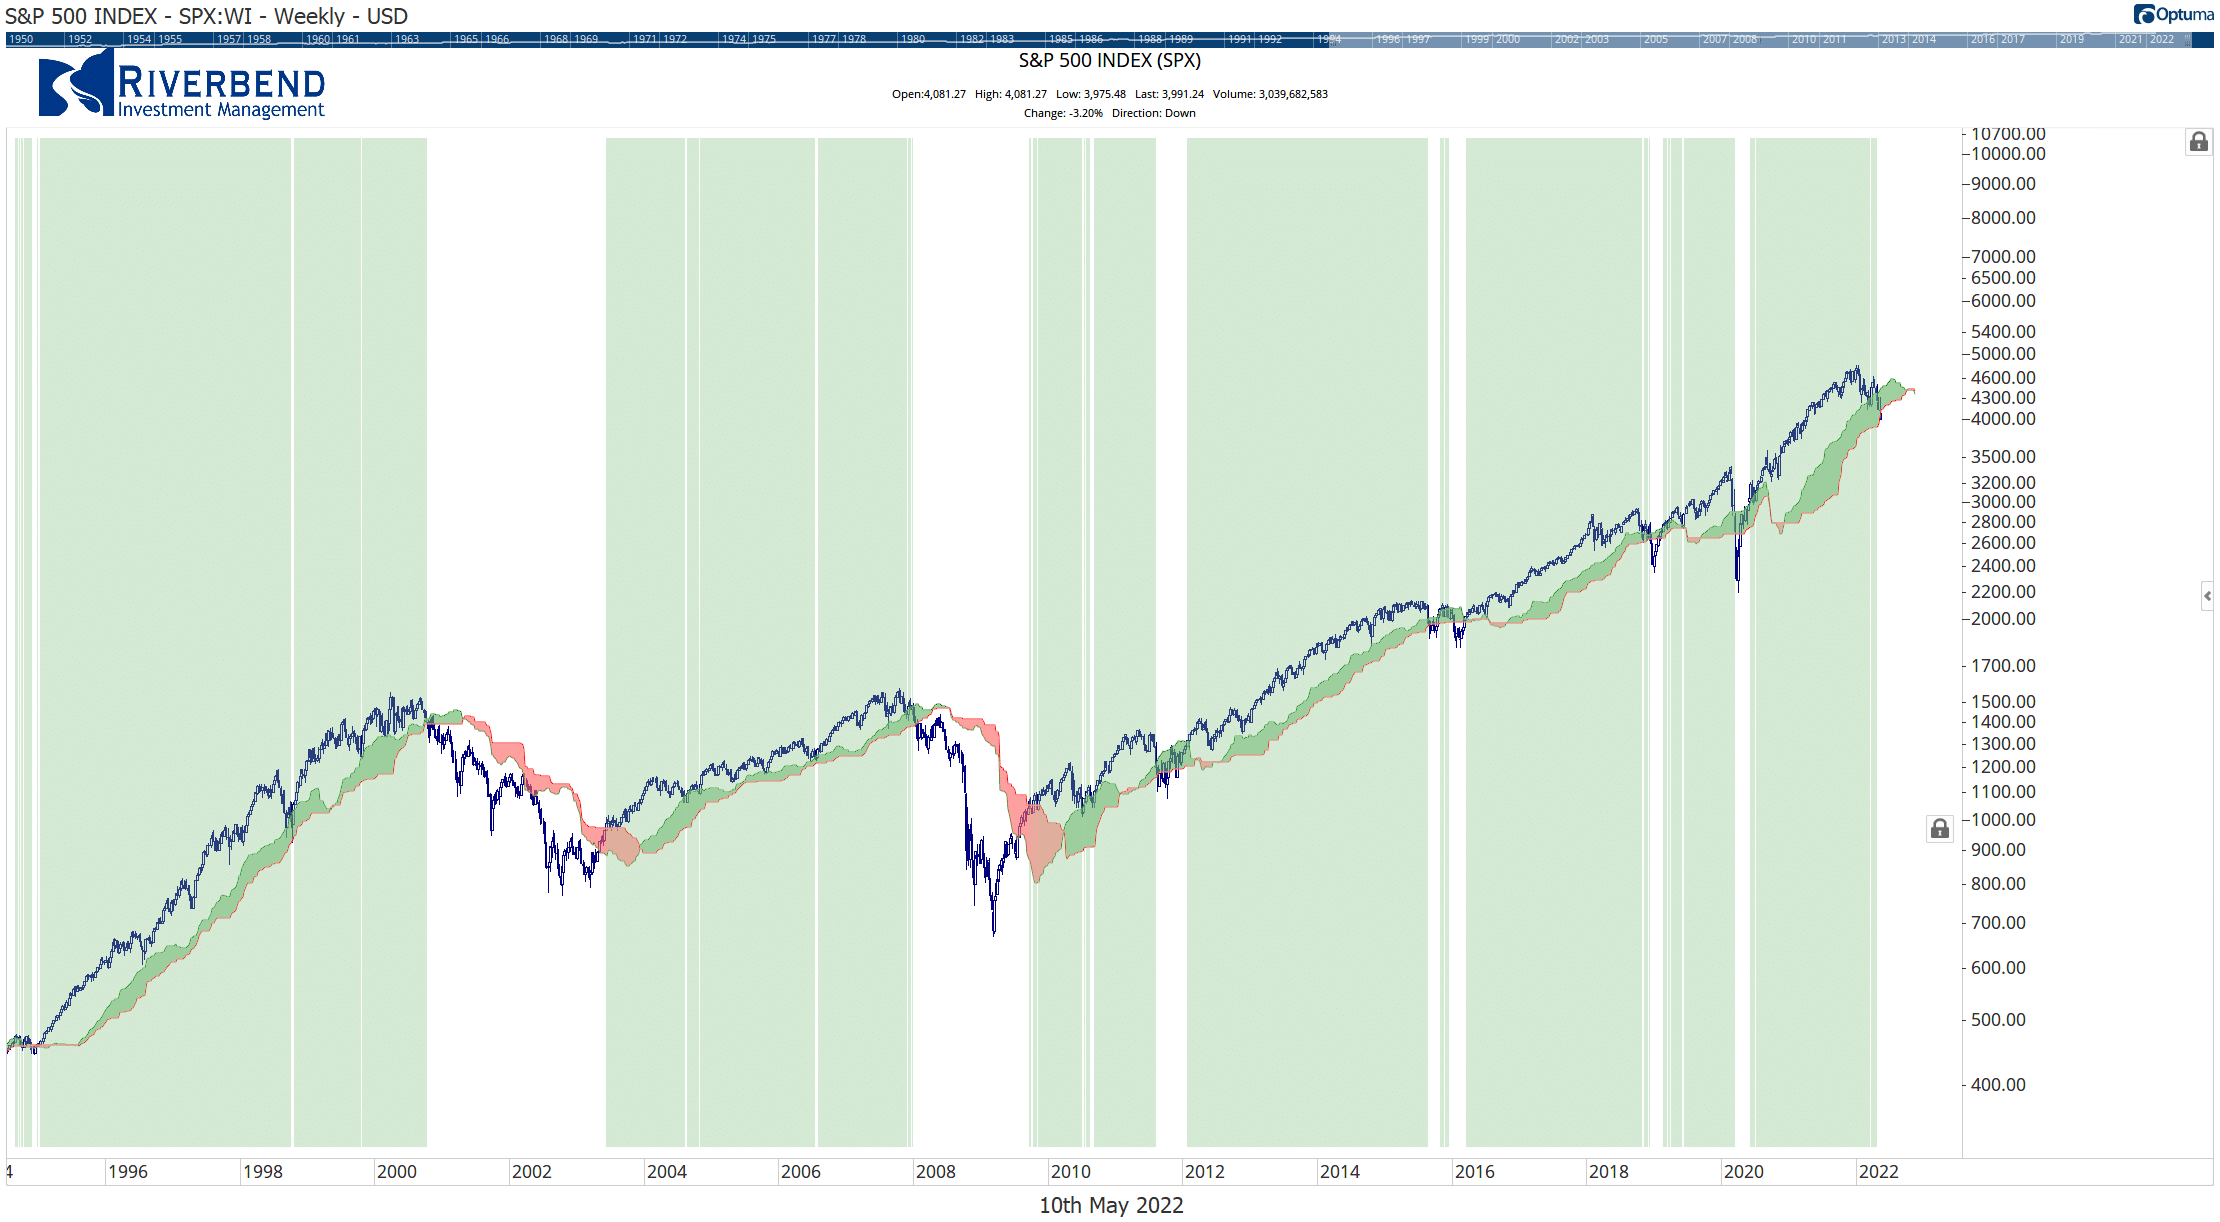
Chart of the Week:
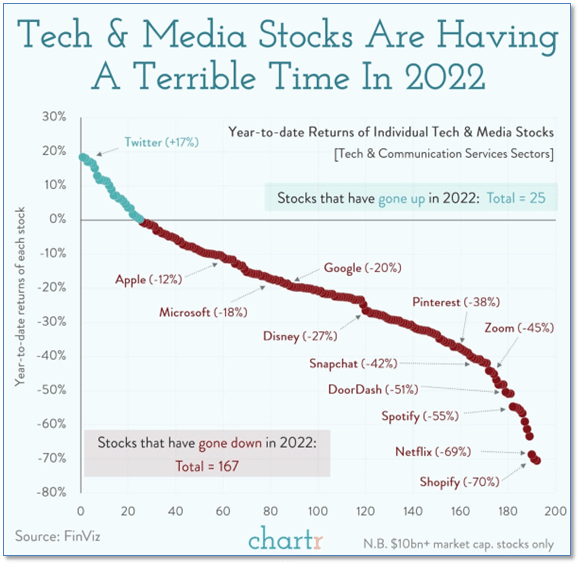
On Thursday the NASDAQ Composite Index fell 5%, its biggest one-day decline since 2020.
However, looking beneath the surface reveals problems in the tech-heavy index that have existed for quite some time.
E-commerce behemoth Shopify fell 15% after posting its slowest revenue growth in 7 years, with its shares down 70% year-to-date, while Netflix’s high-profile meltdown has seen its shares fall 69%.
Out of the 192 large stocks in Technology and Communication Services, over 160 are down this year.
Riverbend Indicators:
- As a reading of our Bull-Bear Indicator for U.S. Equities (comparative measurements over a rolling one-year timeframe), we remain in Cyclical Bull territory.
- Counting up the number of all our indicators that are ‘Up’ for U.S. Equities, the current tally is that zero of four are Positive, representing a multitude of timeframes (two that can be solely days/weeks, or months+ at a time; another, a quarter at a time; and lastly, the {typically} years-long reading, that being the Cyclical Bull or Bear status).
The Week Ahead: