Week in Review
U.S. Markets
U.S. stocks finished the week with gains despite significant volatility intraweek, mostly triggered by trade headlines. Early in the week concerns about the Trump administration implementing a new round of trade tariffs weighed on sentiment, however later in the week news that Treasury Secretary Steven Mnuchin would lead a new round of trade negotiations with China lifted stocks off their intraday lows.
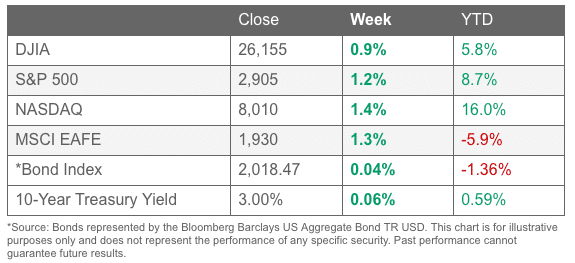
For the week, the Dow Jones Industrial Average rose 238 points, or 0.9%, to close at 26,154. The technology-heavy NASDAQ Composite retraced most of last week’s decline by rising 1.4% to close at 8,010. By market cap, large caps outperformed smaller cap indexes with the S&P 500 adding 1.2%, while the mid cap S&P 400 gained 1.0%, and the small cap Russell 2000 rose 0.5%.
International Markets
Canada’s TSX fell for a third consecutive week ending down -0.5%. In Europe, major markets finished in the green. The United Kingdom’s FTSE gained 0.4%, while France’s CAC 40 rose 1.9%, Germany’s DAX gained 1.4%, and Italy’s Milan FTSE added 2.1%.
In Asia, China’s Shanghai Composite fell for a third straight week, down -0.8%. Japan’s Nikkei surged 3.5% following last week’s -2.4% drop while Hong Kong’s Hang Seng added 1.2%. As grouped by Morgan Stanley Capital International, emerging markets finished up 1.0% while developed markets rallied 2.0%.
Commodities
Precious metals finished the week mixed. Gold added just $0.70 to end the week at $1201.10 an ounce, while Silver finished down -0.2% to $14.14 an ounce.
The industrial metal copper, used by analysts as a barometer of global economic health due to its variety of uses, rose 0.9%.
Energy had a strong week with both West Texas Intermediate crude and Brent North Sea crude finishing up. WTIC gained 1.8% ending the week at $68.99 per barrel, while Brent added 1.4% and closed at $78.09 a barrel.
Economic News
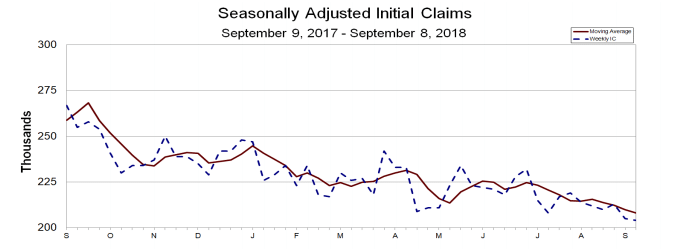
The Labor Department reported initial claims for new unemployment benefits fell 1,000 last week to just 204,000—their lowest level since December of 1969. The rate of layoffs underscores the strength of the U.S. economy and the labor market – the best since at least the turn of the century.
The reading was far below consensus expectations for 210,000 claims. The less-volatile four week average of new claims fell by 2,000 to 208,000—also its lowest level since 1969. Continuing claims, which counts the number of people already collecting unemployment benefits, declined by 15,000 to 1.7 million to hit their lowest level since the end of 1973.
Source: Department of Labor
In the Labor Department’s Job Openings and Labor Turnover Survey (JOLTS) report, the number of job openings climbed to a record high of 6.94 million in July – a clear sign that the economy entered the second half of the year with strong momentum. In addition, the JOLTS report showed a fresh high in quits and new hires indicating more people than ever are confident enough to quit their jobs. The “quits” rate also rose by 106,000 hitting a record of 3.6 million, according to records that go back to 2000.
Professions that registered the biggest gains in job openings were finance and insurance at 46,000 and nondurable goods manufacturing at 32,000. Openings decreased in retail, educational services and the federal government.
Sentiment among the nations’ small business owners climbed to a new record last month on the heels of tax cuts and reduced regulations from President Trump and the Republican-led congress. The National Federation of Independent Business (NFIB) reported that its small-business sentiment index rose 0.9 points to a seasonally-adjusted reading of 108.8. The index recorded advances in six of its ten major components. The previous record was set 35 years ago in 1983 during the second year of Ronald Reagan’s presidency.
In the details of the report, the biggest gain came in plans to increase inventories, while the component with the highest level was job openings with a net 38% reporting improvement. The NFIB stated that both job creation plans and unfilled job openings set new records.
Inflation at the wholesale level fell for the first time in a year and a half last month, declining 0.1%. The Producer Price Index (PPI) for final demand missed economists’ forecasts for a gain of 0.2%. Stripping out the volatile food and energy components, the PPI was still off 0.1%.
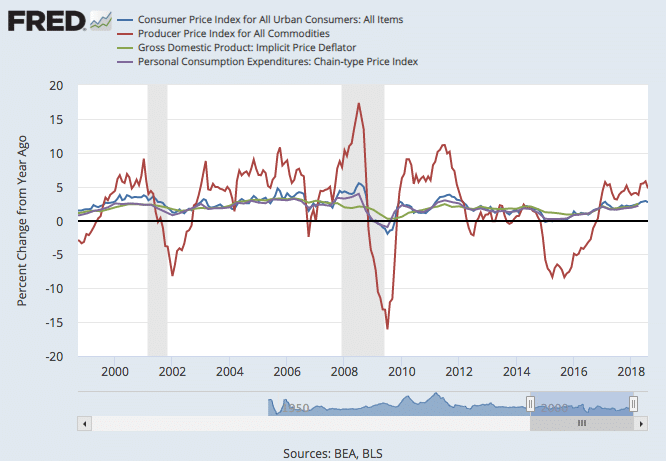
The drop was led by a decline in services producer prices, which fell 0.1%, and a 0.9% decline in trade margins. Transportation and warehousing prices also pulled back which was surprising given that various transportation services reports indicated capacity constraints, especially in trucking. On a year over year basis, the PPI for final demand eased to 2.8%, while its core fell to 2.4% – the slowest pace since January.
At the consumer level, inflation increased 0.2% in August. The reading was below the consensus forecast of 0.3%. The increase was led by a rebound in energy prices which rose 1.9% last month, the most since January. The Core CPI edged up just 0.1%, with notable gains in shelter (+0.3%) and airline fares (+2.4%).
On a year-over-year basis, the CPI eased to 2.7% from 2.9% in the previous month, while core inflation was up 2.2%, down 0.2%. The moderation was broad-based with core commodities prices off 0.2% year-over-year, while core services were down 0.1% to 3.0% year-over-year.
The Fed’s latest “Beige Book”, an anecdotal summary of current economic conditions from each of the Federal Reserve’s districts, indicated that the economy continued to expand at a moderate pace between early July and the end of August, although the pace varied across districts. One district reported “brisk growth”, while three others reported “below average growth”.
Though businesses remained optimistic about the near-term outlook, trade tensions continued to create uncertainty and have caused some capital expenditures to be scaled back or delayed. Tariffs and shortages of skilled workers continued to be the biggest worries for businesses. Still wage growth remained “modest to moderate” as firms tried to use benefits to attract employees. The picture presented is not one of an economy that is in imminent danger of overheating. Scott Brown, chief economist at Raymond James stated, “The report shows….implicitly, no pressing need for the Fed to slam on the brakes.”
U.S. retailers registered their weakest sales in six months last month, but the soft patch was not expected to last. Retail sales rose just 0.1% last month, well below the consensus forecast of 0.4%. Excluding vehicle sales, sales were up 0.3%.
Despite the softness last month, the longer-term trend in retail sales continued to power ahead. On a smoothed year-over-year basis, retail sales were up 6.5%, their fastest pace since December 2011. Discretionary retail sales advanced 5.5% year-over-year, while core sales were up 5.7%. These readings show underlying consumer strength, which is especially positive for the outlook for economic growth as consumer spending accounts for more than two thirds of economic growth.
Confidence among the nation’s consumers regarding the U.S. economy and their own well-being rose toward the end of the summer and hit a nearly 14-year high, according to the University of Michigan. U of M’s consumer sentiment index rose to 100.8 this month, up 4.6 points from August in its preliminary reading.
The reading was its second highest since 2004, trailing only the reading from March of this year. Both current conditions and expectations improved, up 5.8 points and 4.0 points, respectively.
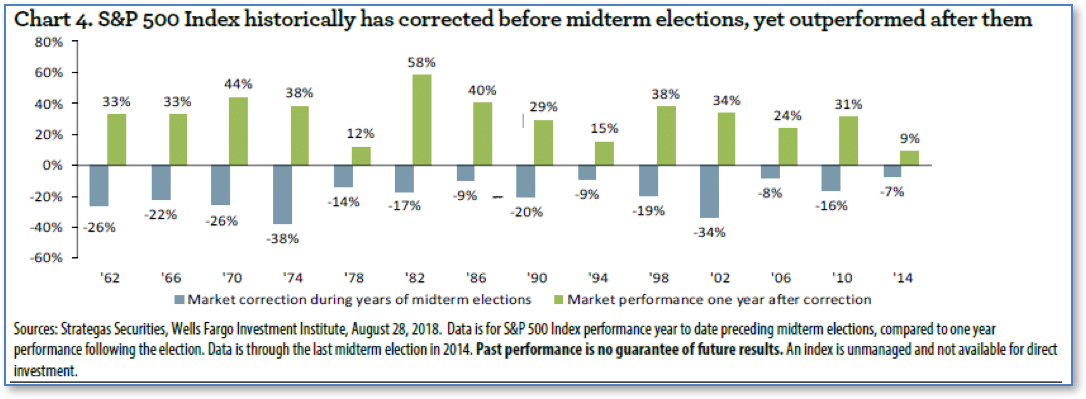
Chart of the Week
With midterm elections less than two months away, a divisive political atmosphere and the aging bull market have investors particularly on edge. The vote to be held on November 6th comes at a time of unusually high political uncertainty with both houses of Congress at stake and key economic issues such as trade and taxes in the balance.
According to the Wells Fargo Investment Institute, the S&P 500 sees an average pullback of nearly 19% in midterm-election years, based on data going back to 1962 (or 14 midterm cycles). However, in the year after the midterms the S&P climbs more than 31%, on average.
Craig Holke, an investment strategy analyst at the Institute writes, “It does not matter which party was in charge before or after the midterm election. The removal of uncertainty and of constant media attention allows markets to resume focusing on fundamentals.”
Riverbend’s Market Indicators
The Big Picture

Fig 1
In the “decades” timeframe, the current Secular Bull Market could turn out to be among the shorter Secular Bull markets on record. This is because of the long-term valuation of the market which, after only eight years, has reached the upper end of its normal range.
The long-term valuation of the market is commonly measured by the Cyclically Adjusted Price to Earnings ratio, or “CAPE”, which smooths out shorter-term earnings swings in order to get a longer-term assessment of market valuation. A CAPE level of 30 is considered to be the upper end of the normal range, and the level at which further PE-ratio expansion comes to a halt (meaning that increases in market prices only occur in a general response to earnings increases, instead of rising “just because”).
Of course, a “mania” could come along and drive prices higher – much higher, even – and for some years to come. Manias occur when valuation no longer seems to matter, and caution is thrown completely to the wind as buyers rush in to buy first and ask questions later.
Two manias in the last century – the 1920’s “Roaring Twenties” and the 1990’s “Tech Bubble” – show that the sky is the limit when common sense is overcome by a blind desire to buy. But, of course, the piper must be paid and the following decade or two are spent in Secular Bear Markets, giving most or all of the mania gains back.
See Fig. 1 for the 100-year view of Secular Bulls and Bears. The CAPE is now at 33.25, up from the prior week’s 33.00, and exceeds the level reached at the pre-crash high in October, 2007. This value is in the lower end of the “mania” range. Since 1881, the average annual return for all ten year periods that began with a CAPE around this level have been in the 0% – 3%/yr. range. (see Fig. 2).

Fig 2
Long Term Indicators
The “big picture” is the months-to-years timeframe – the timeframe in which Cyclical Bulls and Bears operate. The U.S. Bull-Bear Indicator (see Fig. 3) is in Cyclical Bull territory at 76.07, little changed from the prior week’s 76.09.

Fig 3
Intermediate and Short-Term Indicators
The Shorter-term (weeks to months) Indicator (see Fig. 4) turned positive on April 3rd. The indicator ended the week at 26, down from the prior week’s 27. Separately, the Intermediate-term Quarterly Trend Indicator – based on domestic and international stock trend status at the start of each quarter – was positive entering July, indicating positive prospects for equities in the third quarter of 2018.

Fig 4
Indicator Summary
In the Secular (years to decades) timeframe (Figs. 1 & 2), the long-term valuation of the market is simply too high to sustain rip-roaring multi-year returns – but the market has entered the low end of the “mania” range, and all bets are off in a mania. The only thing certain in a mania is that it will end badly…someday.
The Bull-Bear Indicator (months to years) is positive (Fig. 3), indicating a potential uptrend in the longer timeframe.
In the intermediate timeframe, the Quarterly Trend Indicator (months to quarters) is positive for Q3, and the shorter (weeks to months) timeframe (Fig. 4) is positive. Therefore, with all three indicators positive, the U.S. equity markets are rated as Positive.
Institutional Sentiment
The ranking relationship between the defensive SHUT sectors is one way to gauge institutional investor sentiment in the market.
“S”=Staples [a.k.a. consumer non-cyclical]
“H”=Healthcare
“U”=Utilities and
“T”=Telecom
and the offensive DIME sectors:
“D”=Discretionary [a.k.a. Consumer Cyclical]
“I”=Industrial,
“M”=Materials
“E”=Energy
The average ranking of Defensive SHUT sectors rose to 14.50 from last week’s 15.75, while the average ranking of Offensive DIME sectors fell to 16.75 from last week’s 16.25. The Offensive DIME sectors now lag behind the Defensive SHUT sectors by a modest amount.

Note: these are “ranks”, not “scores”, so smaller numbers are higher ranks and larger numbers are lower ranks.
___________________
(sources: all index return data from Yahoo Finance; Reuters, Barron’s, Wall St Journal, Bloomberg.com, ft.com, guggenheimpartners.com, ritholtz.com, markit.com, financialpost.com, Eurostat, Statistics Canada, Yahoo! Finance, stocksandnews.com, marketwatch.com, wantchinatimes.com, BBC, 361capital.com, pensionpartners.com, cnbc.com, FactSet)
© 2018 Riverbend Investment Management, LLC. This presentation is intended for informational purposes only.
The information and statistical data contained herein have been obtained from sources we believe to be reliable but in no way are warranted by us as to accuracy or completeness. The opinions expressed are those of Riverbend Investment Management, LLC. and are subject to change without notice. No part of this presentation may be reproduced in any manner without the written permission of Riverbend Investment Management, LLC. Any securities discussed should not be construed as a recommendation to buy or sell and there is no guarantee that these securities will be held for a client’s account nor should it be assumed that they were or will be profitable. Past performance does not guarantee future comparable results.
Riverbend Investment Management, LLC is a Registered Investment Adviser


