[fusion_builder_container hundred_percent=”no” equal_height_columns=”no” menu_anchor=”” hide_on_mobile=”small-visibility,medium-visibility,large-visibility” class=”” id=”” background_color=”” background_image=”” background_position=”center center” background_repeat=”no-repeat” fade=”no” background_parallax=”none” parallax_speed=”0.3″ video_mp4=”” video_webm=”” video_ogv=”” video_url=”” video_aspect_ratio=”16:9″ video_loop=”yes” video_mute=”yes” overlay_color=”” video_preview_image=”” border_size=”” border_color=”” border_style=”solid” padding_top=”” padding_bottom=”” padding_left=”” padding_right=””][fusion_builder_row][fusion_builder_column type=”1_6″ layout=”1_6″ spacing=”” center_content=”no” link=”” target=”_self” min_height=”” hide_on_mobile=”small-visibility,medium-visibility,large-visibility” class=”” id=”” hover_type=”none” border_size=”0″ border_color=”” border_style=”solid” border_position=”all” box_shadow=”no” box_shadow_blur=”0″ box_shadow_spread=”0″ box_shadow_color=”” box_shadow_style=”” background_type=”single” gradient_start_position=”0″ gradient_end_position=”100″ gradient_type=”linear” radial_direction=”center” linear_angle=”180″ background_color=”” background_image=”” background_image_id=”” background_position=”left top” background_repeat=”no-repeat” background_blend_mode=”none” animation_type=”” animation_direction=”left” animation_speed=”0.3″ animation_offset=”” filter_type=”regular” filter_hue=”0″ filter_saturation=”100″ filter_brightness=”100″ filter_contrast=”100″ filter_invert=”0″ filter_sepia=”0″ filter_opacity=”100″ filter_blur=”0″ filter_hue_hover=”0″ filter_saturation_hover=”100″ filter_brightness_hover=”100″ filter_contrast_hover=”100″ filter_invert_hover=”0″ filter_sepia_hover=”0″ filter_opacity_hover=”100″ filter_blur_hover=”0″ last=”no”][/fusion_builder_column][fusion_builder_column type=”2_3″ layout=”1_1″ background_position=”left top” background_color=”” border_size=”” border_color=”” border_style=”solid” border_position=”all” spacing=”yes” background_image=”” background_repeat=”no-repeat” padding_top=”” padding_right=”” padding_bottom=”” padding_left=”” margin_top=”0px” margin_bottom=”0px” class=”” id=”” animation_type=”” animation_speed=”0.3″ animation_direction=”left” hide_on_mobile=”small-visibility,medium-visibility,large-visibility” center_content=”no” last=”no” min_height=”” hover_type=”none” link=””][fusion_text]
[fusion_vimeo id=”527851186″ alignment=”center” width=”1000″ height=”” autoplay=”false” api_params=”” hide_on_mobile=”small-visibility,medium-visibility,large-visibility” class=”” css_id=””][/fusion_vimeo]
U.S. Markets: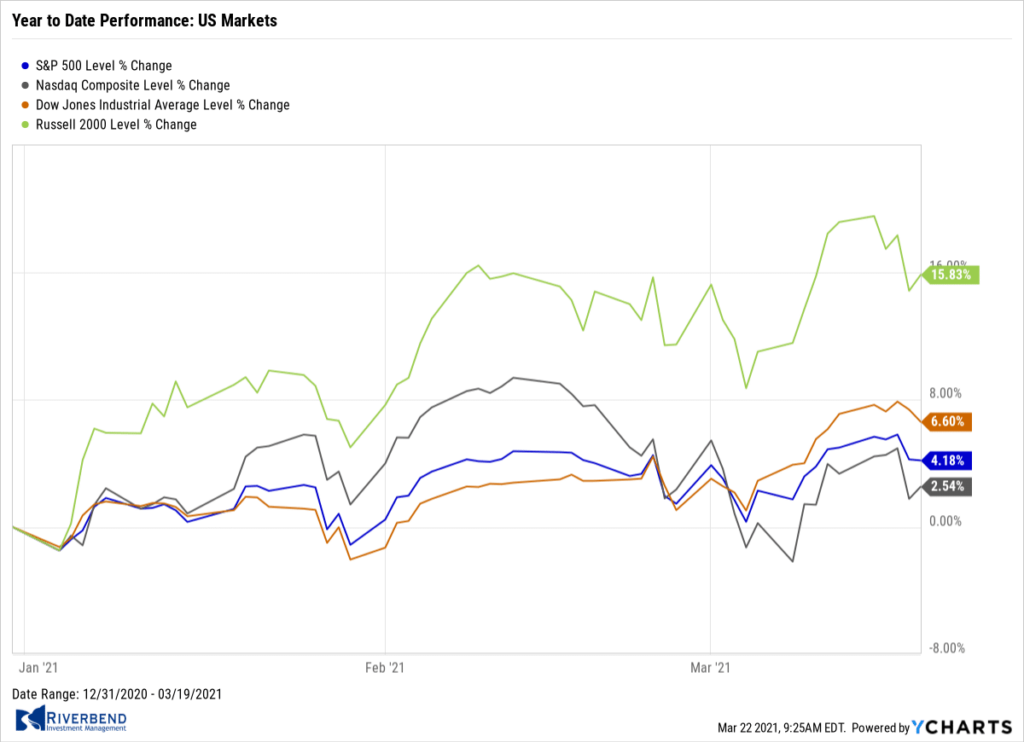
The major indexes continued to hit record highs early in the week, but lost ground as bond yields reached their highest levels in over a year. The Dow Jones Industrial Average shed 150 points finishing the week at 32,627—a decline of -0.5%. The technology-heavy NASDAQ Composite declined a slightly steeper -0.8%. By market cap, the large cap S&P 500 retreated -0.8%, while the S&P 400 mid cap index and Russell 2000 small cap index declined -1.2% and -2.8%, respectively.
International Markets: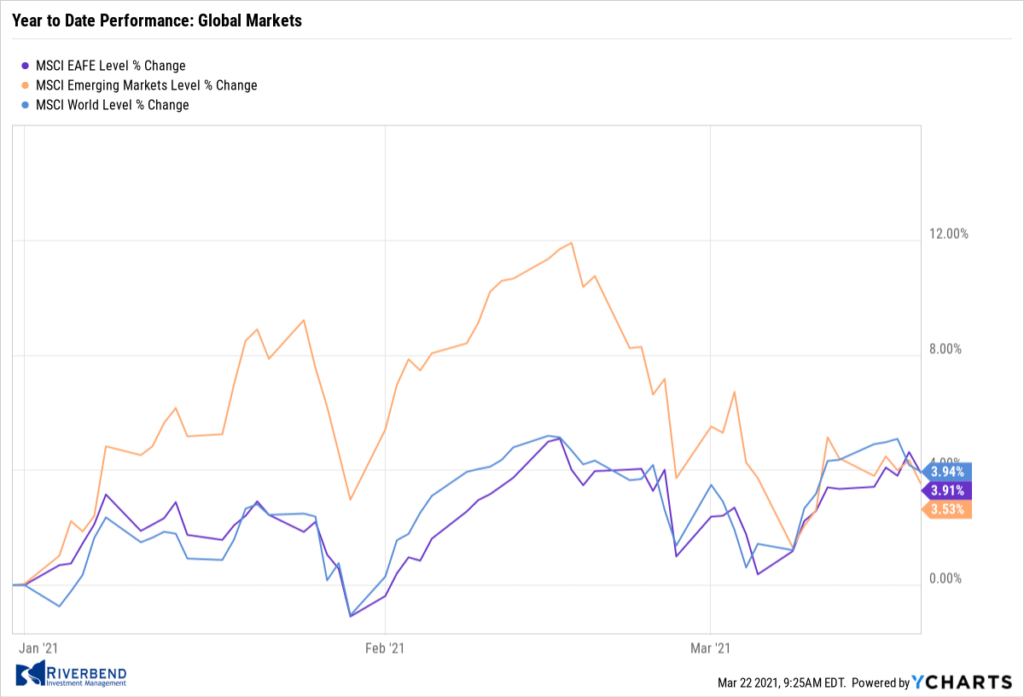
International equity markets were mixed for the week. Canada’s TSX ended the week essentially flat, while the United Kingdom’s FTSE 100 ended down -0.8%. On Europe’s mainland, France’s CAC 40 also finished down -0.8%, while Germany’s DAX rose 0.8%. In Asia, China’s Shanghai Composite fell for a fourth consecutive week giving up -1.4%. Japan’s Nikkei ticked up 0.2%. As grouped by Morgan Stanley Capital International, developed markets and emerging markets each added 0.2%.
Commodities: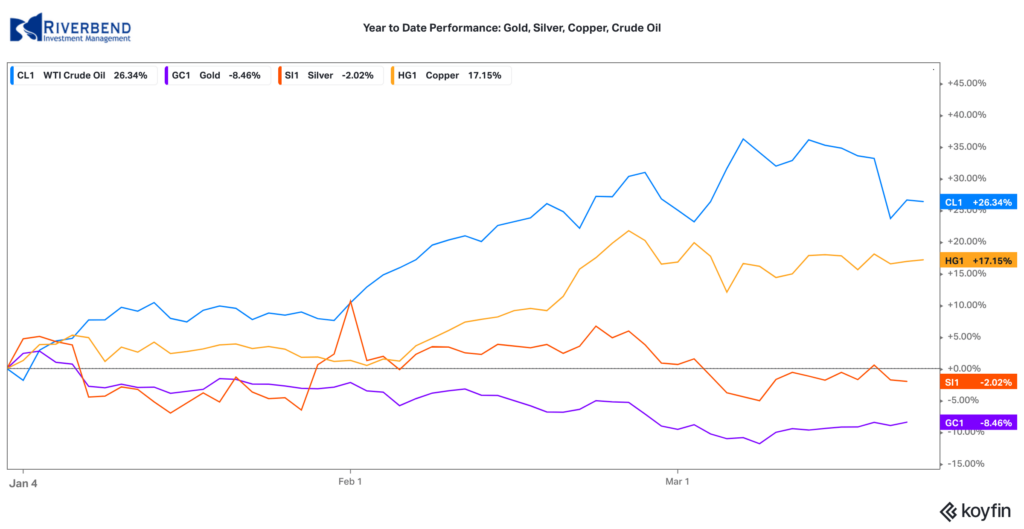
Precious metals had a second consecutive week of gains with Gold rising 1.3% to $1741.70 per ounce and Silver adding 1.6% to $26.32 per ounce. Crude oil declined for a second week. West Texas Intermediate crude oil retreated -6.4% to $61.44 per barrel. The industrial metal copper, viewed by some analysts as a barometer of global economic health due to its wide variety of uses, finished down -0.7%.
U.S. Economic News: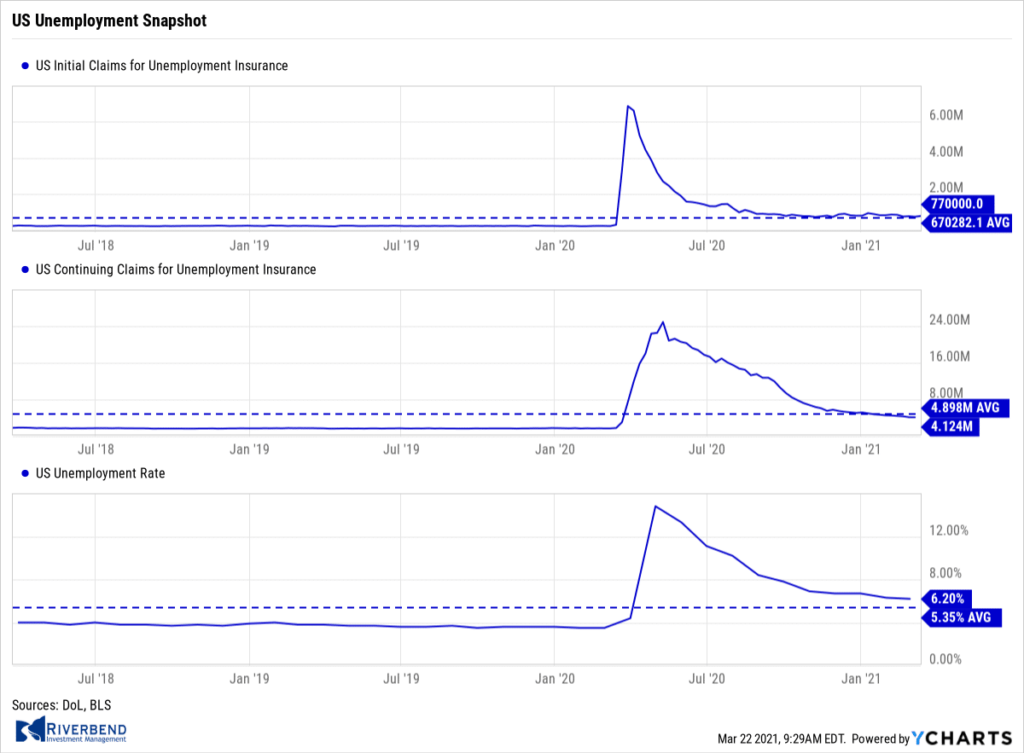
The number of Americans filing first-time unemployment benefits rose to a one-month high last week, according to the Labor Department. Initial jobless claims increased by 45,000 to 770,000 in the week ended March 13. Economists had forecast new claims would fall to a seasonally-adjusted 700,000. Combined state and federal jobless claims totaled 1.02 million last week. They’ve yet to fall below 1 million since the onset of the pandemic last year, underscoring the massive damage to the U.S. economy caused by the coronavirus. The number of people already collecting traditional unemployment benefits, meanwhile, slipped a mild 18,000 to a seasonally adjusted 4.12 million. That’s the lowest level since last spring.
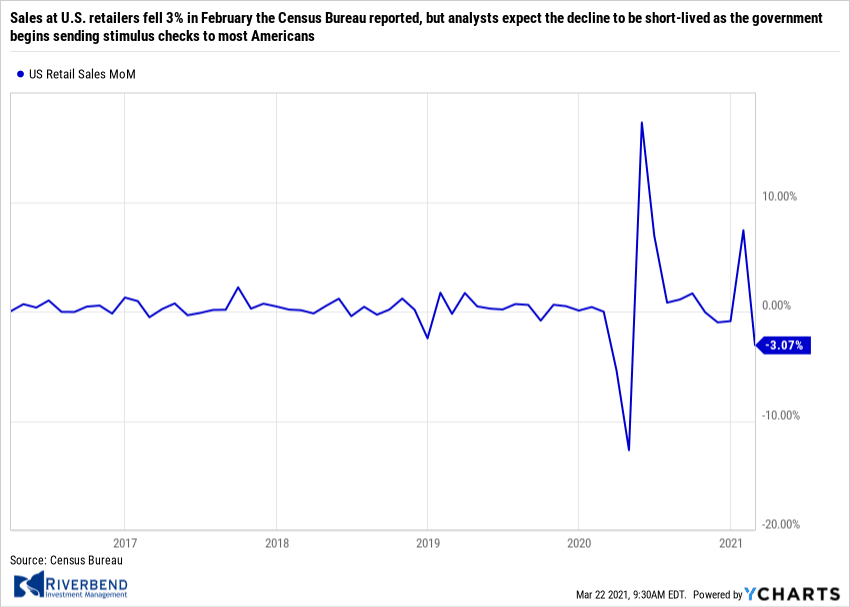 Sales at U.S. retailers fell 3% in February the Census Bureau reported, but analysts expect the decline to be short-lived as the government begins sending stimulus checks to most Americans. Economists had forecast a small decline of just -0.1% in retail sales. In the report, sales fell in every major retail group except for groceries and gasoline, two major household staples. Sales at gas stations climbed 3.6% last month, largely due to higher prices at the pump. U.S. economist Andrew Hunter of Capital Economics wrote in a note, “With the next round of even larger stimulus checks already being sent out, we expect spending to see a renewed surge in March.”
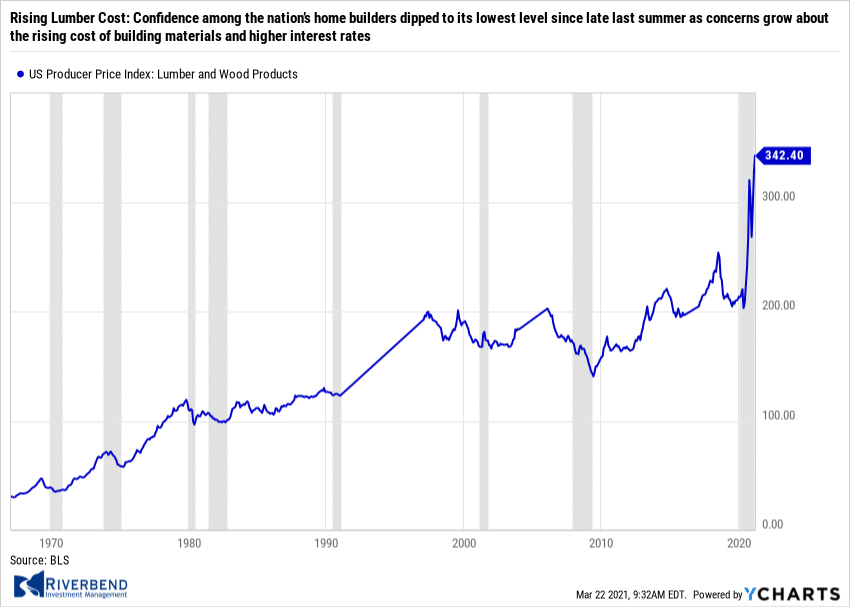 Confidence among the nation’s home builders dipped to its lowest level since late last summer as concerns grow about the rising cost of building materials and higher interest rates. The National Association of Home Builders (NAHB) reported its monthly confidence index dropped two points to 82 in March—its lowest reading since August. Robert Dietz, chief economist at the NAHB said in the report, “Builder confidence peaked at a level of 90 last November and has trended lower as supply-side and demand-side factors have trimmed housing affordability.” Sentiment declined across most parts of the country. The index fell in the West, Midwest, and Northeast, but remained flat in the South.
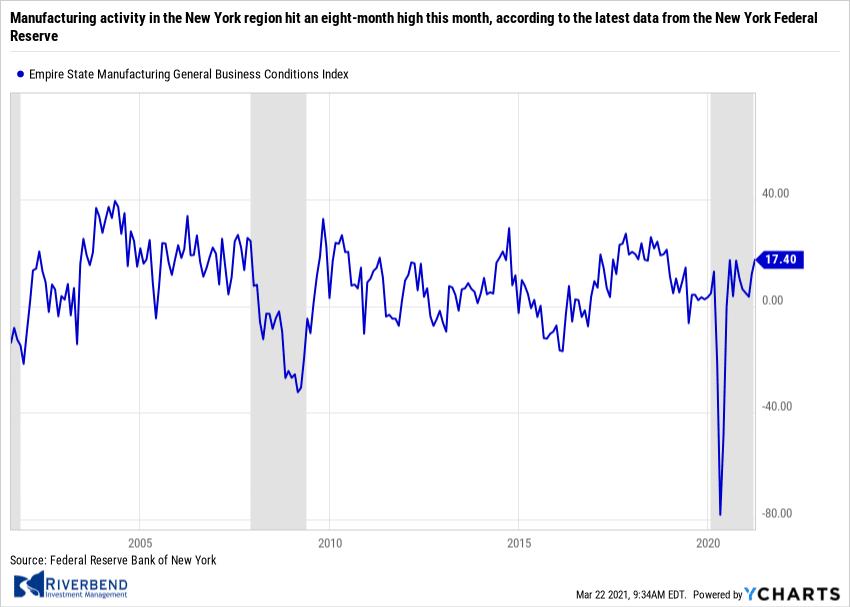 Manufacturing activity in the New York region hit an eight-month high this month, according to the latest data from the New York Federal Reserve. The New York Fed reported its Empire State Manufacturing Index rose 5.3 points to a reading of 17.4 in March. The result beat the consensus forecast of 15. The index sits at its highest level since last July and recorded its ninth consecutive reading above zero. In the details, the new orders index slipped 1.7 points to 9.1, while shipments surged 17.1 points to 21.2. Of note, the prices paid index rose 6.6 points to 64.4 in March—its second consecutive month of hitting a 10-year high.
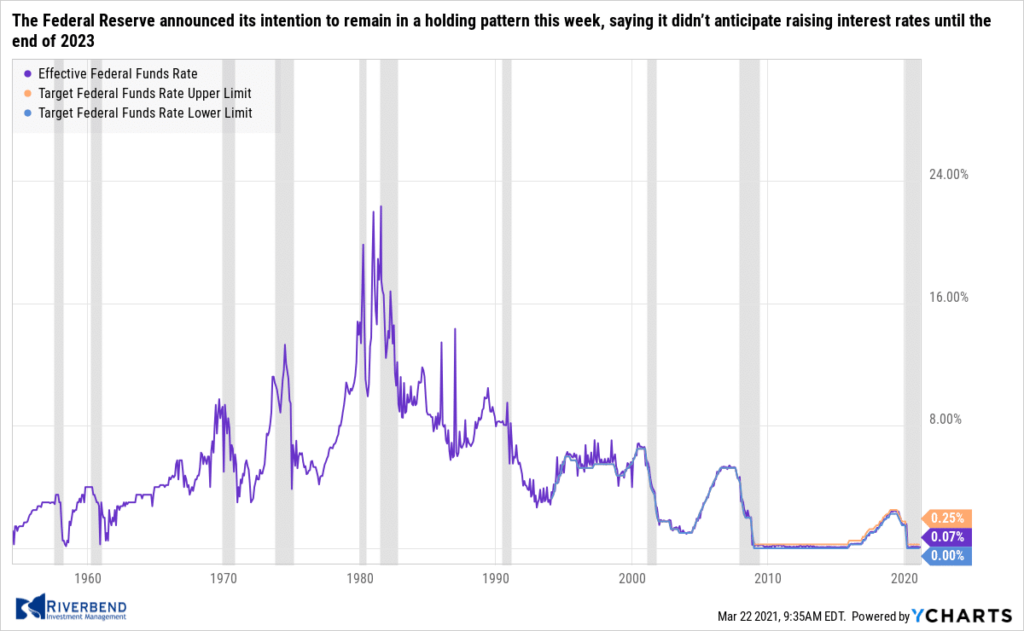 The Federal Reserve announced its intention to remain in a holding pattern this week, saying it didn’t anticipate raising interest rates until the end of 2023—despite signs of stronger economic growth and a pick-up in inflation. In its forecasts, the Fed sees GDP growth this year of 6.5% annual rate and said core inflation would rise slightly above its 2% target. In its assessment of appropriate monetary policy, seven of 18 Fed officials have penciled in a rate hike in 2023, up from 5 at the last “dot-plot” in December. Four officials expect a rate hike in 2022, up from one member in the December forecast. The Fed projections see inflation slowing to 2% in 2022 before picking up slightly to 2.1% in 2023. The central bank has said it will tolerate inflation slightly above target to make up for the years inflation has been below 2%.
Chart of the Week: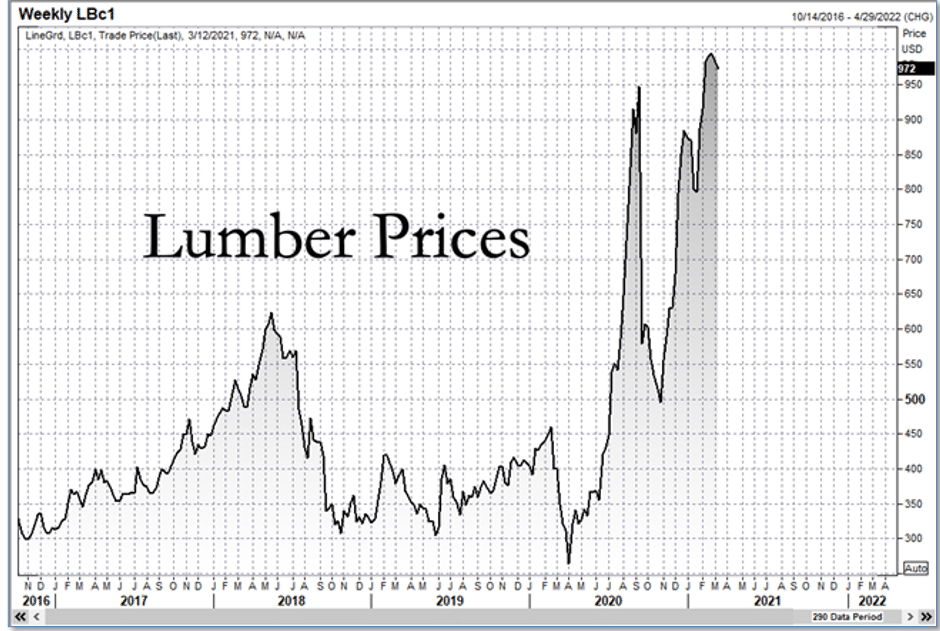
If you are in the market for a new home, you may want to close the deal sooner rather than later. Construction costs are soaring and appear only to be going higher. Lumber prices hit $1000 per thousand board feet, an all-time high in recent weeks, and has risen more than 300% since the pandemic low last spring.
Paul Jannke, Forest Economic Advisors LLC.’s principal of lumber said, “Production is going to have a hard time keeping up with demand growth as the world economy bounces back from Covid-19 in 2021-22.” So how much are these rising costs adding to a new home’s construction cost? The National Association of Home Builders estimates rising lumber prices have added a stunning $24,400 to the cost of a home over the past ten months. Now don’t forget to add in the rising price of copper, which has gone up 87% in the trailing year…well, you get the picture. (Chart from zerohedge.com)
The Week Ahead:
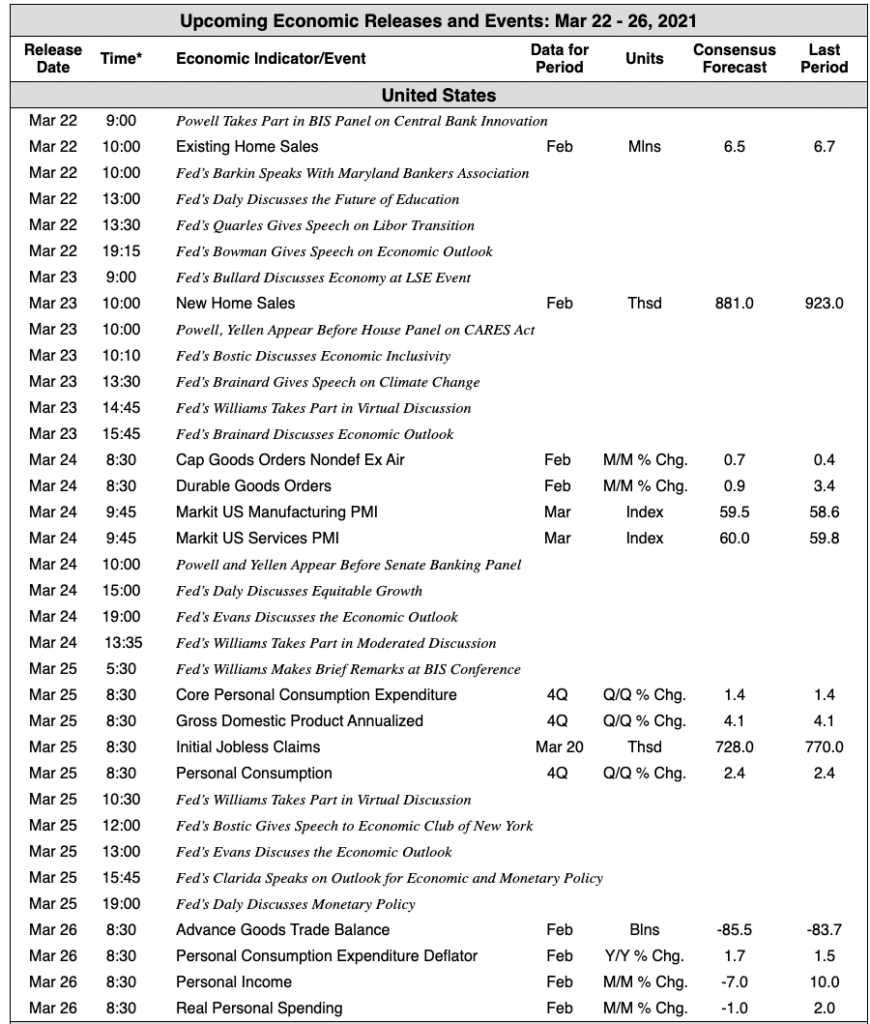
Source: Bloomberg, TD Economics
(Sources: All index- and returns-data from Yahoo Finance; news from Reuters, Barron’s, Wall St. Journal, Bloomberg.com, ft.com, guggenheimpartners.com, zerohedge.com, ritholtz.com, markit.com, financialpost.com, Eurostat, Statistics Canada, Yahoo! Finance, stocksandnews.com, marketwatch.com, wantchinatimes.com, BBC, 361capital.com, pensionpartners.com, cnbc.com, FactSet.)
[/fusion_text][/fusion_builder_column][fusion_builder_column type=”1_6″ layout=”1_6″ spacing=”” center_content=”no” link=”” target=”_self” min_height=”” hide_on_mobile=”small-visibility,medium-visibility,large-visibility” class=”” id=”” hover_type=”none” border_size=”0″ border_color=”” border_style=”solid” border_position=”all” border_radius=”” box_shadow=”no” dimension_box_shadow=”” box_shadow_blur=”0″ box_shadow_spread=”0″ box_shadow_color=”” box_shadow_style=”” padding_top=”” padding_right=”” padding_bottom=”” padding_left=”” margin_top=”” margin_bottom=”” background_type=”single” gradient_start_color=”” gradient_end_color=”” gradient_start_position=”0″ gradient_end_position=”100″ gradient_type=”linear” radial_direction=”center” linear_angle=”180″ background_color=”” background_image=”” background_image_id=”” background_position=”left top” background_repeat=”no-repeat” background_blend_mode=”none” animation_type=”” animation_direction=”left” animation_speed=”0.3″ animation_offset=”” filter_type=”regular” filter_hue=”0″ filter_saturation=”100″ filter_brightness=”100″ filter_contrast=”100″ filter_invert=”0″ filter_sepia=”0″ filter_opacity=”100″ filter_blur=”0″ filter_hue_hover=”0″ filter_saturation_hover=”100″ filter_brightness_hover=”100″ filter_contrast_hover=”100″ filter_invert_hover=”0″ filter_sepia_hover=”0″ filter_opacity_hover=”100″ filter_blur_hover=”0″ last=”no”][/fusion_builder_column][/fusion_builder_row][/fusion_builder_container]


