[fusion_builder_container hundred_percent=”no” equal_height_columns=”no” menu_anchor=”” hide_on_mobile=”small-visibility,medium-visibility,large-visibility” class=”” id=”” background_color=”” background_image=”” background_position=”center center” background_repeat=”no-repeat” fade=”no” background_parallax=”none” parallax_speed=”0.3″ video_mp4=”” video_webm=”” video_ogv=”” video_url=”” video_aspect_ratio=”16:9″ video_loop=”yes” video_mute=”yes” overlay_color=”” video_preview_image=”” border_size=”” border_color=”” border_style=”solid” padding_top=”” padding_bottom=”” padding_left=”” padding_right=””][fusion_builder_row][fusion_builder_column type=”1_1″ layout=”1_1″ background_position=”left top” background_color=”” border_size=”” border_color=”” border_style=”solid” border_position=”all” spacing=”yes” background_image=”” background_repeat=”no-repeat” padding_top=”” padding_right=”” padding_bottom=”” padding_left=”” margin_top=”0px” margin_bottom=”0px” class=”” id=”” animation_type=”” animation_speed=”0.3″ animation_direction=”left” hide_on_mobile=”small-visibility,medium-visibility,large-visibility” center_content=”no” last=”no” min_height=”” hover_type=”none” link=””][fusion_text]
Since its mid-March lows, the S&P 500 index has provided traders with a nice short-term rally. But for longer-term investors, the big question facing them is, “is it safe to get back in?”
To decide that, let’s take a look at the good, the bad, and the ugly to see which way the weight of the evidence lies.
To start let’s look at the positives:
The S&P 500 has managed to trade above its downward trendline – and we’ve seen numerous short-term buy signals triggered over the past two weeks as traders took advantage of short-term oversold signals: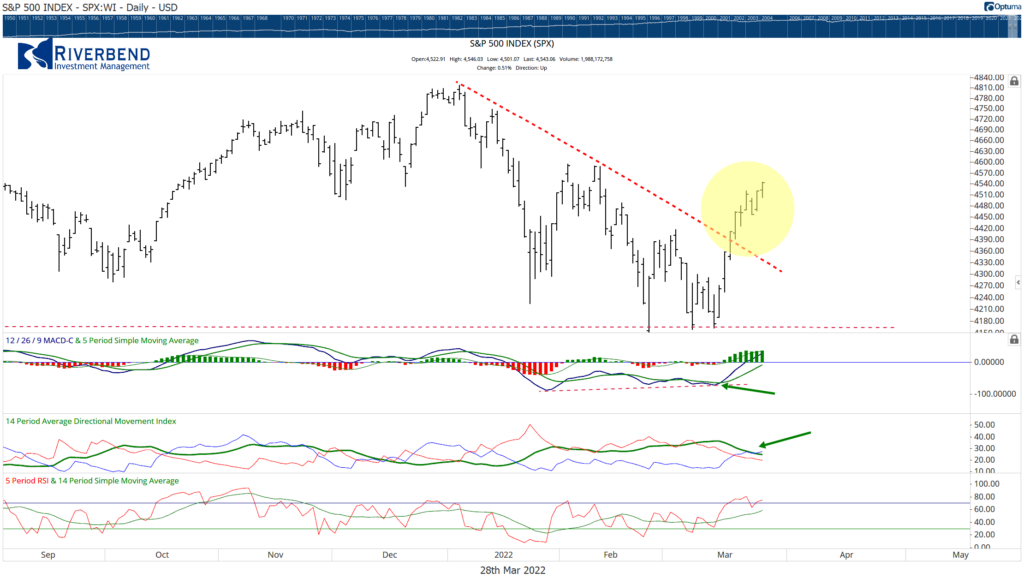
Short Term Negative:
The market is now testing previous levels of resistance. Short-term traders and computer-driven trading programs will typically use these levels as potential targets.
Watching these areas can provide us with an indication of whether this rally is being driven by short-term traders who were buying an oversold market — or if long-term investors are starting to view the market in a more positive light.
We may see the market stall at these levels, but if we can trade above them it will be an enormous positive for the longer-term investors and may signal that investors are feeling OK with the Fed’s (now more aggressive) plan to raise rates and attack inflation.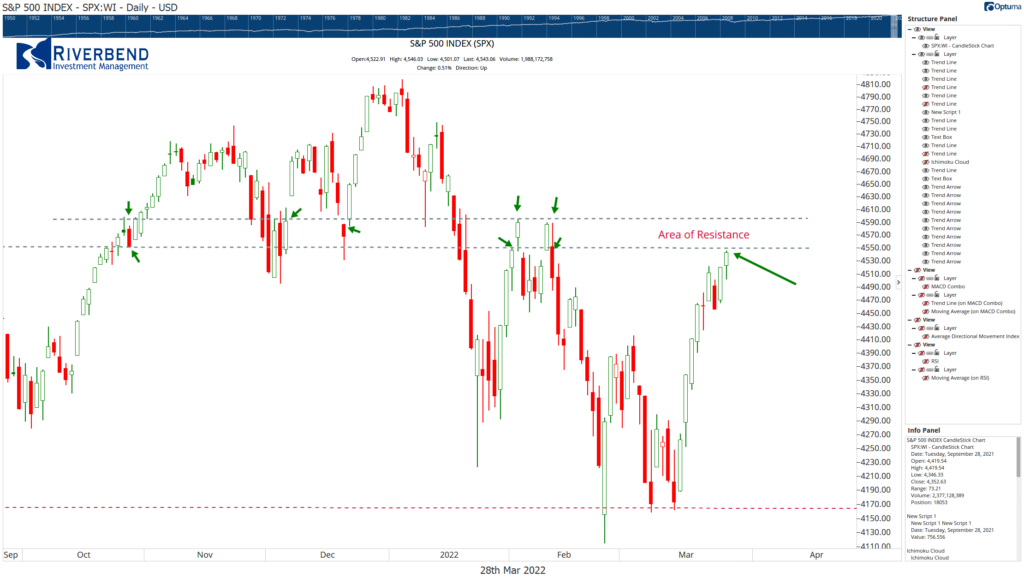
Potential Long Term Negatives:
One area to be aware of is the forming MACD sell signal on the monthly chart of the S&P 500. When we see a monthly sell signal, it can indicate that we are in for a longer period of market turmoil.
While no signal is 100% correct all the time, it is something to keep an eye on.
Already we are seeing strength in defensive names, such as Utilities. Defensive names may take over market leadership and provide us with tradable opportunities in a market if leadership names, such as Technology, drive the overall market lower.
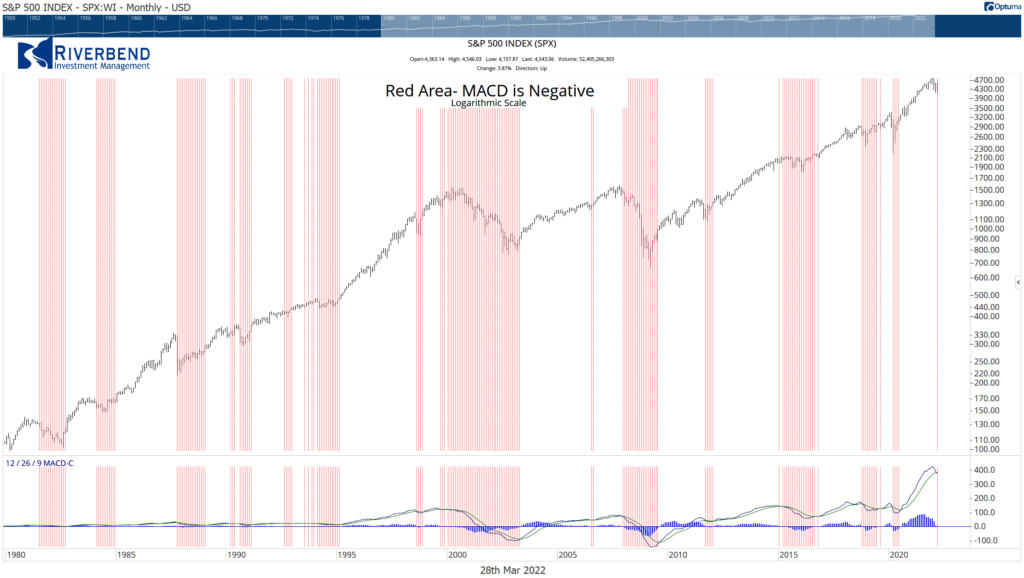
Chart of the Week:
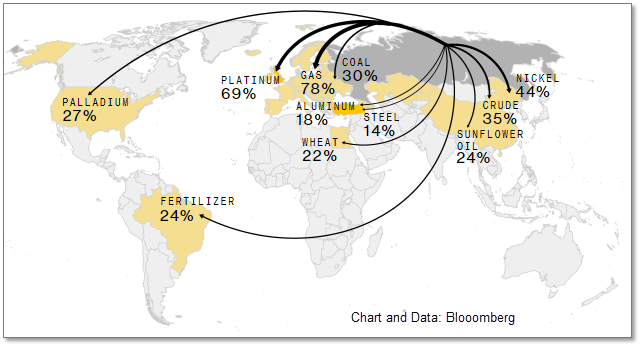
It wasn’t widely known to the general public before recent days, but Russia is one of the world’s largest producers of many of the commodities necessary for modern society.
Inflation was already on the rise, but since Russia’s invasion of Ukraine, the price of gasoline has soared. That’s because Russia is the second-largest crude oil exporter globally, only behind Saudi Arabia.
Russia also happens to be the world’s largest exporter of natural gas, with most of that going to Europe through pipelines (and Russia’s exports of natural gas are almost triple U.S. exports of natural gas).
When it comes to agriculture, Russia is a top supplier of the world’s fertilizer, its wheat is exported globally, and it is the world’s second-biggest shipper of sunflower oil.
In addition, Russia is a key supplier of industrial metals. China, Europe, and the U.S. are the largest buyers of Russian nickel—a critical metal for electric car batteries.
The ripple effects are felt at the gas station and the grocery store as well as in unexpected ways – for example, Tesla has raised its car prices twice in just the last few weeks because of soaring nickel prices.
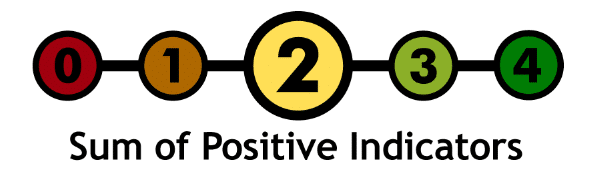
Riverbend Indicators:
- As a reading of our Bull-Bear Indicator for U.S. Equities (comparative measurements over a rolling one-year timeframe), we remain in Cyclical Bull territory.
- Counting up of the number of all our indicators that are ‘Up’ for U.S. Equities, the current tally is that two of four are Positive, representing a multitude of timeframes (two that can be solely days/weeks, or months+ at a time; another, a quarter at a time; and lastly, the {typically} years-long reading, that being the Cyclical Bull or Bear status).
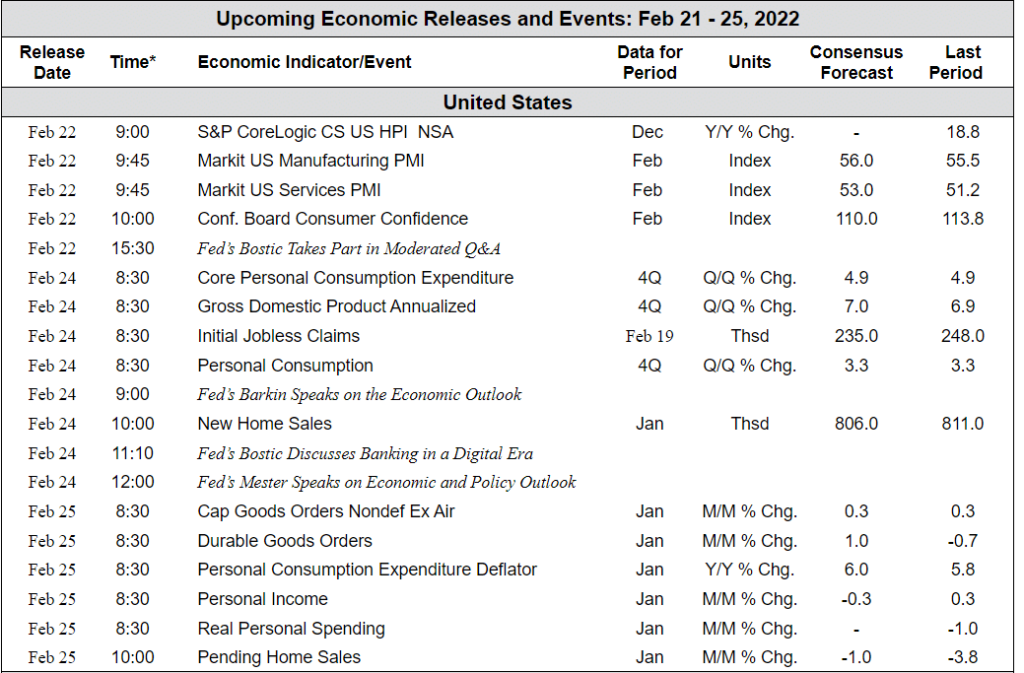
The Week Ahead:
[/fusion_text][/fusion_builder_column][/fusion_builder_row][/fusion_builder_container]


