After much anticipation, the Fed has announced that it will begin reducing its monthly asset purchases. Investors have spent months wondering when this process would start given the strong recovery and ongoing market rally.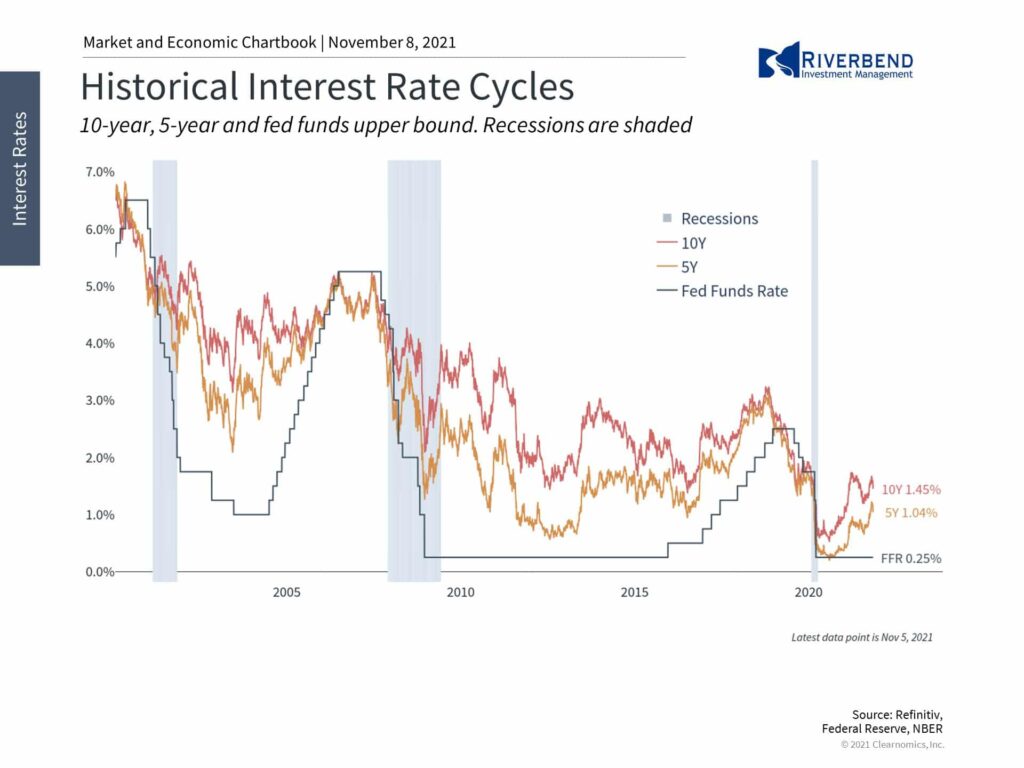
While markets have been taking this in stride, some investors are understandably nervous about what this may mean for their portfolios. Uncertainty around Fed policy is one reason investors ought to maintain a long-term perspective on their investments and financial goals.
Topics like Fed tapering, rate hikes, the Phillips curve and others can seem complex, but it’s important to separate the how from the why.
Mechanically, the Fed’s tapering process is simply the first step toward returning to a more “normal” monetary policy. It begins to slow the purchases of Treasury and mortgage-backed securities that began last year as part of the Fed’s emergency response to the pandemic, based on its 2008 financial crisis playbook.
The pace of $120 billion per month has caused the Fed’s balance sheet to balloon to over $8.6 trillion – significantly larger than the pre-pandemic peak of $4.5 trillion. By reducing these purchases each month beginning in November, the Fed would still be buying bonds through May 2022.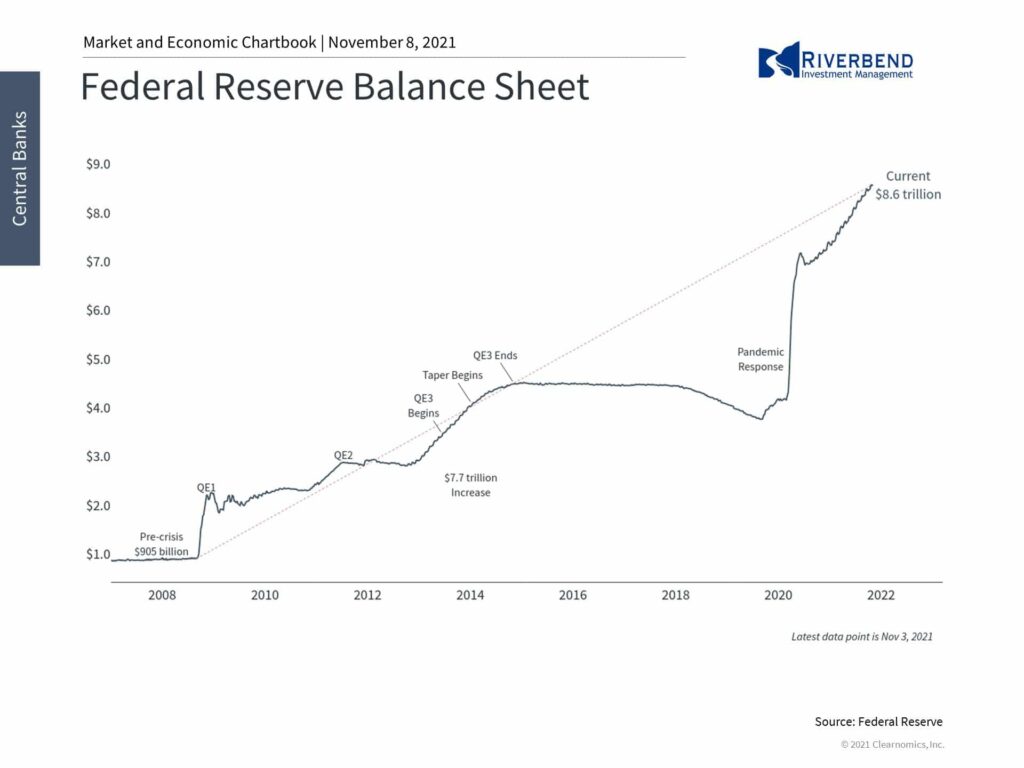
This would add up to $420 billion which would push its balance sheet above $9 trillion.
It’s important to underscore the fact that the Fed is still buying assets, just at a slower pace. Shrinking its holdings may not happen until much later. After tapering began in 2014, the balance sheet did not begin to shrink until 2018.
While the how is quite involved, the motivation for the tapering process is simple: the Fed is refilling the punch bowl at a slower pace before it removes it altogether.
This makes sense at a time when emergency stimulus is no longer needed and when monetary policy is arguably playing a smaller role. After all, inflation is rising not necessarily because Fed policy is too loose, but because of strong demand and supply disruptions. The Fed has made it clear that they have little control over these factors.
At the same time, it could still be considered a policy mistake for the Fed to keep financial conditions too easy for too long as inflation heats up, even if they can’t directly control the underlying causes. This is especially true at a time when consumers and markets are beginning to expect higher short- and medium-term inflation.
 The classic runaway inflation scenarios, such as a wage-price spiral, involve an ever-higher expectation of inflation which can become a self-fulfilling prophecy. To stop this, the Fed would have to take dramatic steps.
Thus, there are conflicting fears among investors around a) the Fed normalizing then tightening policy, and b) the Fed not tightening enough to combat inflation.
Fortunately, the market has taken the shift in Fed policy in stride so far, and history supports this.
After endless concerns and some market volatility in 2013, financial markets performed well the rest of the cycle. This occurred despite not only tapering but a shrinking Fed balance sheet and several rate hikes. Ultimately, it was the strong underlying trends in the economy that mattered most.
Similarly, while there are concerns building within the market as the “everything rally” continues, it’s unlikely that reduced bond purchases or a few rate hikes will be what derail current trends. Instead, all market cycles have their ups and downs related to growth, profits, interest rates and valuations. Focusing on these factors instead can shed more light on the state of the market than focusing on the Fed alone.
Chart of the Week: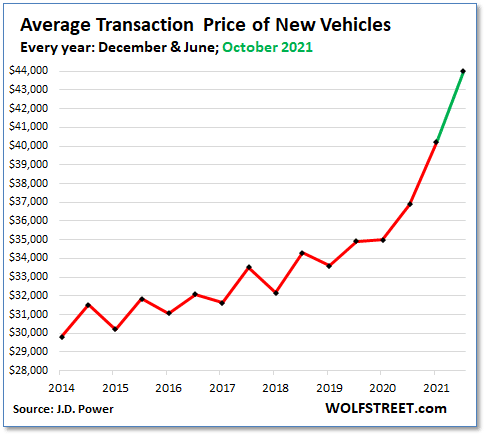
The average price of a new vehicle has spiked about 25% since the start of the pandemic, from about $35,000 to a whopping $44,000, according to auto data firm J.D. Power.
Shortages of key materials, such as semiconductors, have not only limited the number of vehicles being produced, but also incentivized automakers to build only the most expensive, highest-trim versions of their vehicles.
The result: automakers and dealers are making enormous amounts of gross profits per vehicle sold in their showrooms in a “take or leave it” scenario.
In October, dealers made on average $5,129 per unit in gross profit, including contributions from finance and insurance (F&I) sales, smashing the prior record and up an amazing 75% from the same time last year.
Riverbend Indicators:

Each week we post notable changes to the various market indicators we follow.
- As a reading of our Bull-Bear Indicator for U.S. Equities (comparative measurements over a rolling one-year timeframe), we remain in Cyclical Bull territory.
- Counting up of the number of all our indicators that are ‘Up’ for U.S. Equities, the current tally is that four of four are Positive, representing a multitude of timeframes (two that can be solely days/weeks, or months+ at a time; another, a quarter at a time; and lastly, the {typically} years-long reading, that being the Cyclical Bull or Bear status).
The Week Ahead: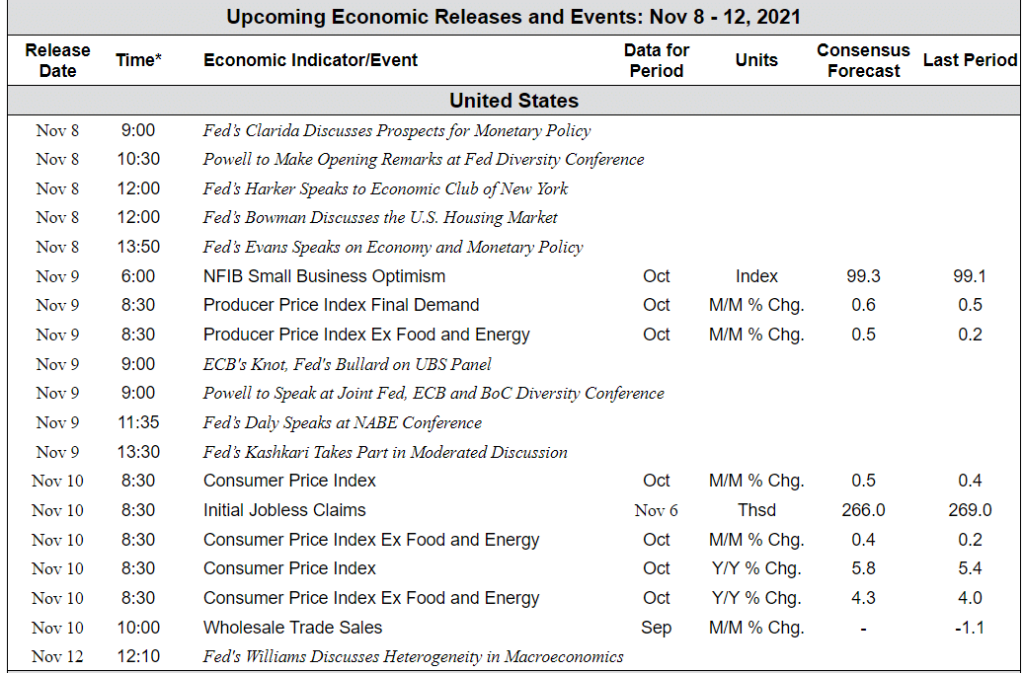
*Eastern Standard Time. Source: Bloomberg, TD Economics


