[fusion_builder_container hundred_percent=”no” equal_height_columns=”no” menu_anchor=”” hide_on_mobile=”small-visibility,medium-visibility,large-visibility” class=”” id=”” background_color=”” background_image=”” background_position=”center center” background_repeat=”no-repeat” fade=”no” background_parallax=”none” parallax_speed=”0.3″ video_mp4=”” video_webm=”” video_ogv=”” video_url=”” video_aspect_ratio=”16:9″ video_loop=”yes” video_mute=”yes” overlay_color=”” video_preview_image=”” border_size=”” border_color=”” border_style=”solid” padding_top=”” padding_bottom=”” padding_left=”” padding_right=””][fusion_builder_row][fusion_builder_column type=”1_1″ layout=”1_1″ background_position=”left top” background_color=”” border_size=”” border_color=”” border_style=”solid” border_position=”all” spacing=”yes” background_image=”” background_repeat=”no-repeat” padding_top=”” padding_right=”” padding_bottom=”” padding_left=”” margin_top=”0px” margin_bottom=”0px” class=”” id=”” animation_type=”” animation_speed=”0.3″ animation_direction=”left” hide_on_mobile=”small-visibility,medium-visibility,large-visibility” center_content=”no” last=”no” min_height=”” hover_type=”none” link=””][fusion_text]
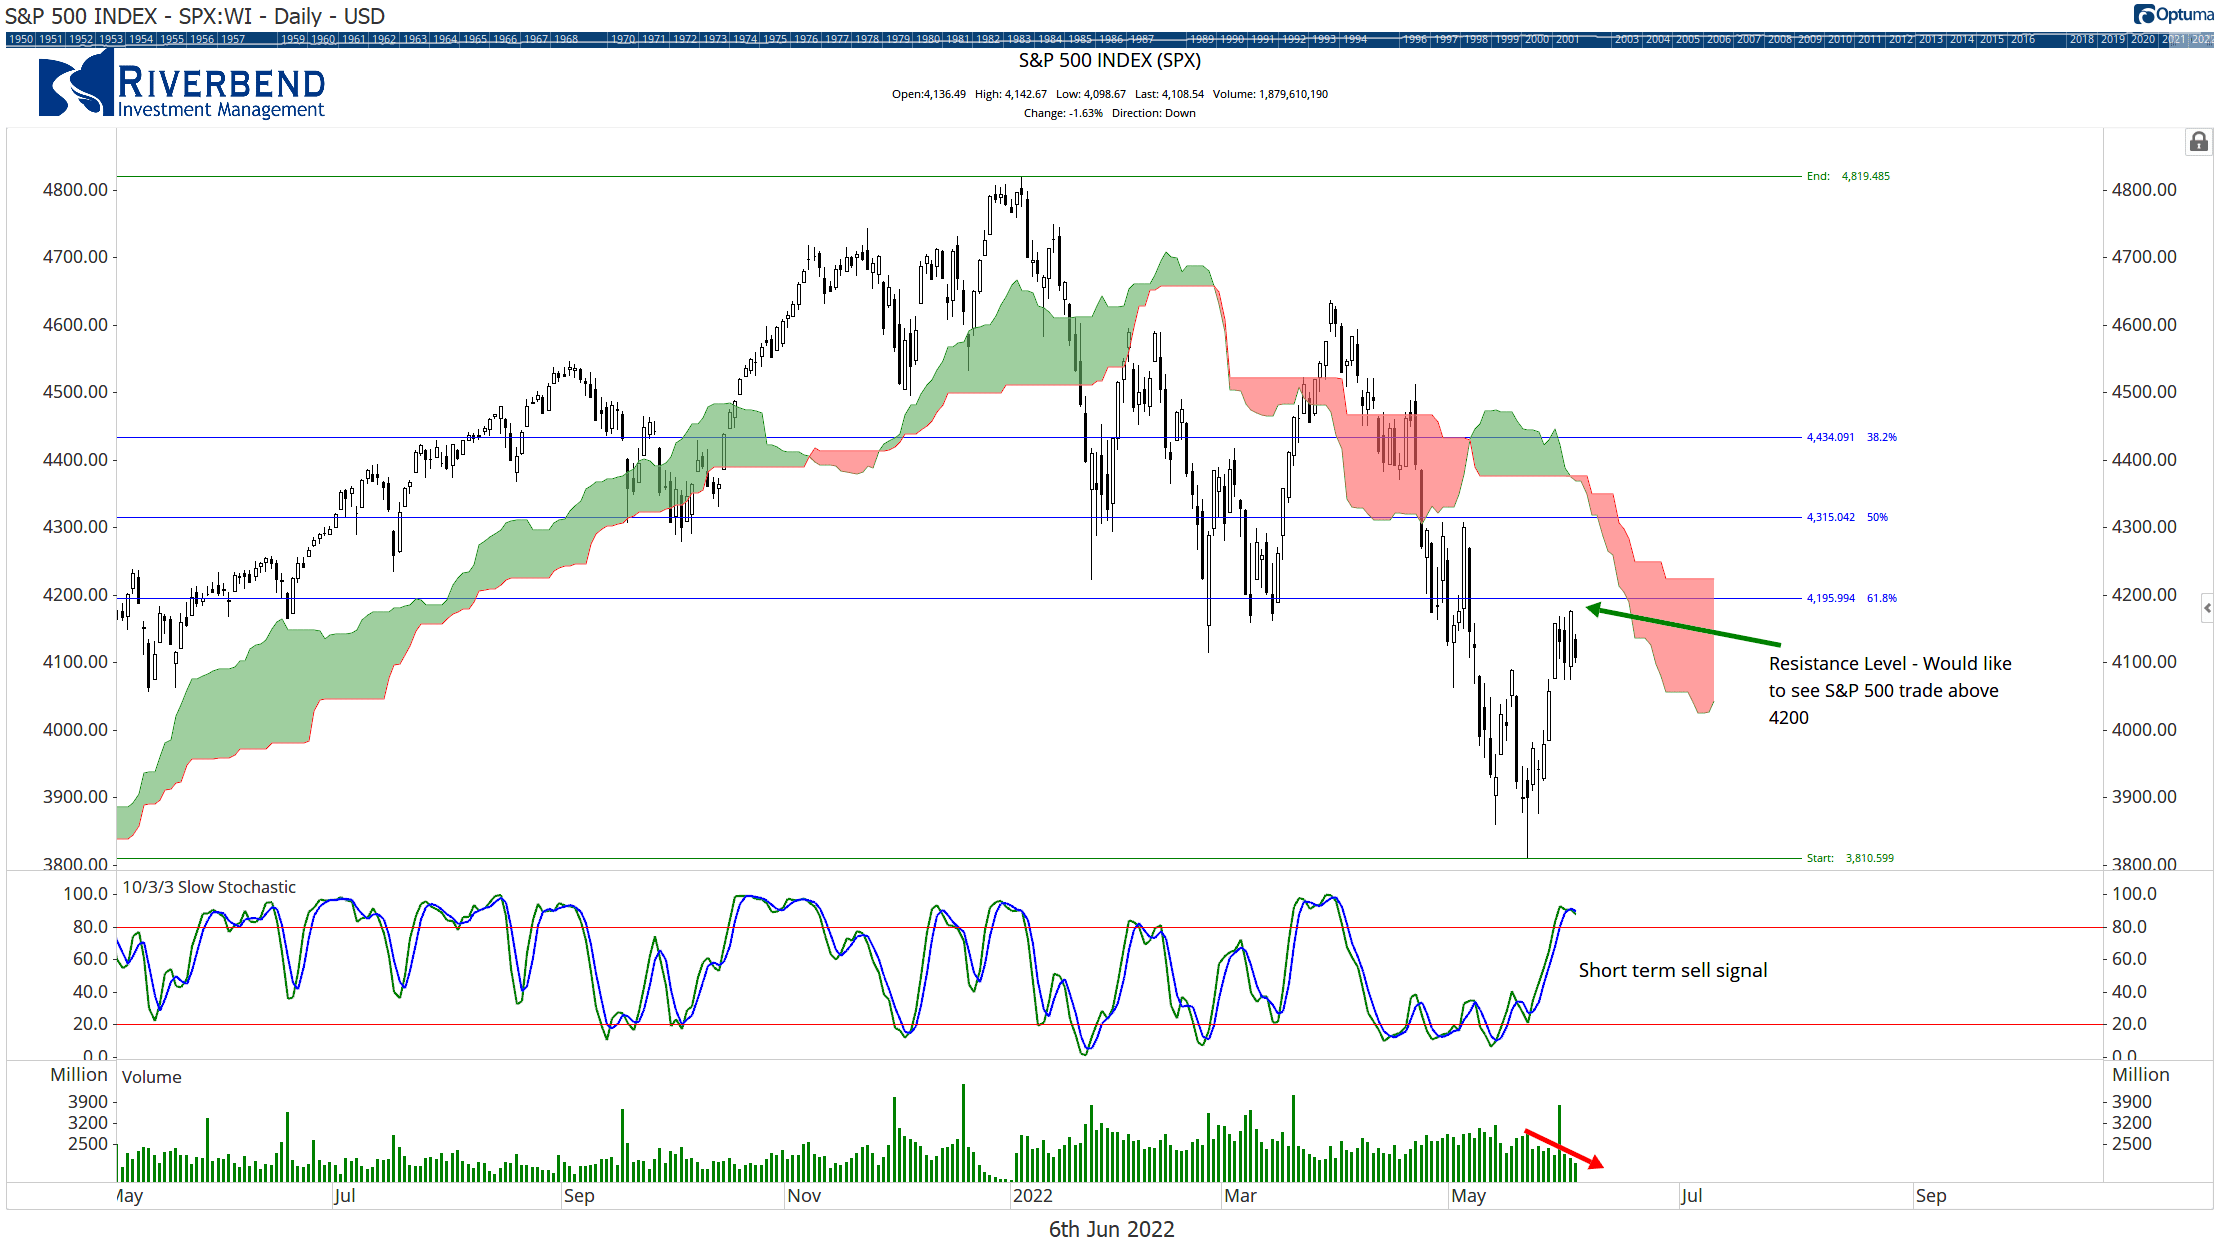
The US equity markets seem to be stuck in a bit of a sideways and choppy trading pattern. The S&P 500 index is trading near resistance levels, and traders seem to be proceeding with caution.
Typically, when the market looks to reverse a major trend, we see the market trade higher/lower with increasing trading volume.
When the market is in a shorter, counter-trend rally, we typically see less trading volume.
Which is exactly what we are seeing right now. The market rose higher after being short-term oversold and is now struggling to break higher.
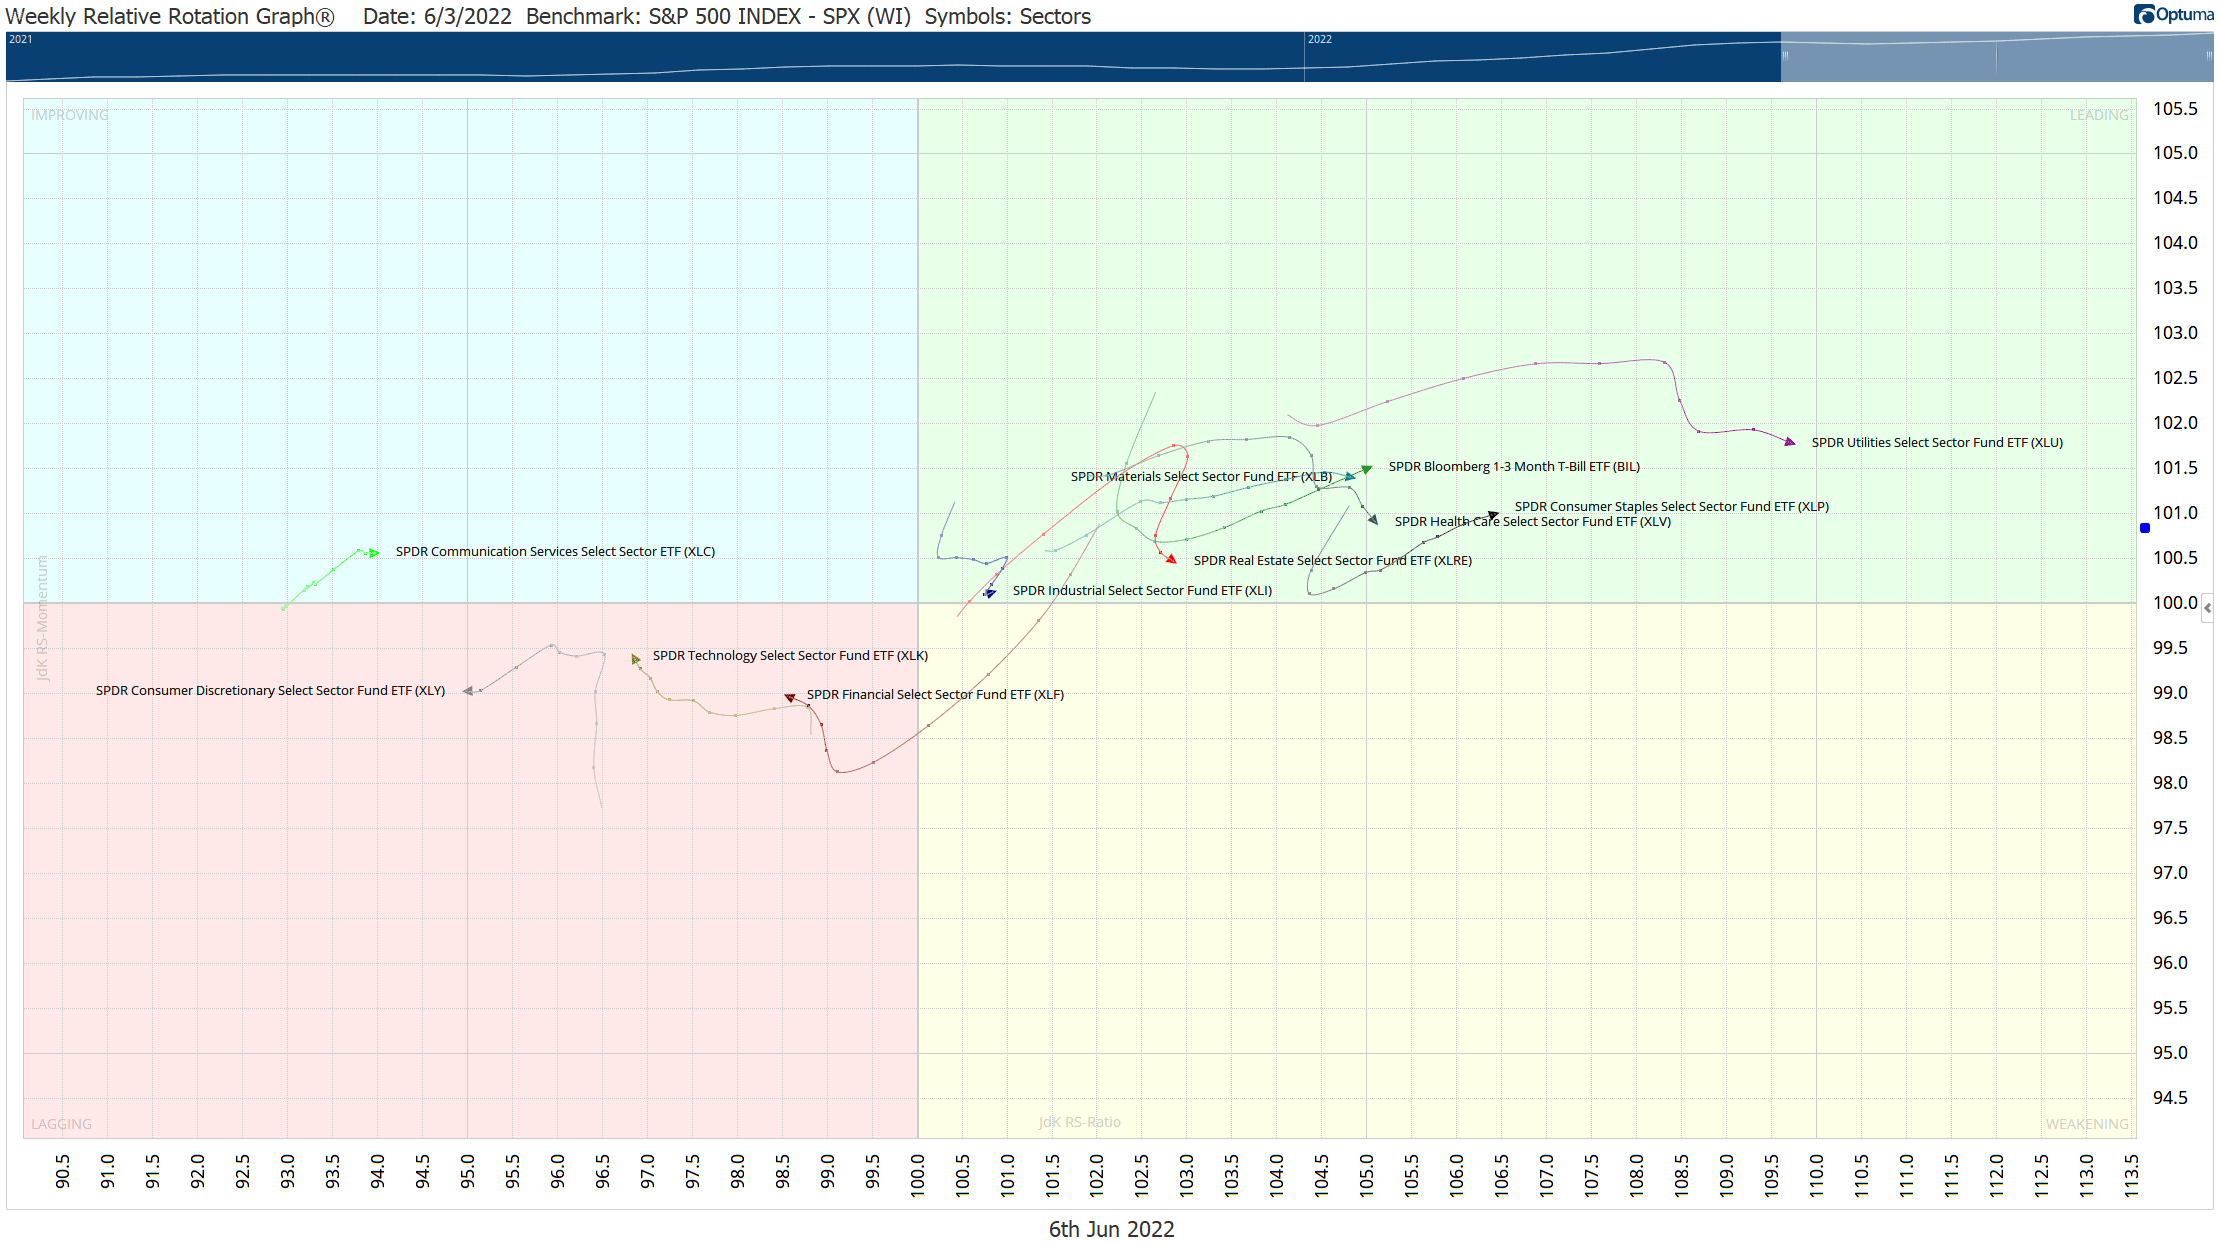
Sector leadership still favors defensive sectors over growth sectors as well.
During a major change in market trend, I would expect to see strong relative strength from growth sectors.
However, areas like consumer staples, health care, and utilities are outperforming their growth counterparts.
I am keeping a close eye on interest rates. The 10-year US treasury note saw a pullback over the past two weeks, which helped fuel the recent short-term rally in stocks.
However, rates look like they are once again rising — another potential obstacle for the market.
The FOMC meets next week, so the market will be closely watching economic data releases this week in an attempt to guess what the Fed will say during their two-day meeting, which starts on June 14th.
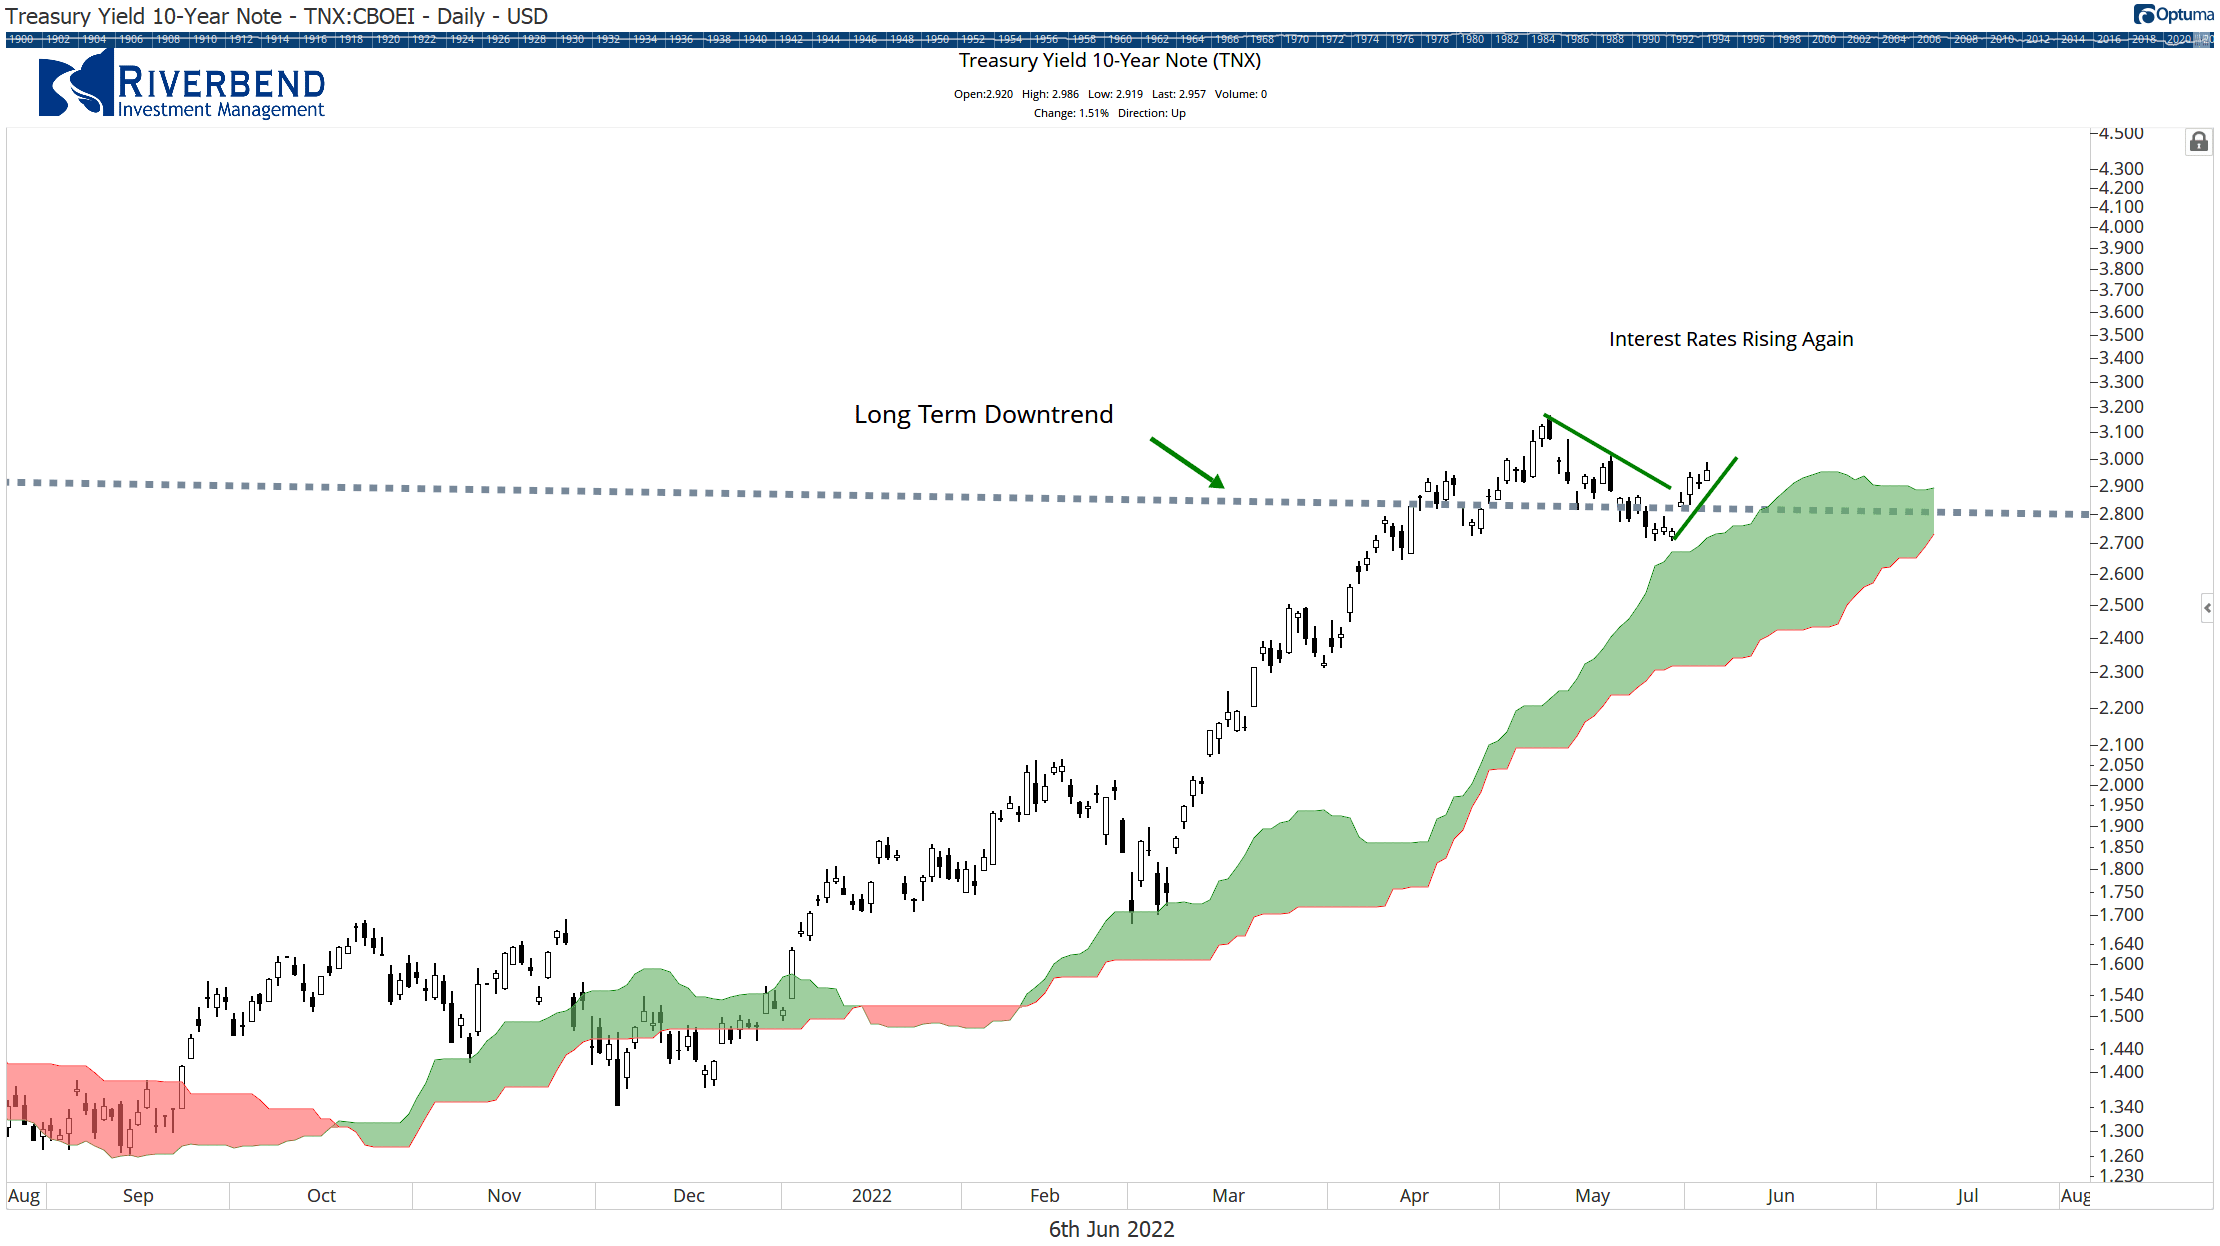
Chart of the Week:
The Biden administration is demanding that U.S. oil producers pump more in order to lower prices at the pump, while at the same time the administration is blasting U.S. refiners and producers for “gouging” and looking at punishing them with a “windfall tax”.
To address these concerns, Chevron CEO Mike Wirth appeared on Bloomberg TV stating that adding refinery capacity is incredibly difficult, especially in the current environment.
Wirth stated, “You’re looking at committing capital 10 years out, that will need decades to offer a return for shareholders, in a policy environment where governments around the world are saying: we don’t want these products.” “We’re receiving mixed signals in these policy discussions,” Wirth added.
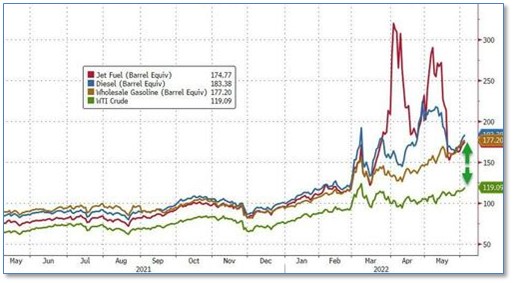
The United States hasn’t had a new refinery built since the 1970s As the below graphic shows, the rate of price increases for refined products like jet fuel, diesel, and gasoline, has surged far higher than the price of crude oil.
Riverbend Indicators:
- As a reading of our Bull-Bear Indicator for U.S. Equities (comparative measurements over a rolling one-year timeframe), we remain in Cyclical Bull territory.
- Counting up the number of all our indicators that are ‘Up’ for U.S. Equities, the current tally is that one of four is Positive (suggesting a short term bounce), representing a multitude of timeframes (two that can be solely days/weeks, or months+ at a time; another, a quarter at a time; and lastly, the {typically} years-long reading, that being the Cyclical Bull or Bear status).
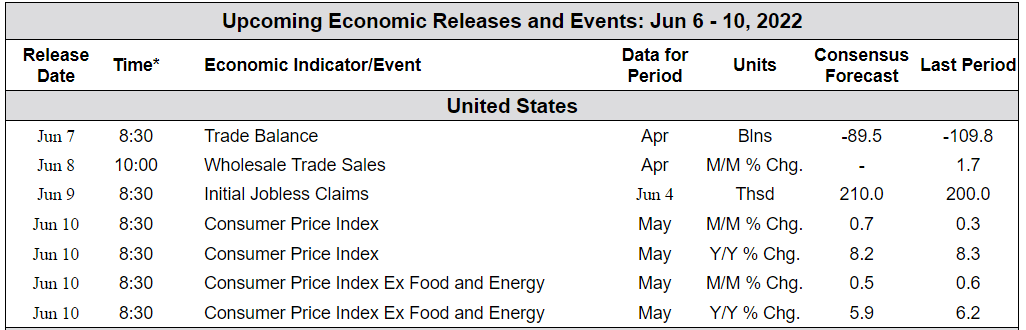
The Week Ahead:
[/fusion_text][/fusion_builder_column][/fusion_builder_row][/fusion_builder_container]


