Market Recap
U.S. Markets:
U.S. Markets: The major U.S. market indexes finished the week in mixed fashion, with the technology-heavy NASDAQ Composite performing the best while smaller-cap benchmarks lagged.
The Dow Jones Industrial Average was essentially unchanged declining just 5 points to 26,026 while the NASDAQ gained 0.9% finishing the week at 7,595.
By market cap, the large cap S&P 500 rose 0.4%, while the mid cap S&P 400 declined -0.4%, and the small cap Russell 2000 finished the week essentially flat.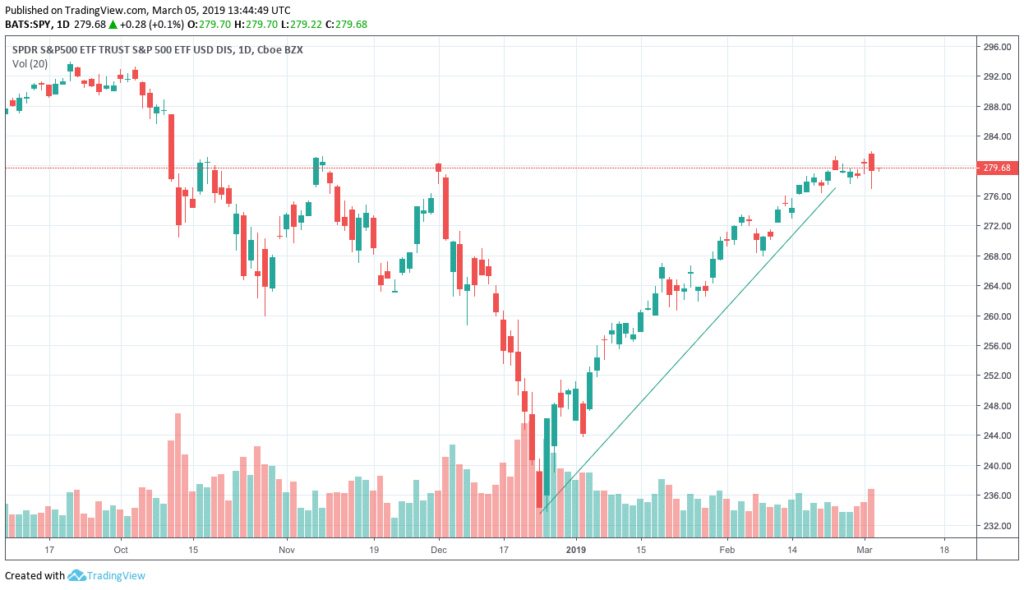
Major markets around the world were positive in February. The Dow Jones Industrial Average rose 3.7% and the NASDAQ Composite gained 3.4%. The large cap S&P 500 added 3%, the mid cap S&P 400 rose 4.1%, and the small cap Russell 2000 gained 5.1%.
International Markets : International markets were mixed on the week. Canada’s TSX rose 0.3% while the United Kingdom’s FTSE finished down -1%. On Europe’s mainland France’s CAC 40 added 0.9%, Germany’s DAX finished up 1.3%, and Italy’s Milan FTSE rose 2.1%.
In Asia, China’s Shanghai Composite surged 6.8%, while Japan’s Nikkei gained 0.8%. As grouped by Morgan Stanley Capital International, developed markets added 0.8% while emerging markets finished down -1.3%.
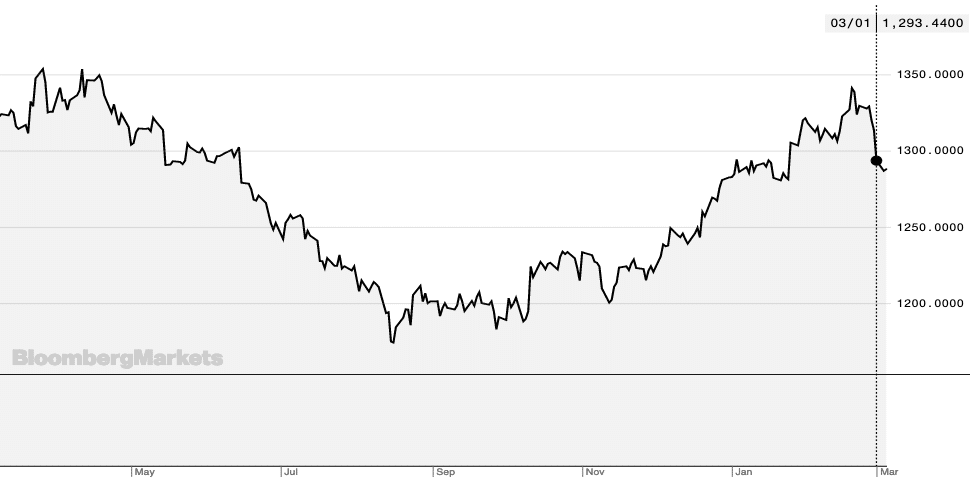
Commodities: Following two weeks of gains, Gold ended the week down -2.5% (-$33.60) to $1299.20 an ounce. Silver finished the week down a steeper -4.1% to $15.26 an ounce.
Crude oil also retreated after two weeks of gains, giving up -2.6% to $55.80 per barrel for West Texas Intermediate crude. Copper, seen as an indicator of global economic health due its variety of industrial uses, retreated -0.7%.
Gold Spot Price
U.S. Economic News
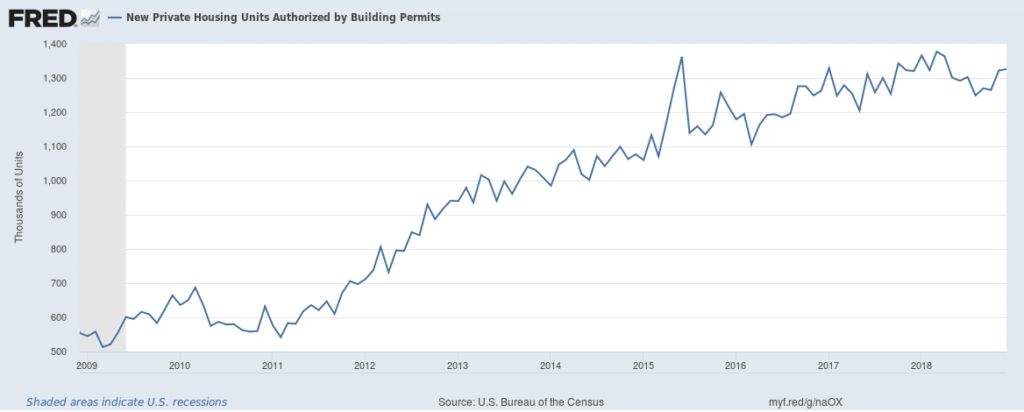
Construction on new houses sank to a more than two-year low in December, according to the Commerce Department. The report, which had been delayed due to the recent government shutdown, showed starts had tumbled 11% to an annual rate of just 1.08 million in the last month of 2018 from 1.21 million in November. The reading was the lowest since September 2016. In the details, the biggest decline took place in multi-unit dwellings of two units or more which plummeted 20% in December versus just a 6.7% decline in single-family homes. However, analysts note that the slump is most likely temporary. Building permits, which give an indication of future building activity, edged up 0.3% to a 1.326 million unit rate suggesting a likely pickup in housing starts in the spring.
The National Association of Realtors reported its measure of pending home sales rebounded strongly in January, up 4.6% to 103.2–the first increase in seven months. The consensus was for a much smaller 0.8% gain. Year-over-year, the pace of contract signings was still negative at -2.3%, making January the 13th consecutive month of year-over-year declines. Analysts believe lower mortgage rates and the end of the government shutdown spurred activity. All four regions of the country posted gains, but in the South contract signings surged almost 9%.
In a bit of good news for would-be home buyers, growth in home prices slumped to a 4-year low according to the S&P CoreLogic Case-Shiller Home Price Index. The Case-Shiller 20-city index rose a seasonally-adjusted 0.2% in December and was 4.2% higher than the same time a year ago, but that was the slowest rate of annual growth since November of 2014.
Similarly, the National Home Price Index ticked up just 0.3% in December, the least in five months, while its year-over-year change slowed to 4.7%–its slowest pace since August 2015. Of particular interest, while the West has been the best in recent years, December’s report saw Atlanta make it in to the top three for the first time and former high-flyers like Seattle and San Francisco saw tepid price growth on an annual basis and outright declines for the month.
Factory activity across the country slowed in January, weighing on the Chicago Federal Reserve’s National Activity Index (CFNAI). The CFNAI registered a -0.43 for the first reading of the year, a sharp reversal from the positive 0.05 the month before. In the details, the decline was led by production-related indicators. Due to the volatile nature of the monthly data, analysts frequently turn to the less-volatile three-month average, which decreased to a neutral reading last month from a positive 0.16 in December. The CFNAI is a weighted average of 85 economic indicators, designed so that zero represents trend growth and a three-month average above 0.70 suggests an increasing likelihood of a period of sustained inflation.
The nation’s consumers showed a huge rebound in confidence in February as the government shutdown came to an end and the stock market continued its recovery. The Conference Board’s Consumer Confidence Index surged 9.7 points in February to 131.4, exceeding the consensus forecast of just a 3.8 point increase. The reading was the first increase in four months and the biggest gain since August 2015.
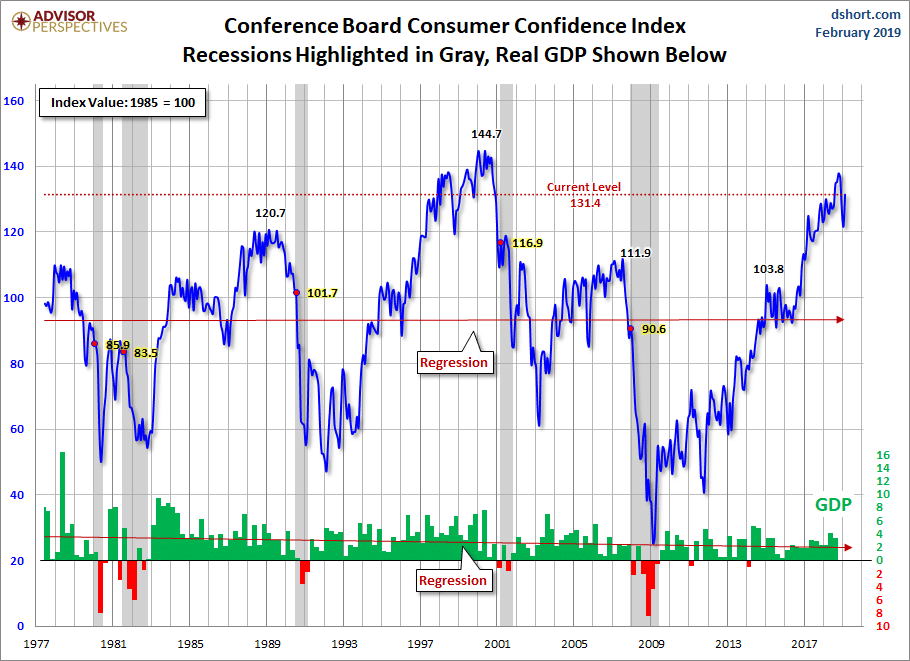
The rebound in February was led by higher expectations, but consumers’ assessment of present conditions also improved. Confidence was higher across all demographic and most income groups. The current level of confidence remains consistent with above-trend economic growth and suggests consumer spending will remain the driving force of the current expansion.
The Q4 GDP report showed the U.S. economy slowed to a 2.6% annualized rate in the final quarter of last year, down from 3.4% the previous quarter. A slowing housing market and bigger trade deficit weighed after robust growth midyear. Despite slowing, the reading still exceeded economists’ forecasts of 1.9% Q4 growth. The slowdown at the end of 2018 kept the U.S. from reaching at the 3% annual growth level. At 2.9%, 2018 growth matched 2015 as the biggest increase since the end of the 2007-2009 financial crisis.
Current Indicators
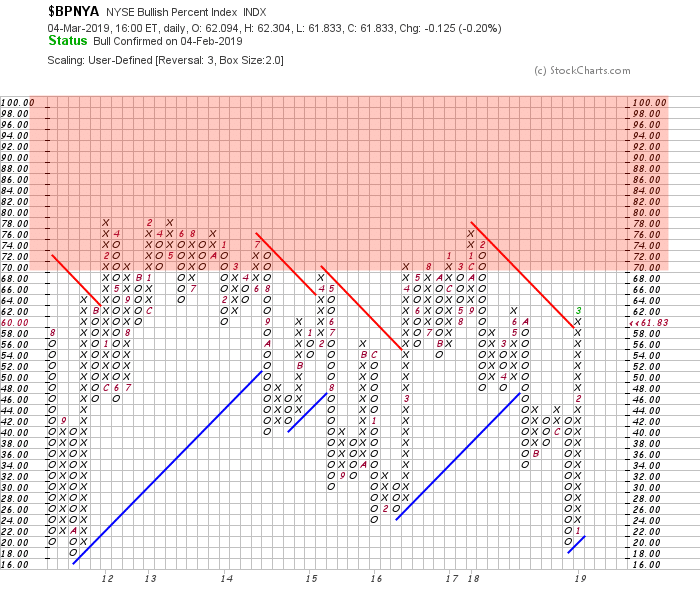
The NYSE Bullish Percent Index continues to rise, nearing overbought territory.
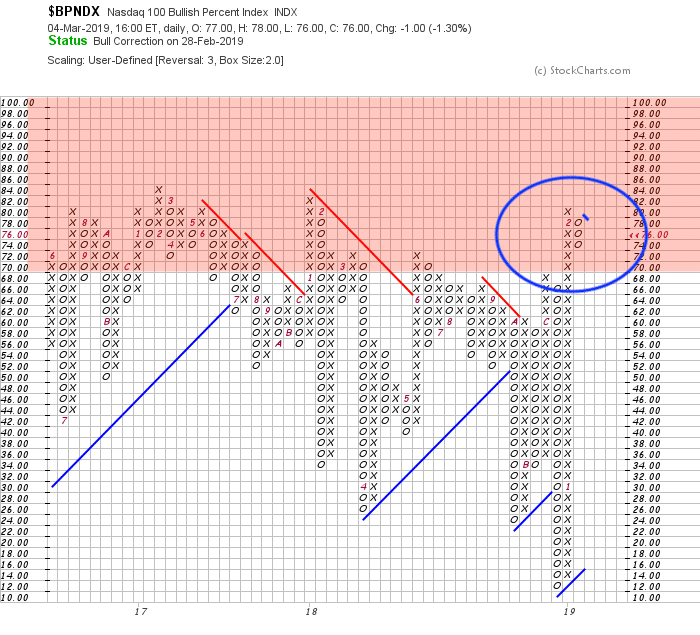
Of note: the Nasdaq 100 Bullish Percent Index has reversed, while in overbought territory. This may be an early indication that investors are starting to move out of higher beta names.
NYSE Bullish Percent Index:
 NASDAQ 100 Bullish Percent Index:
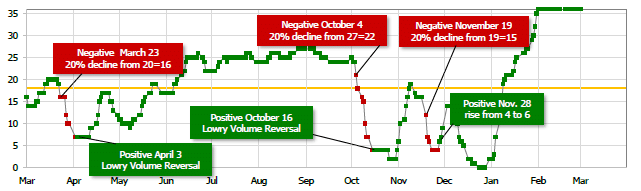
Short Term Trend: Our short term directional indicator is telling us that we are in an overbought market – however, overbought markets can last weeks or even months.
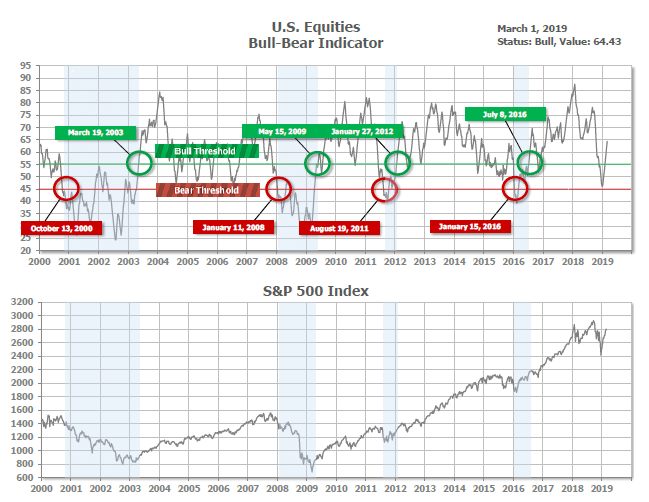
Bull/Bear Market Status
Our long-term bull/bear market trend indicator is still rising, indicating any short term pullbacks in US equities may be a buying opportunity:
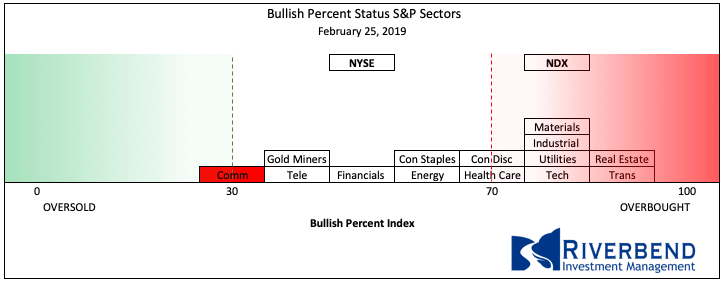
S&P Sector Bullish Percent Index:
The Bullish Percent Index by sector is starting to show some sectors reversing from overbought status. Below is this week’s reading vs last week’s reading. (Boxes highlighted in red are declining).
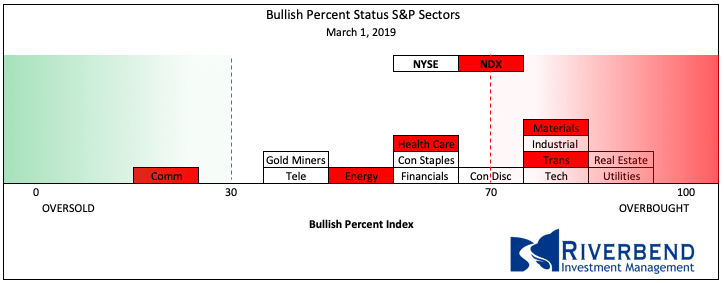
vs last week:
SHUT vs DIME
The ranking relationship between the defensive SHUT sectors is one way to gauge institutional investor sentiment in the market.
“S”=Staples [a.k.a. consumer non-cyclical]
“H”=Healthcare
“U”=Utilities and
“T”=Telecom
and the offensive DIME sectors:
“D”=Discretionary [a.k.a. Consumer Cyclical]
“I”=Industrial,
“M”=Materials
“E”=Energy
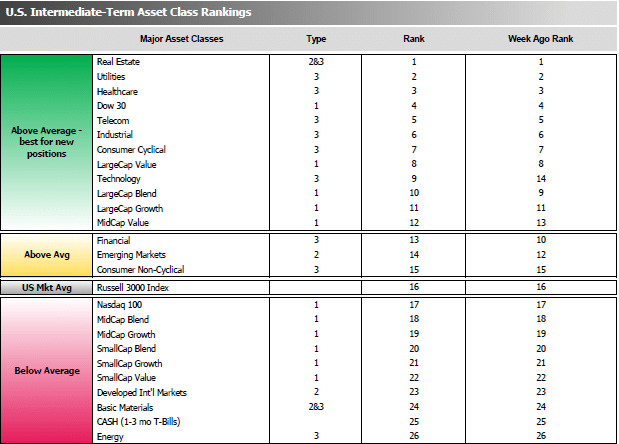
The average ranking of Defensive SHUT sectors and Offensive DIME sectors were unchanged from the prior week.
The Defensive SHUT sectors maintained their lead over Offensive DIME sectors.
Note: these are “ranks”, not “scores”, so smaller numbers are higher ranks and larger numbers are lower ranks.
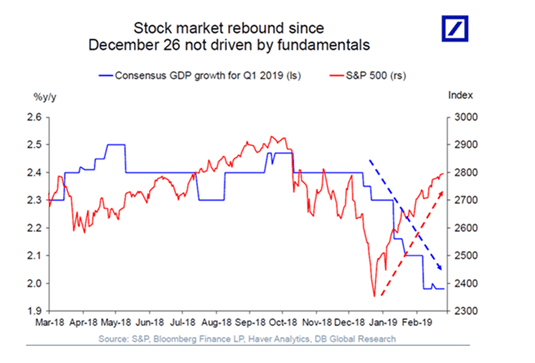
Chart of Interest
According to some on Wall Street, the stock market’s monster rally from its Christmas Eve low is hard to explain – or justify – from a fundamental standpoint.
The market’s more than 18% comeback coincided with a wave of downward growth and earnings revisions that lowered analysts’ expectations for first-quarter earnings and GDP growth.
As Deutsche Bank’s chief international economist Torsten Slok points out, “Either markets have to come down to where growth expectations are, or growth and earnings expectations have to move higher to justify current valuations.”
Looking further out, he noted, the Institute for Supply Management’s (ISM) readings and the Purchasing Manager’s Index (PMI) readings are both pointing to more weakness going forward.
Riverbend Model Portfolio Update:
(as of 3/1/19)
The S&P 500 has risen approximately 12% year to date. We are starting to see numerous sectors in overbought territory, which we view as high-risk areas of the market.
As a result, we have been raising cash in the portfolios to lock in some of the year to date gains.
We will be closely watching for sectors to shift into oversold conditions when looking at potential buying opportunities.
If you have any questions, please reach out to me directly at john.rothe@riverbendinvestments.com
(sources: all index return data from Yahoo Finance; Reuters, Barron’s, Wall St Journal, Bloomberg.com, ft.com, guggenheimpartners.com, ritholtz.com, markit.com, financialpost.com, Eurostat, Statistics Canada, Yahoo! Finance, stocksandnews.com, marketwatch.com, wantchinatimes.com, BBC, 361capital.com, pensionpartners.com, cnbc.com, FactSet; Figs 1-5 source W E Sherman & Co, LLC)
© 2019 Riverbend Investment Management, LLC. This presentation is intended for informational purposes only.
The information and statistical data contained herein have been obtained from sources we believe to be reliable but in no way are warranted by us as to accuracy or completeness. The opinions expressed are those of Riverbend Investment Management, LLC. and are subject to change without notice. No part of this presentation may be reproduced in any manner without the written permission of Riverbend Investment Management, LLC. Any securities discussed should not be construed as a recommendation to buy or sell and there is no guarantee that these securities will be held for a client’s account nor should it be assumed that they were or will be profitable. Past performance does not guarantee future comparable results.
Riverbend Investment Management, LLC is a Registered Investment Adviser in Northern VA
ADV II available upon request
Riverbend Investment Management, LLC
1818 Library Street, Suite 500
Reston VA 20190
Tel:703-349-6327
www.riverbendinvestments.com


