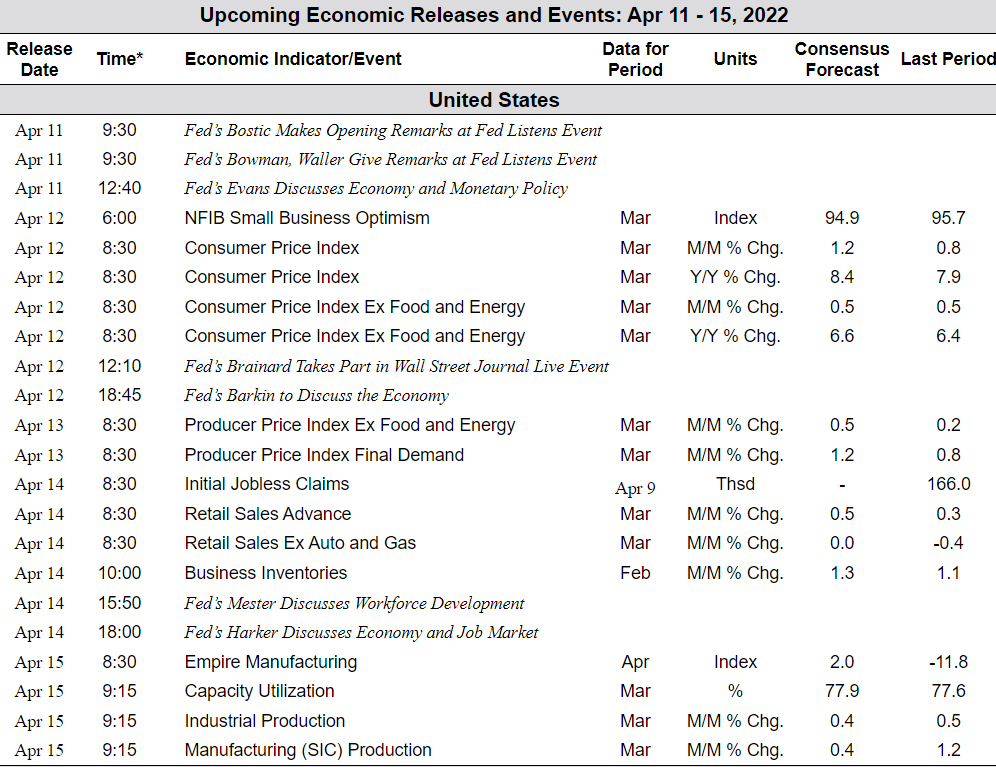
Last week was another volatile market as traders digested speeches from Federal Reserve Board members regarding inflation.
By the end of the week, signs of positive momentum began to show again.
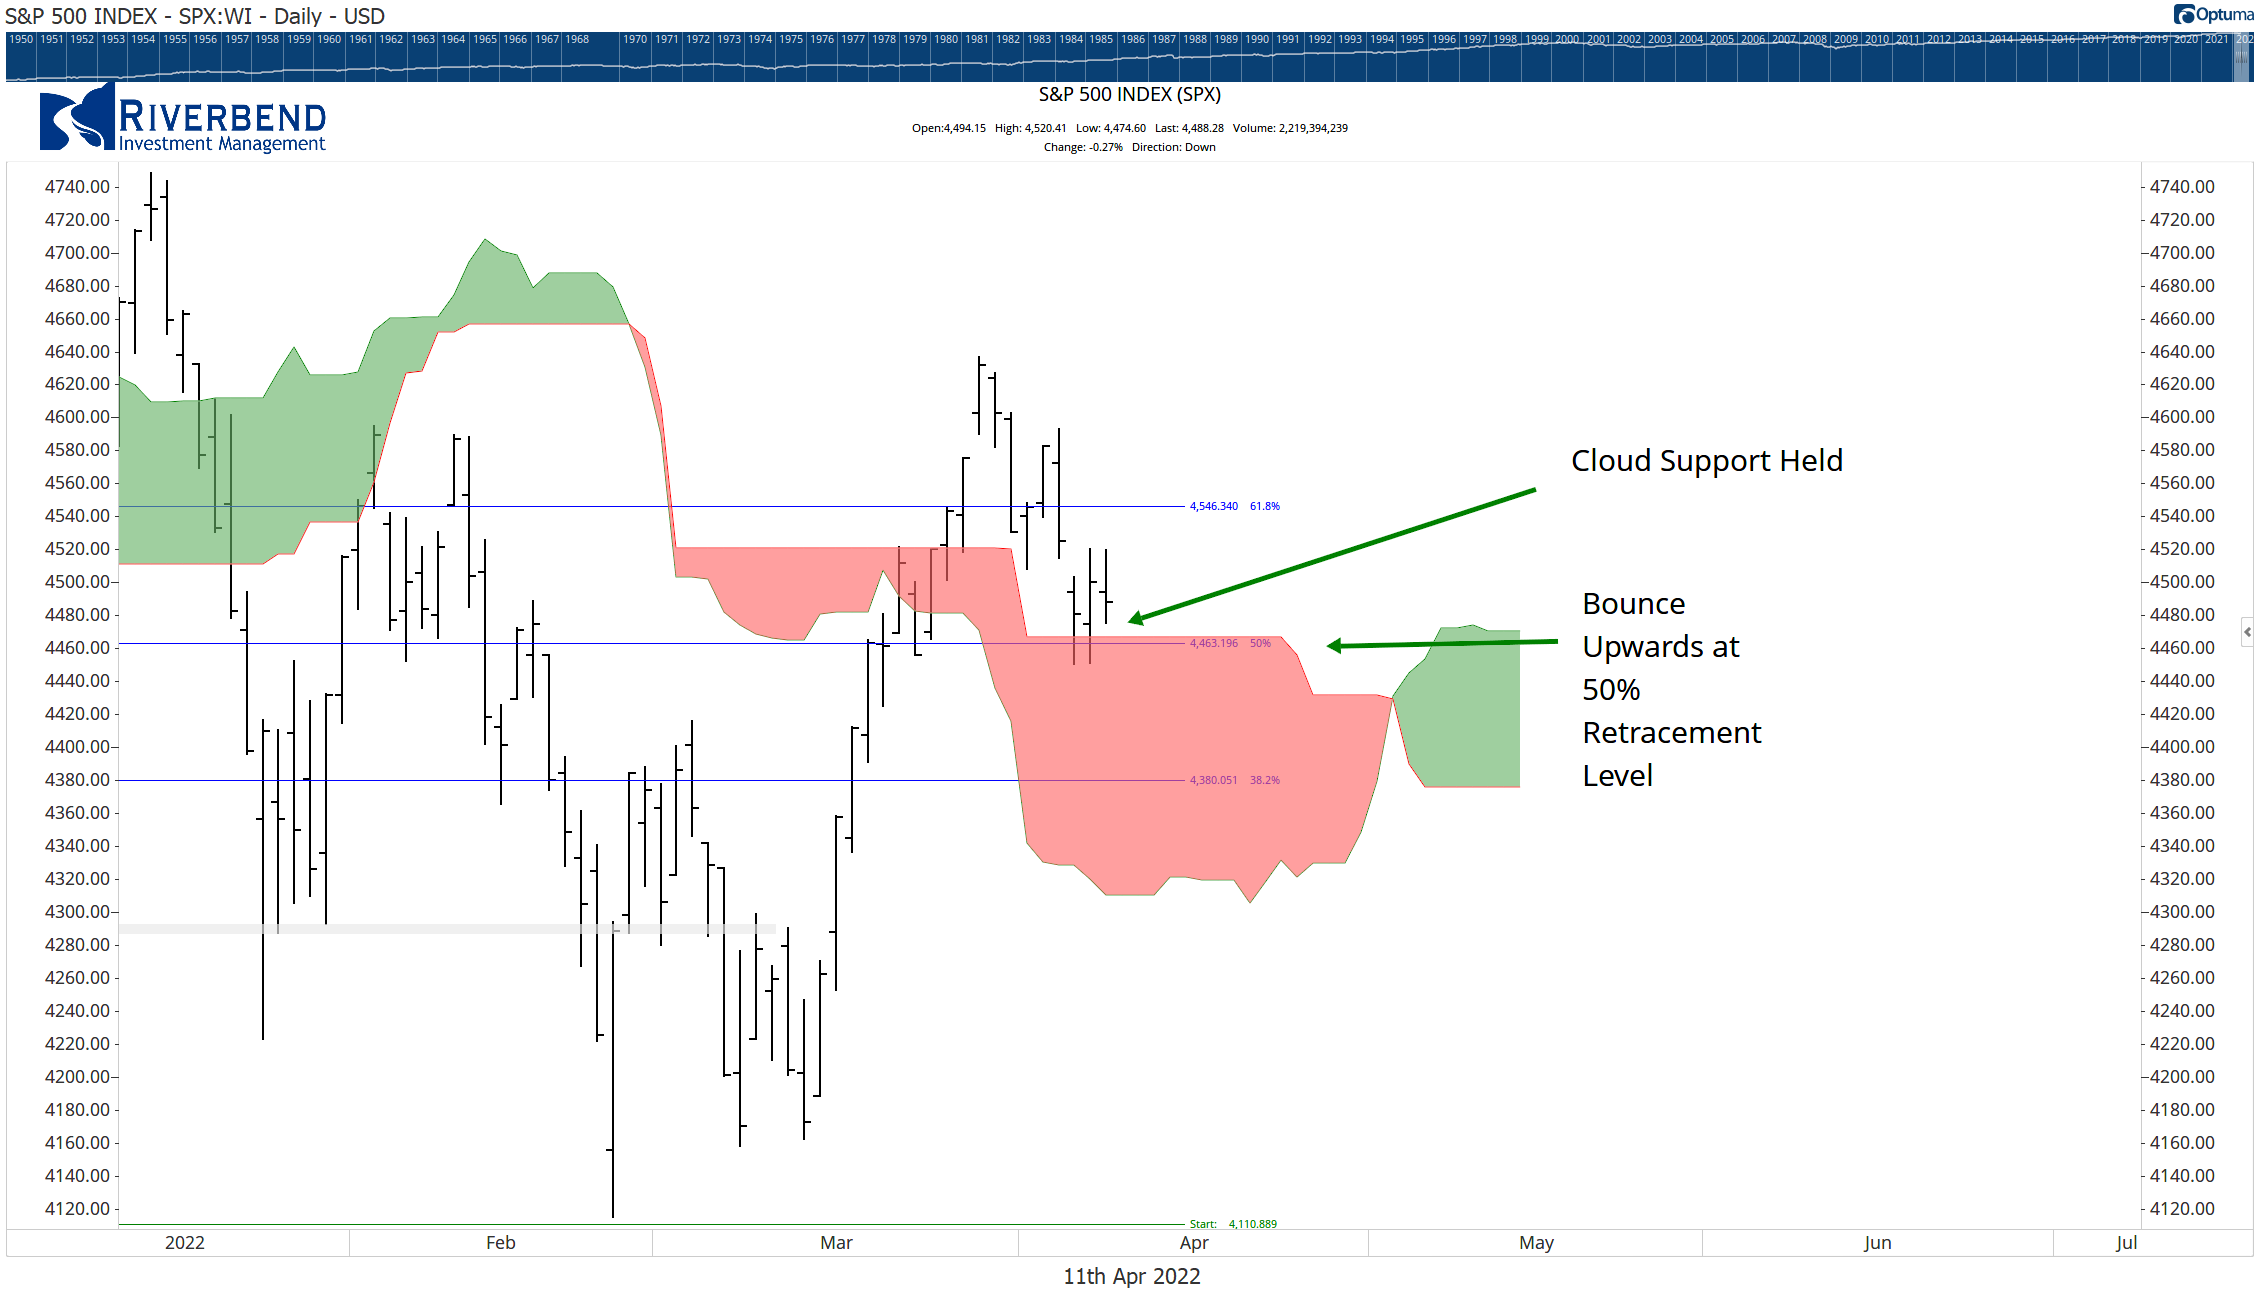
From a technical viewpoint, the S&P 500 Index held support above the cloud model, and bounced upwards at its 50% retracement level — both positive signs for the market.
In addition, the 60-minute chart of the S&P 500 Index has flashed a DeMARK buy signal.
The DeMARK signals represent exhaustion in the market. In this case, exhaustion from sellers. Historically, DeMARK signals can represent key turning points in the market.
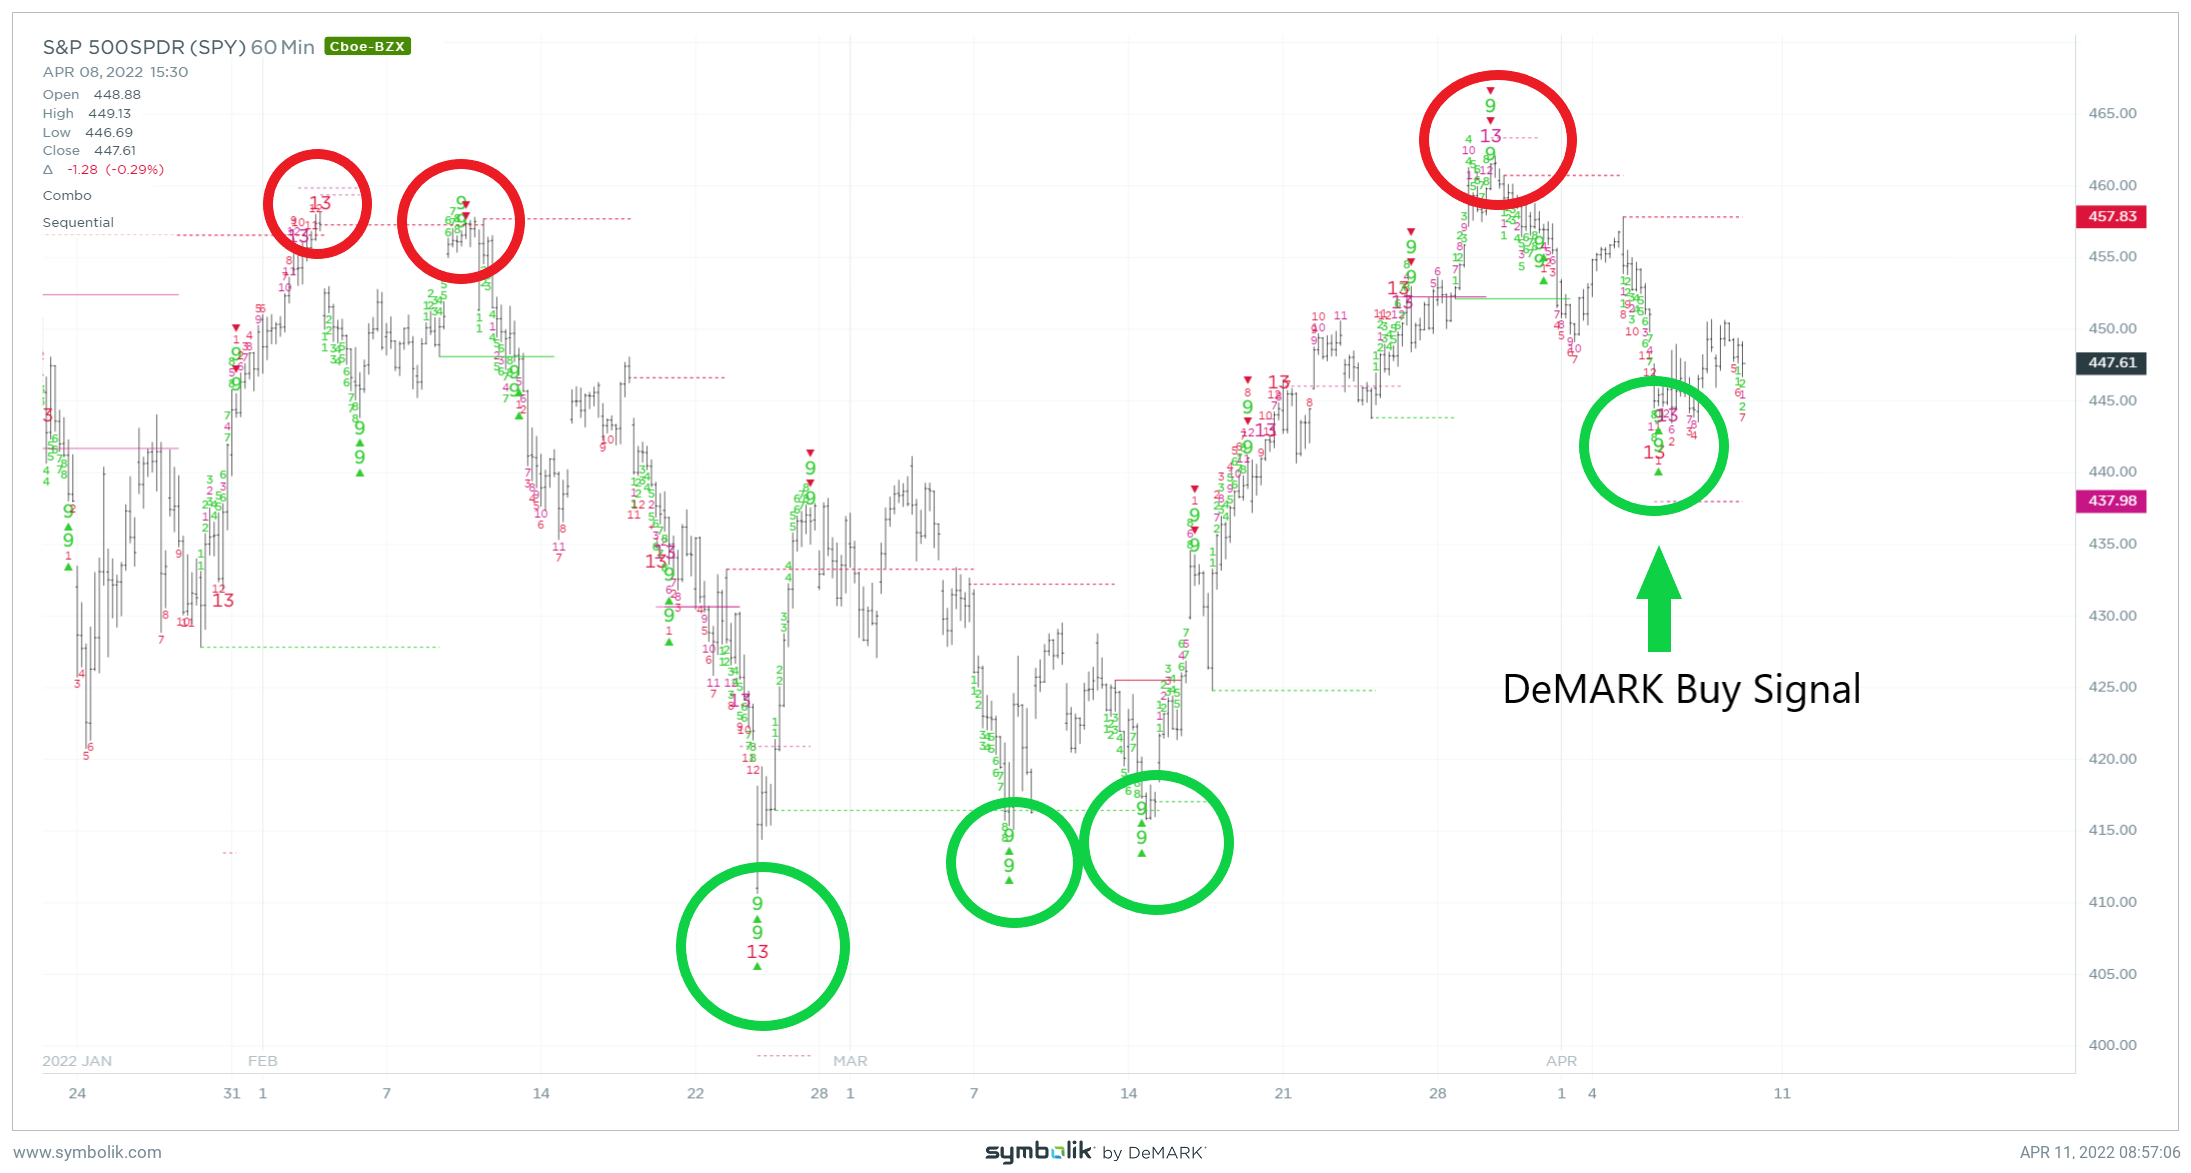
This suggests the relief rally will resume, in line with the seasonal aspect of the market.
I am reposting the below chart from last week. April historically is a strong month for the market. As the market is oversold in the short term, we may see traders get aggressive this week on the buy-side to take advantage of seasonality effects.
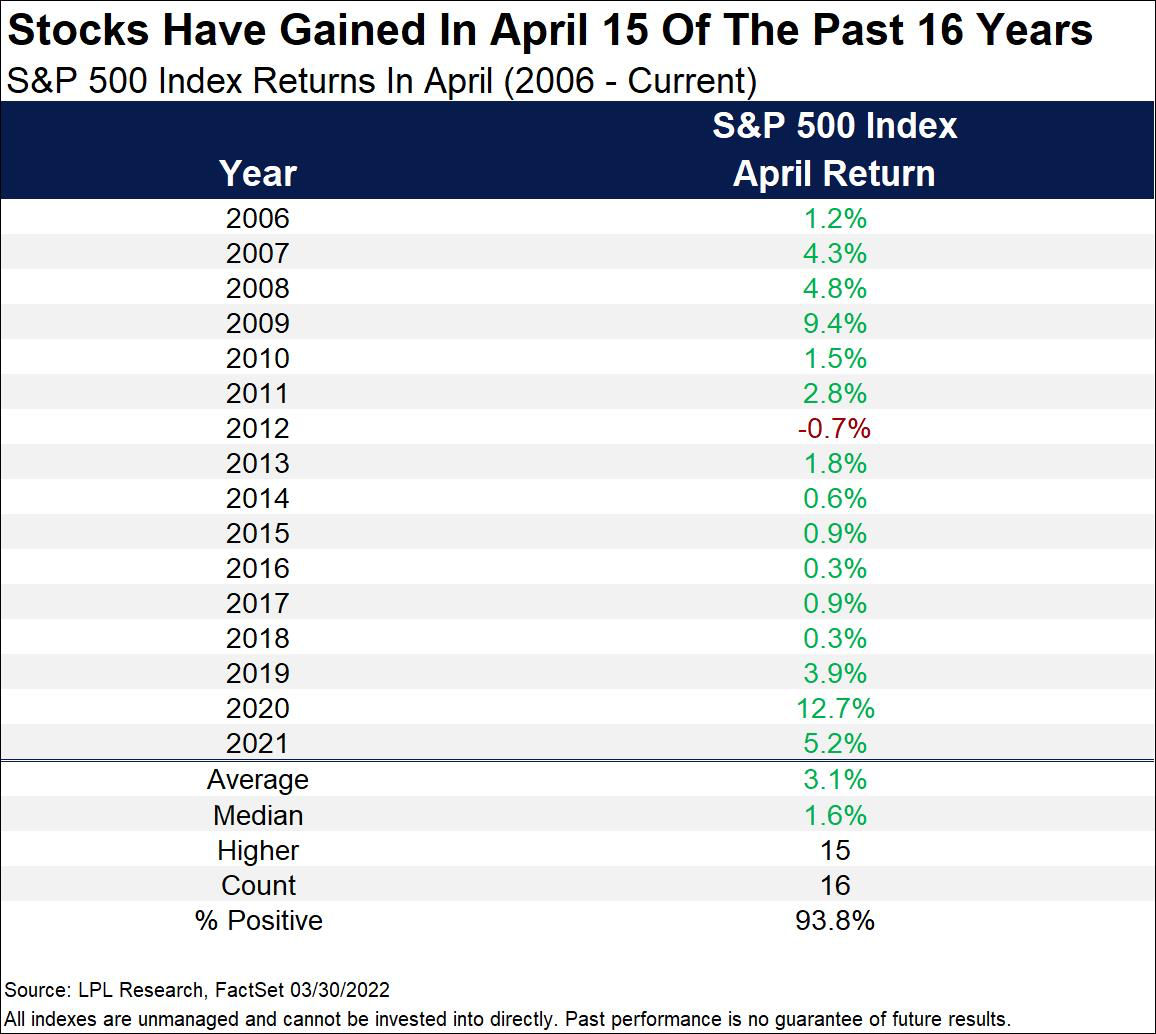
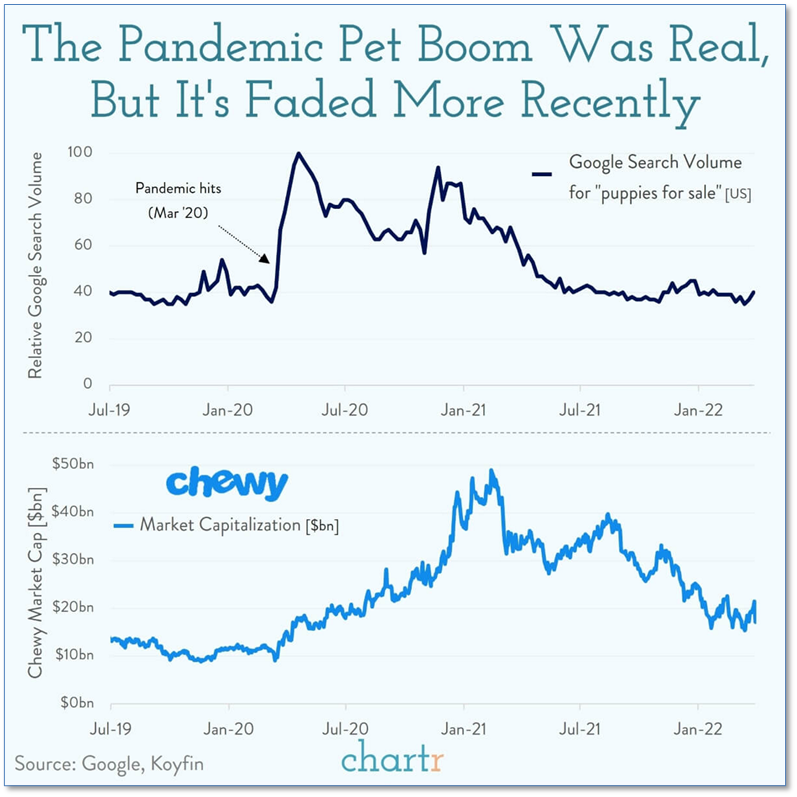
Chart of the Week:
The COVID pandemic and its subsequent mandatory lockdowns led to greater isolation, greater stress, and less time outside. What better way is there to brighten such a dark time – and occupy bored kids – than to get a puppy!
Apparently, millions of Americans thought so too. As households added an additional (furry) mouth to feed, one company in particular stood to benefit.
The online pet food and pet supply company Chewy saw its market cap quadruple from the beginning of the pandemic to its peak. Its stock chart shows an almost perfect correlation with Google searches for “puppies for sale”.
But now that the number of COVID cases is collapsing—so has Chewy’s stock price. After peaking near $120 a share in February of 2021, Chewy closed this week at $43.19—just a smidge above its IPO price of $35 in 2019.
Riverbend Indicators:
- As a reading of our Bull-Bear Indicator for U.S. Equities (comparative measurements over a rolling one-year timeframe), we remain in Cyclical Bull territory.
- Counting up the number of all our indicators that are ‘Up’ for U.S. Equities, the current tally is that three of four are Positive, representing a multitude of timeframes (two that can be solely days/weeks, or months+ at a time; another, a quarter at a time; and lastly, the {typically} years-long reading, that being the Cyclical Bull or Bear status).
The Week Ahead: