[fusion_builder_container hundred_percent=”no” equal_height_columns=”no” menu_anchor=”” hide_on_mobile=”small-visibility,medium-visibility,large-visibility” class=”” id=”” background_color=”” background_image=”” background_position=”center center” background_repeat=”no-repeat” fade=”no” background_parallax=”none” parallax_speed=”0.3″ video_mp4=”” video_webm=”” video_ogv=”” video_url=”” video_aspect_ratio=”16:9″ video_loop=”yes” video_mute=”yes” overlay_color=”” video_preview_image=”” border_size=”” border_color=”” border_style=”solid” padding_top=”” padding_bottom=”” padding_left=”” padding_right=””][fusion_builder_row][fusion_builder_column type=”1_1″ layout=”1_1″ background_position=”left top” background_color=”” border_size=”” border_color=”” border_style=”solid” border_position=”all” spacing=”yes” background_image=”” background_repeat=”no-repeat” padding_top=”” padding_right=”” padding_bottom=”” padding_left=”” margin_top=”0px” margin_bottom=”0px” class=”” id=”” animation_type=”” animation_speed=”0.3″ animation_direction=”left” hide_on_mobile=”small-visibility,medium-visibility,large-visibility” center_content=”no” last=”no” min_height=”” hover_type=”none” link=””][fusion_text]
The business cycle is advancing despite a number of investor concerns, one quarter after the economy returned to pre-pandemic levels. And while the pace has decelerated, this is normal after last year’s extreme rebound.
For investors, this is important because an economy that is expanding – even at a slower rate – is what supports a robust bull market. What should those worried about their portfolios expect from the economy going forward?
Last week’s data show that U.S. GDP grew by 2% in the third quarter compared to the second. Although this is slower than many had hoped, this was due to factors that were widely anticipated: the delta variant, supply chain bottlenecks and a deceleration in consumer spending. When looking at the bigger picture, not only did the economy grow 4.9% in Q3 from a year ago, but personal consumption expenditures came in better than expected and both investment and government spending flipped from negative to positive.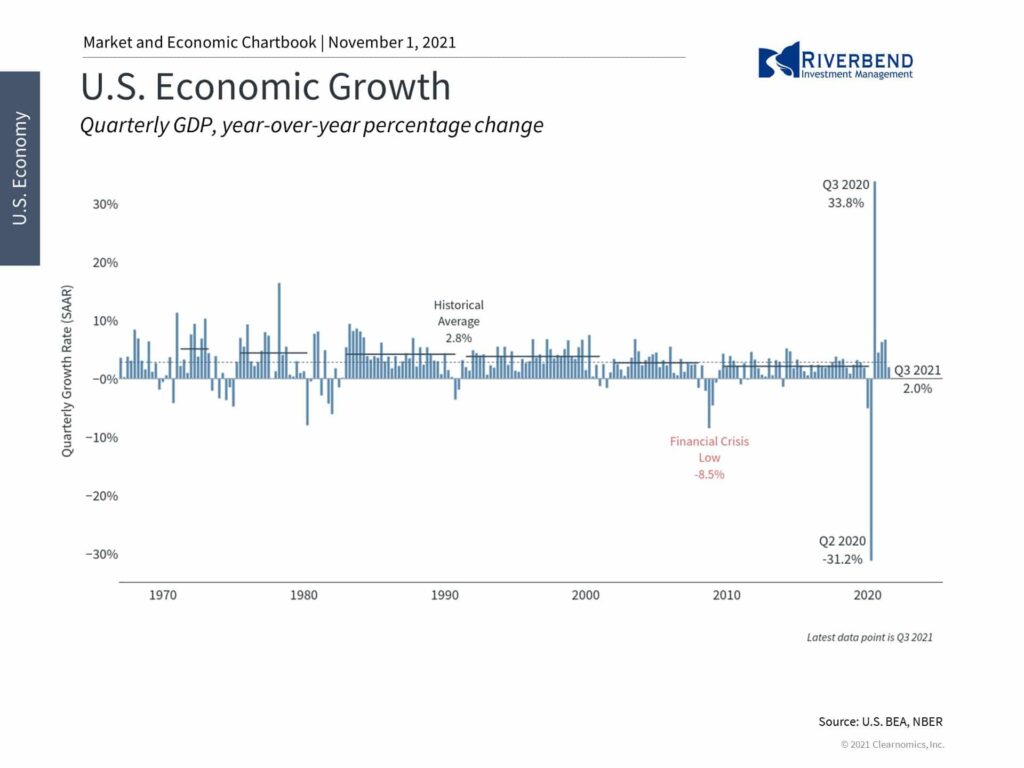
When considering economic data such as these, it’s always important to focus on a broader perspective.
The glass-half-empty view is that last quarter’s growth rate is the slowest since the recovery began, especially compared to the previous quarter’s 6.7% figure. The reality is that investors should not expect the types of growth that occurred right after businesses reopened last year, regardless of supply constraints and inflation.
The 33.8% rebound in Q3 2020 was possibly a once-in-a-lifetime event and only occurred because the economy shrank by 31% at the start of the pandemic. Clearly, the strong growth rates of the past year benefited from the reopening and should taper off over time.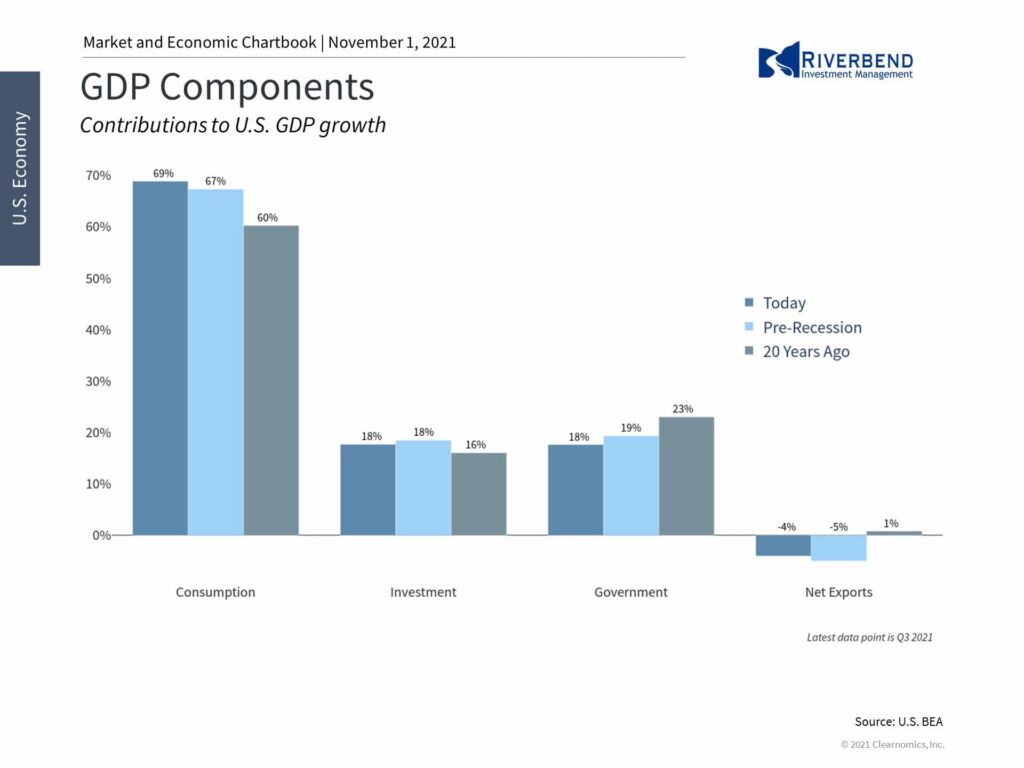
Of course, the situation never seems perfect. During the previous cycle, investors were constantly faced with intractable concerns such as structural debt problems, Fed policy, government spending, the Eurozone crisis and, ironically, the fact that inflation was too low.
Despite this, the S&P 500 rose 400% over the course of an 11 year period. Similar patterns can be found across all business cycles through history.
While pessimism can occasionally pay off in the short run, it almost never helps in the long run. Even when the situation fails to evolve as investors hope, investment portfolios that are properly positioned often find a way to perform well nonetheless.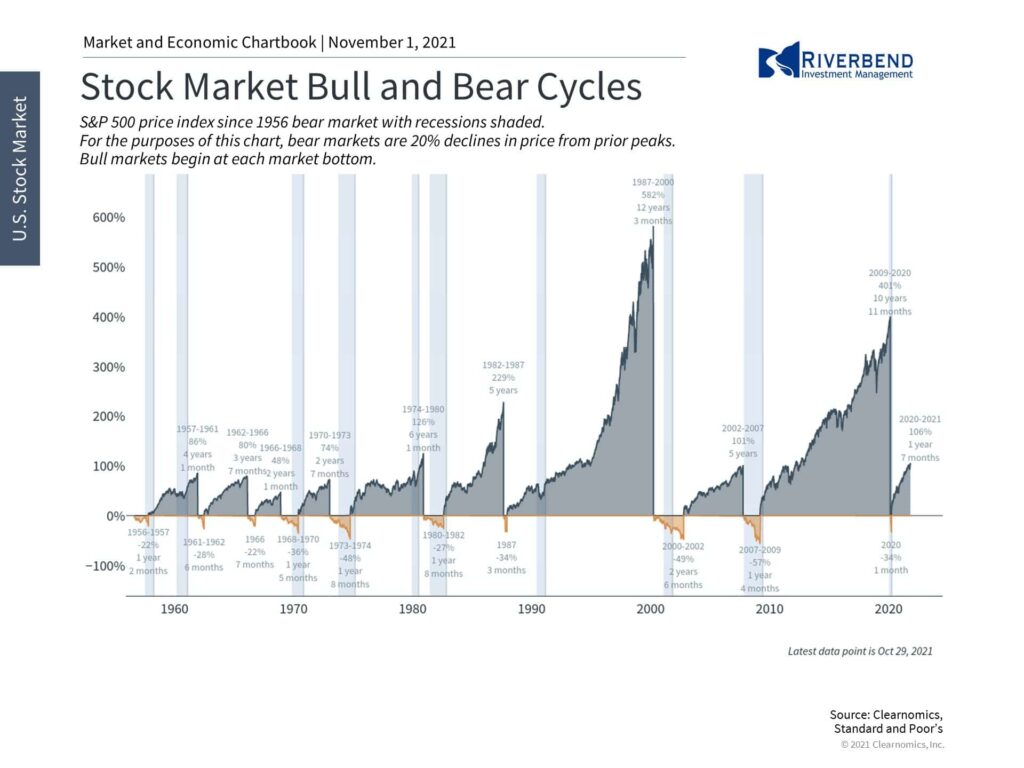
Thus, the more optimistic perspective for investors is that the economy can continue to grow at a steady pace. The average consumer is in a strong financial position, especially as the unemployment rate continues to fall, and industrial activity continues to expand. Although not all Americans are doing well, they will begin to benefit with cases of the delta variant low and businesses growing.
For long-term investors, it’s important to keep in mind that recessions and bear markets tend to be sudden and last for months, while bull markets and economic expansions tend to be steady and last for years if not decades. Positioning for the latter, without focusing too much on any individual data point, is the best way to achieve financial goals.
Chart of the Week:
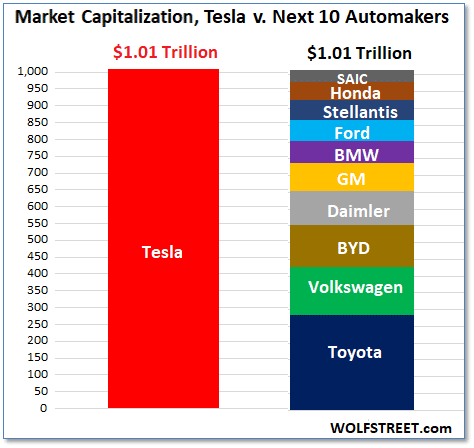
Shares of Tesla surged over 22% this week, pushing the company’s market capitalization to over $1.01 trillion.
Tesla now has a price-to-earnings (P/E) ratio of over 330 in an industry where P/E ratios of 10 to 30 are typical. With its current market cap, Tesla is now worth as much as the next 10 most valuable global automakers combined.
Ridiculous, or prescient? Time will tell.
Riverbend Indicators:

Each week we post notable changes to the various market indicators we follow.
- As a reading of our Bull-Bear Indicator for U.S. Equities (comparative measurements over a rolling one-year timeframe), we remain in Cyclical Bull territory.
- Counting up of the number of all our indicators that are ‘Up’ for U.S. Equities, the current tally is that four of four are Positive, representing a multitude of timeframes (two that can be solely days/weeks, or months+ at a time; another, a quarter at a time; and lastly, the {typically} years-long reading, that being the Cyclical Bull or Bear status).
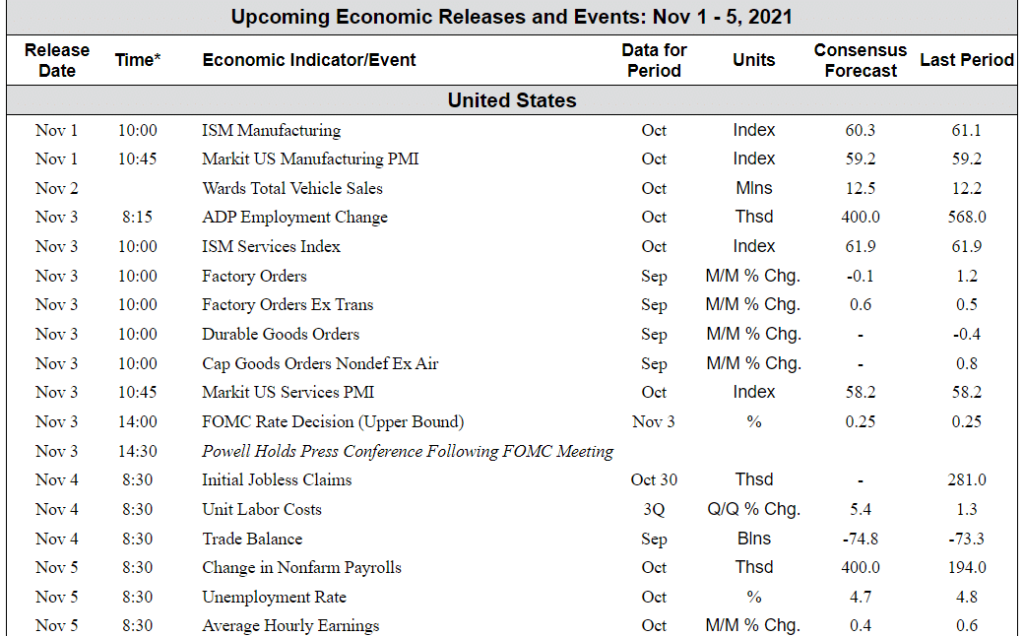
The Week Ahead:
Source: Bloomberg, TD Economics
[/fusion_text][/fusion_builder_column][/fusion_builder_row][/fusion_builder_container]


