Market Recap
U.S. Markets: U.S. stocks managed to move modestly higher this week as most of the major indexes recorded their seventh consecutive week of gains. Within the S&P 500, utilities shares performed the best followed by large industrials and information technology shares. 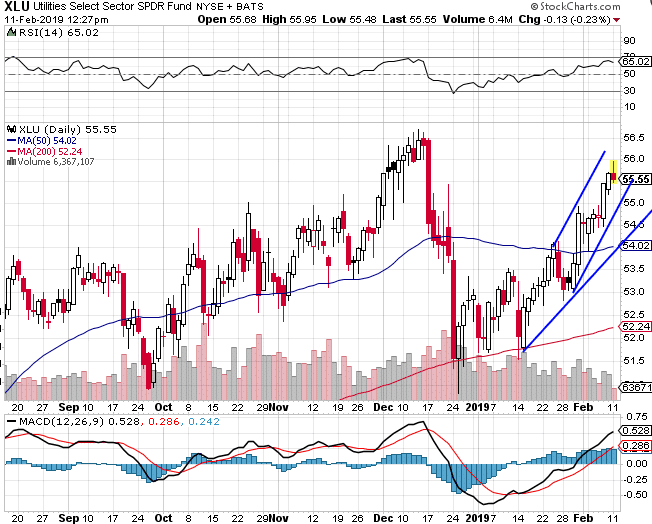
The Dow Jones Industrial Average finished the week up just 42 points to 25,106—a gain of 0.2%. The technology-heavy NASDAQ Composite added 34 points, or 0.5%, closing at 7,298.
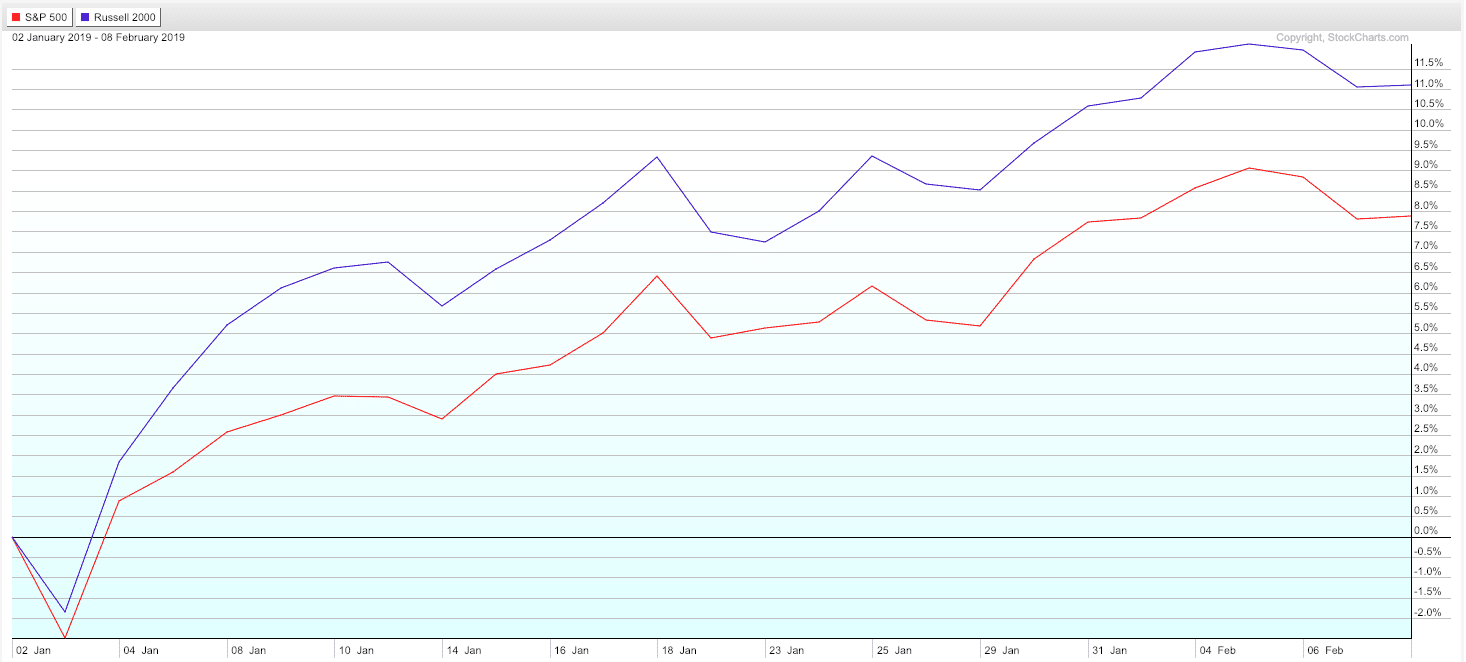
By market cap, smaller cap stocks continued to outperform with the small cap Russell 2000 index and mid cap S&P 400 indexes rising 0.3% and 0.6%, respectively, while the large cap S&P 500 index finished essentially unchanged, up just 1.3 points.
International Markets: Canada’s TSX rose a seventh week, adding 0.8%, while across the Atlantic the United Kingdom’s FTSE gained 0.7%. However, on Europe’s mainland major markets finished the week in the red. France’s CAC 40 declined -1.1%, along with Germany’s DAX which fell -2.4%. In Asia, China’s Shanghai Composite rose for a fifth consecutive week, up 0.6% and Japan’s Nikkei retreated -2.2%. As grouped by Morgan Stanley Capital International, emerging markets ended the week down -1.4%, while developed markets lost -1.0%.
Commodities: Precious metals retraced some of last week’s gains, with Gold falling -0.3% to $1318.50 an ounce and Silver giving up -0.8% to $15.81 per ounce. In energy, crude oil gave up the last three weeks of gains falling ‑4.6% to $52.72 per barrel.
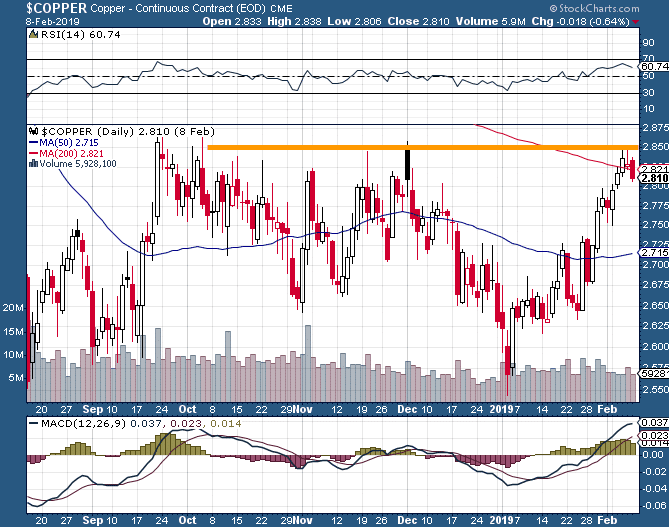
The industrial metal copper, seen by analysts as a barometer of global economic health due its wide variety of uses, finished the week up 1.4% – its fifth consecutive week of gains.
U.S. Economic News
The number of people applying for new unemployment benefits dropped by 19,000 last week to 234,000, retracing most of the big upswing of the previous week. However, the number missed the consensus forecast of a 28.000 decline to 225,000 claims.
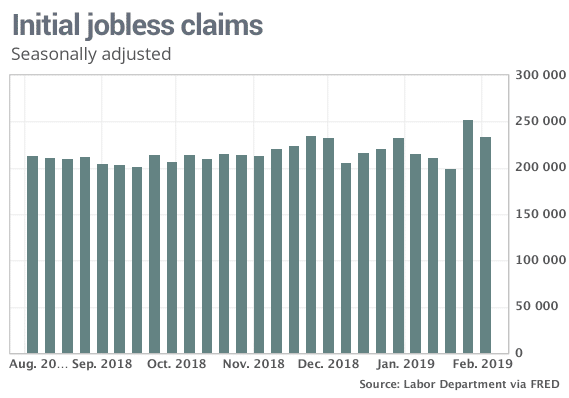
The monthly average of new claims, smoothed to iron-out the weekly volatility, picked up by 4,500 to 224,750. Claims still remain well below the 300,000 threshold economists use to indicate a “healthy” jobs market. Continuing claims, which counts the number of people already receiving benefits, dropped by 42,000 to 1.74 million. That number is reported with a one-week delay.
Most economic reports originating from the U.S. government are still delayed due to the government shutdown. One that did manage to get released showed that factory orders in the U.S. fell more sharply than expected in November. Orders dropped -0.6% in November, their second consecutive decline and contrary to the consensus forecast of a 0.1% gain.
The weakness was largely due to lower oil prices. However, one bright spot was an increase in orders for goods expected to last at least three years – so-called “durable goods” – which rose 0.7%. Durable goods orders were led by defense-oriented aircraft, ships and boats. However, ex-transportation, durable goods orders were actually down 0.4% and have been down three of the last four quarters.
The Institute for Supply Management (ISM) reported that its non-manufacturing index remained in positive territory but fell 1.3 points last month to 56.7, a six-month low. The reading was worse than consensus estimates of a 1-point decline and was its third decline in the past four months. Several industries reported adverse effects from the government shutdown. However analysts note that although services activity has been moderating, it is still showing above trend growth.
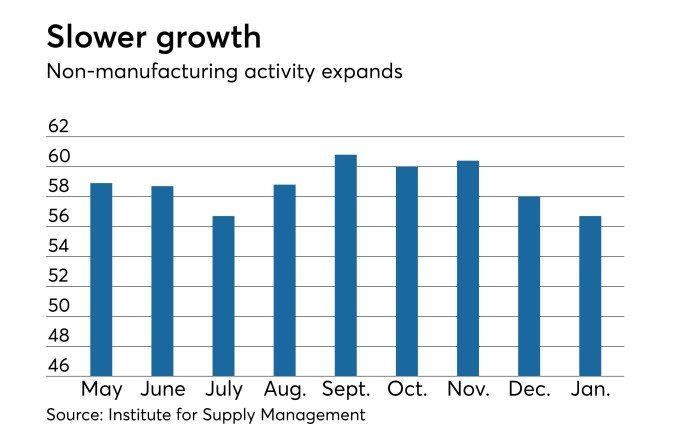
In the details, the decline was led by a 5.0 point drop in the new orders index—its largest decline since August of 2016. The ISM index is compiled from a survey of executives who order raw materials and other supplies for their companies. The gauge tends to rise or fall in tandem with the health of the economy.
Current Indicators
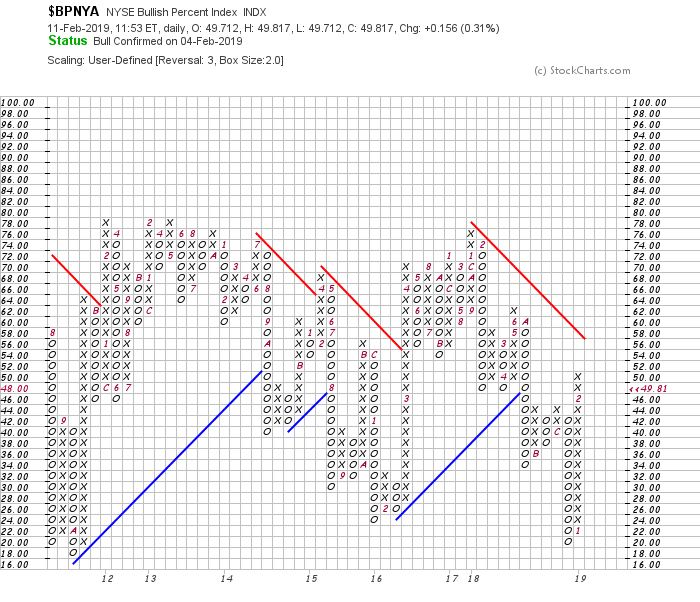
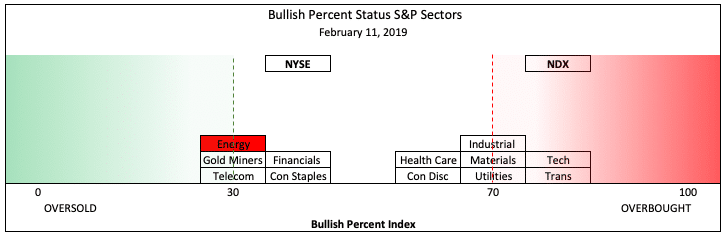
NYSE Bullish Percent Index: The NYSE Bullish Percent Index is still flashing a “buy” signal. However, we may be nearing an area where a mild pullback may occur:
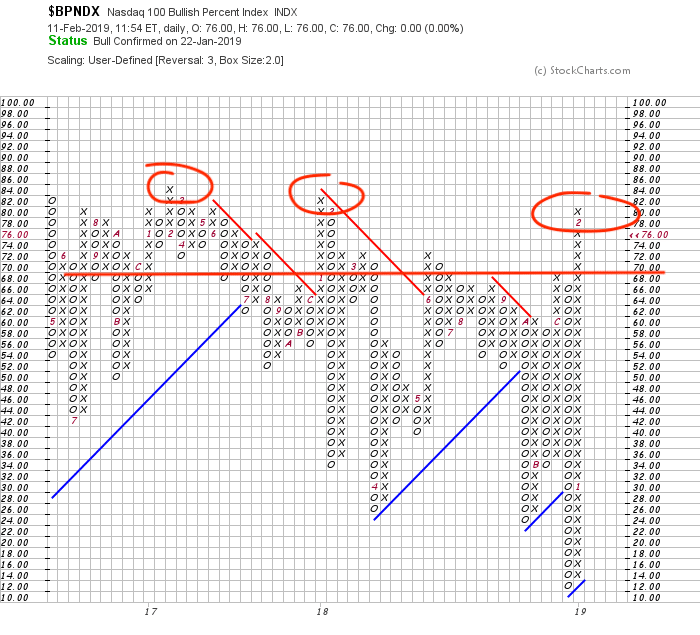
The Nasdaq 100 Bullish Percent Index is in “overbought” territory. (Anything above 70 warrants caution). Again, a pullback from these levels would not be out of the ordinary.
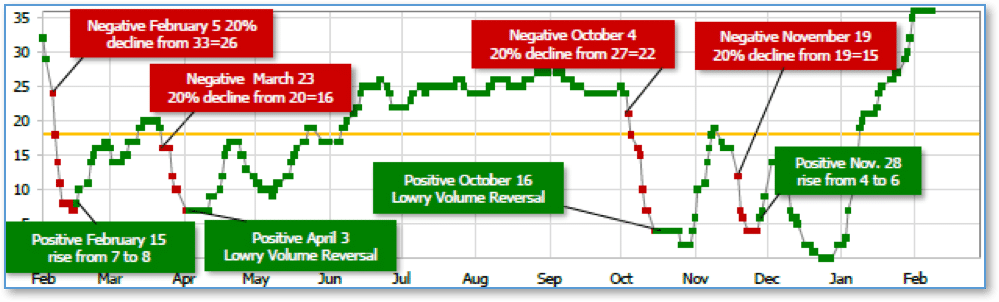
Short Term Trend: Our short term directional indicator is telling the same story. Overbought market – however, overbought markets can last weeks or even months.
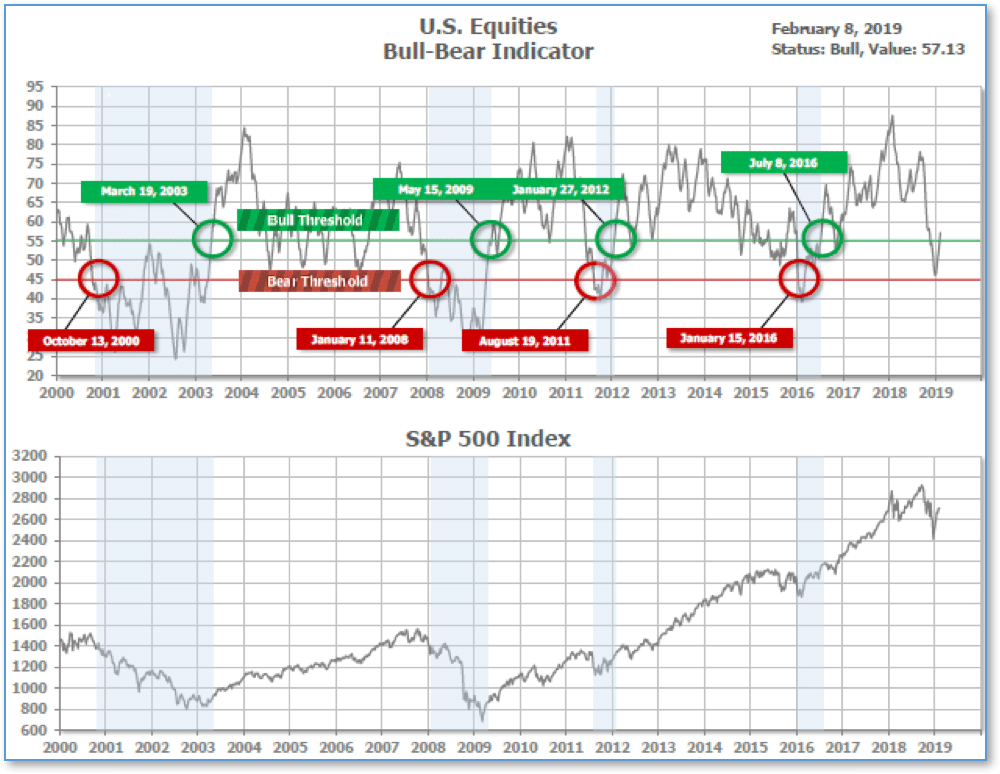
Bull/Bear Market Status
Our long-term bull/bear market trend indicator is still rising, indicating any short term pullbacks in US equities may be a buying opportunity:
S&P Sector Bullish Percent Index:
SHUT vs DIME
The ranking relationship between the defensive SHUT sectors is one way to gauge institutional investor sentiment in the market.
“S”=Staples [a.k.a. consumer non-cyclical]
“H”=Healthcare
“U”=Utilities and
“T”=Telecom
and the offensive DIME sectors:
“D”=Discretionary [a.k.a. Consumer Cyclical]
“I”=Industrial,
“M”=Materials
“E”=Energy
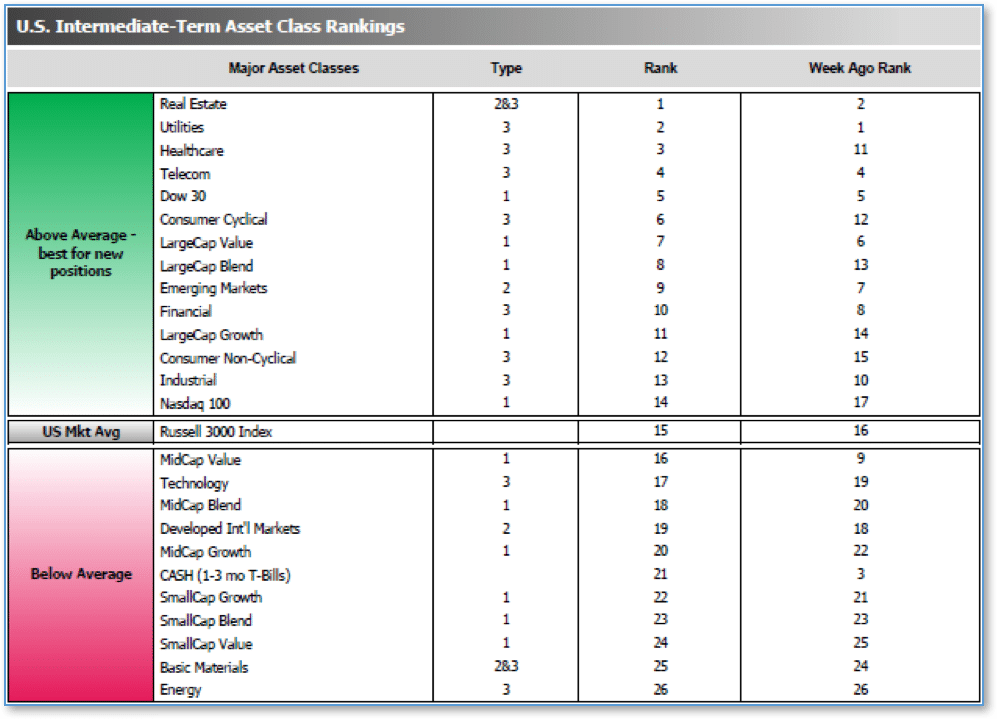
The average ranking of Defensive SHUT sectors rose to 5.25 from the prior week’s 7.50, while the average ranking of Offensive DIME sectors rose to 17.50 from last week’s 18.00. The Defensive SHUT sectors built a bit on their lead over Offensive DIME sectors.
Note: these are “ranks”, not “scores”, so smaller numbers are higher ranks and larger numbers are lower ranks.
Chart of Interest
According to a CBS Evening News instant poll, President Donald Trump’s recent State of the Union address was viewed favorably by almost three quarters of viewers. President Trump touted many of his accomplishments in his first 2 years in office.
Chief among them is his rightful claim to a bustling economy. Nonetheless, in the normal ebb and flow of the large U.S. economy, there will always be a few sectors that fare less well even in the best of times.
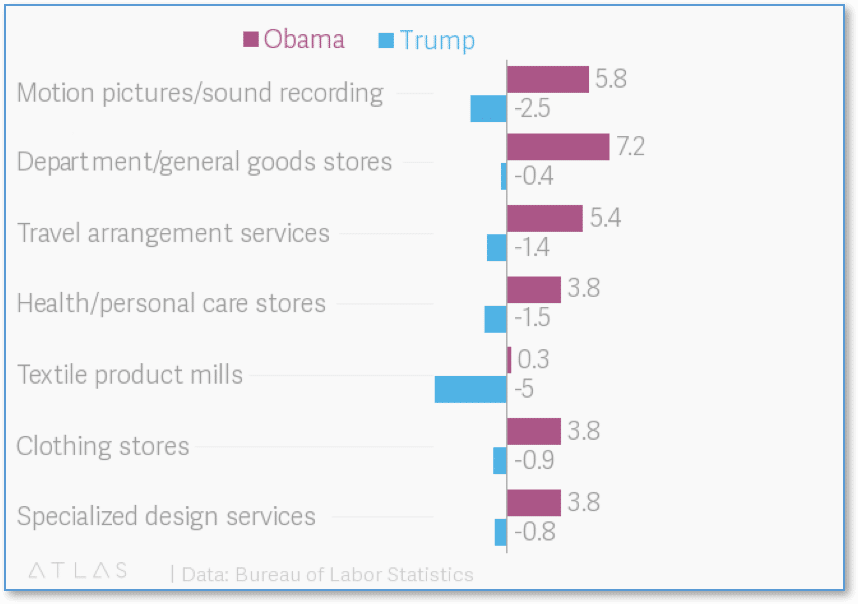
So, as an antidote to all the usual State of the Union bragging (and not to take anything away from President Trump and his rightful claims), here are a handful of sectors that have actually shrunk under Trump (visual from Atlas.com, data from the Bureau of Labor Statistics).
Note that all but one are retail stores or services. The only goods-producing sector on the list is “Textile product mills”, perhaps reflecting Trump’s emphasis on restoring U.S. manufacturing to global preeminence.
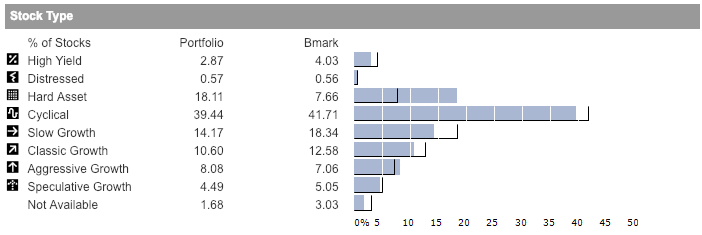
Riverbend Model Portfolio Allocation:
(as of 2/1/19)
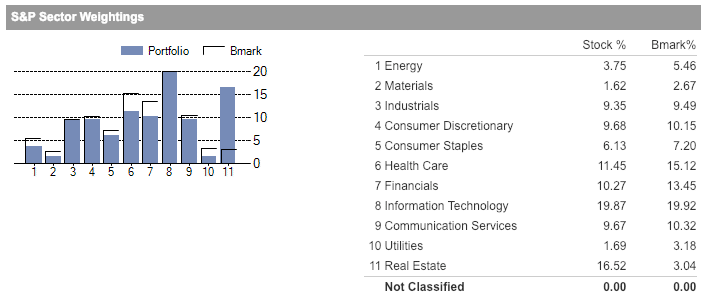
 Source: Morningstar
(sources: all index return data from Yahoo Finance; Reuters, Barron’s, Wall St Journal, Bloomberg.com, ft.com, guggenheimpartners.com, ritholtz.com, markit.com, financialpost.com, Eurostat, Statistics Canada, Yahoo! Finance, stocksandnews.com, marketwatch.com, wantchinatimes.com, BBC, 361capital.com, pensionpartners.com, cnbc.com, FactSet; Figs 1-5 source W E Sherman & Co, LLC)
© 2019 Riverbend Investment Management, LLC. This presentation is intended for informational purposes only.
The information and statistical data contained herein have been obtained from sources we believe to be reliable but in no way are warranted by us as to accuracy or completeness. The opinions expressed are those of Riverbend Investment Management, LLC. and are subject to change without notice. No part of this presentation may be reproduced in any manner without the written permission of Riverbend Investment Management, LLC. Any securities discussed should not be construed as a recommendation to buy or sell and there is no guarantee that these securities will be held for a client’s account nor should it be assumed that they were or will be profitable. Past performance does not guarantee future comparable results.
Riverbend Investment Management, LLC is a Registered Investment Adviser
ADV II available upon request
Riverbend Investment Management, LLC
1818 Library Street, Suite 500
Reston VA 20190
Tel:703-349-6327
www.riverbendinvestments.com


