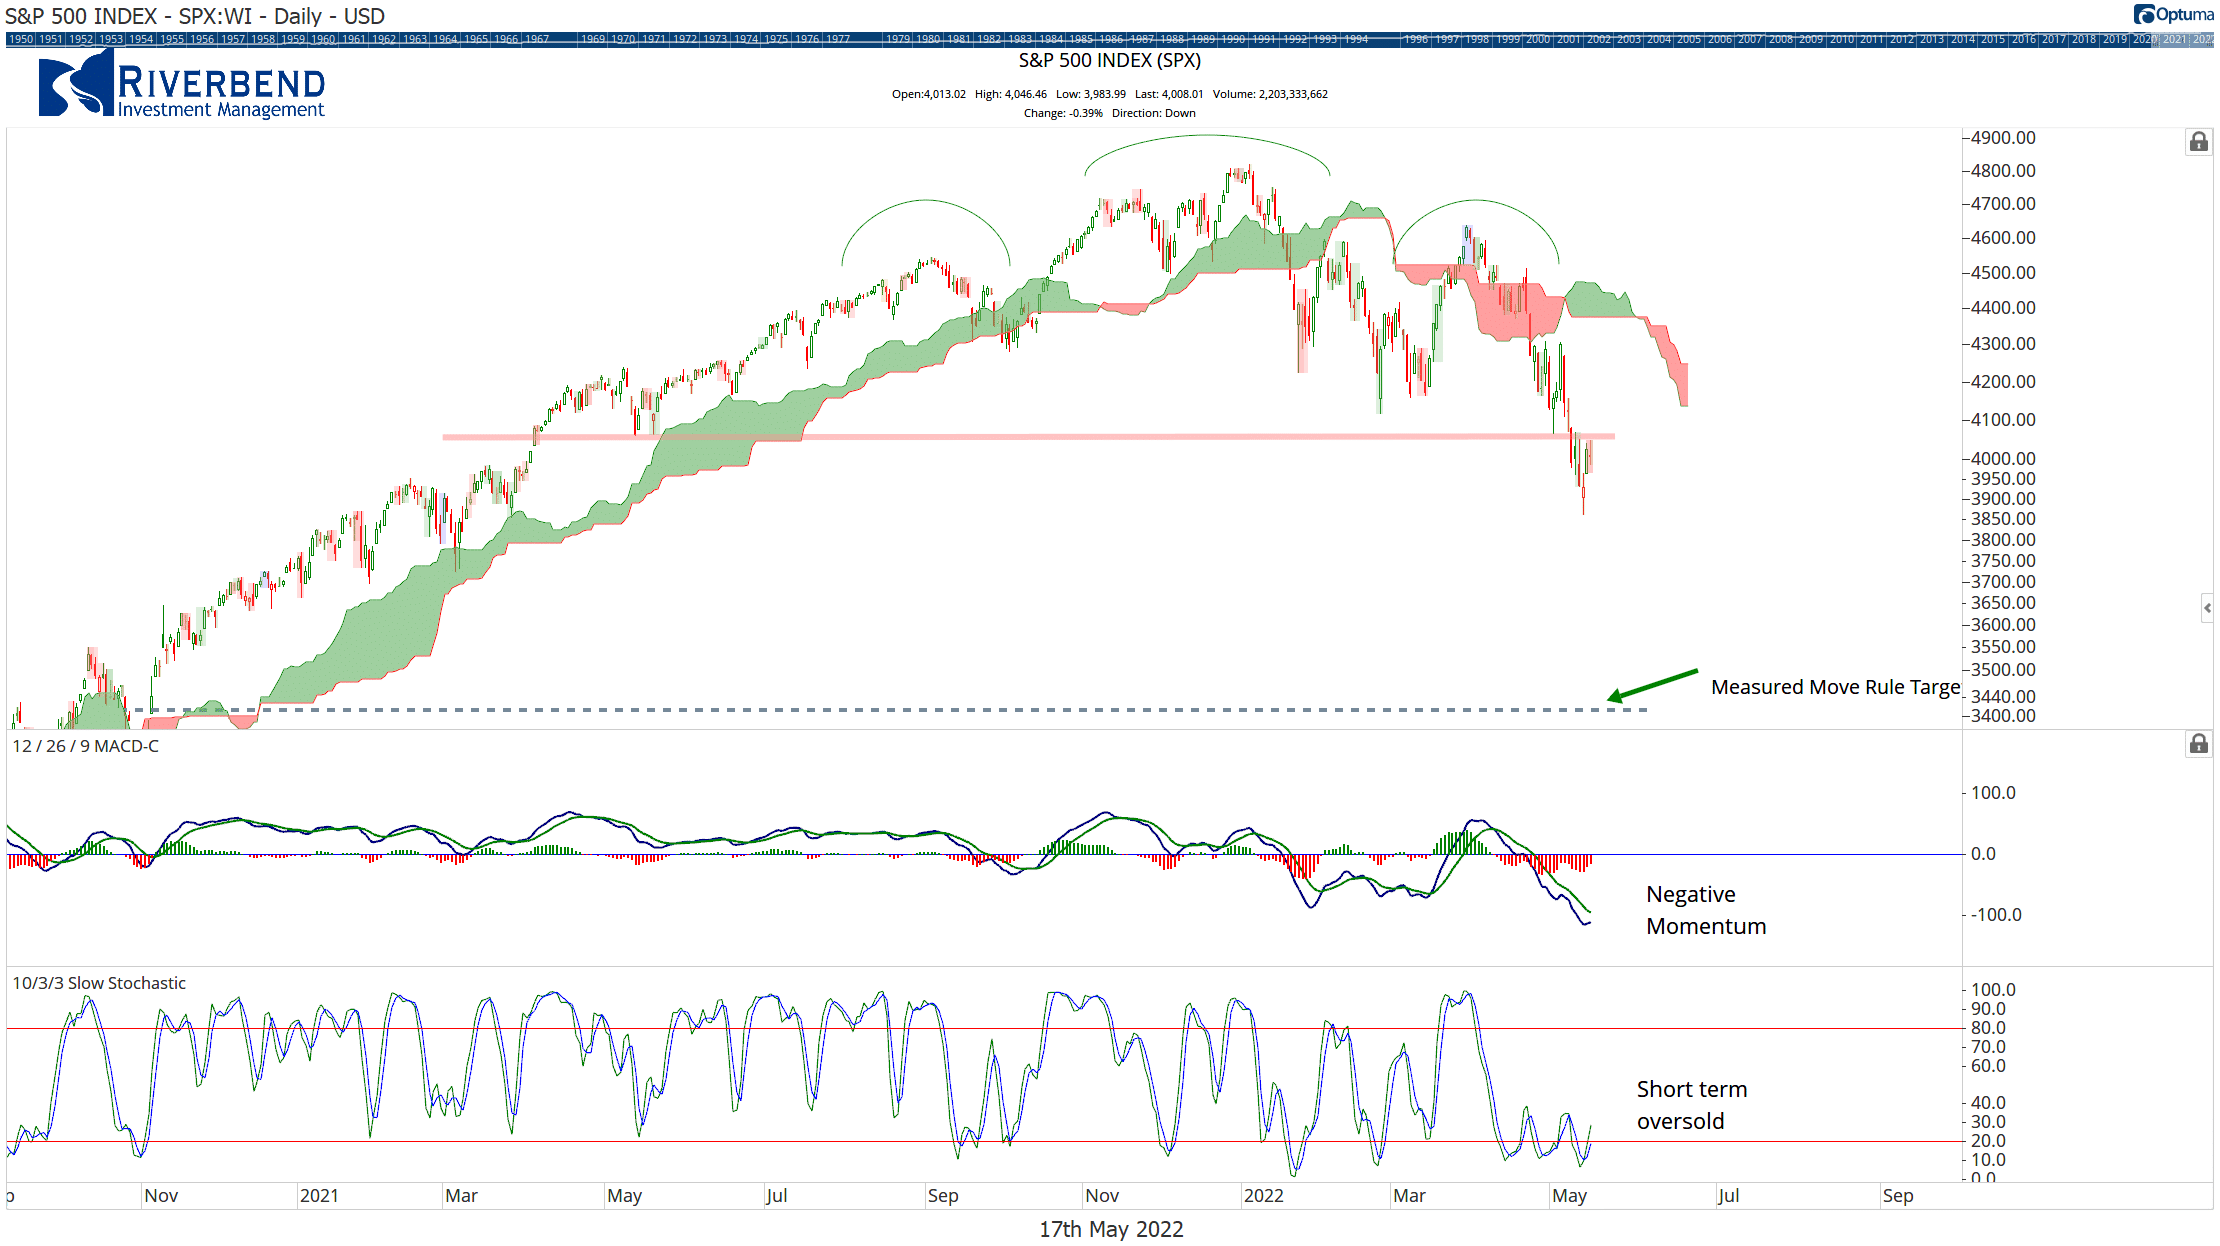
Last week equities continued their decline. The S&P 500 index declined another 2.4% while the tech-heavy NASDAQ finished the week down 2.8%.
The market is now short-term oversold. I expect to see some sort of bounce; however, this will most likely be short-term in nature and may provide an opportunity for those who are still invested in the market to move to cash.
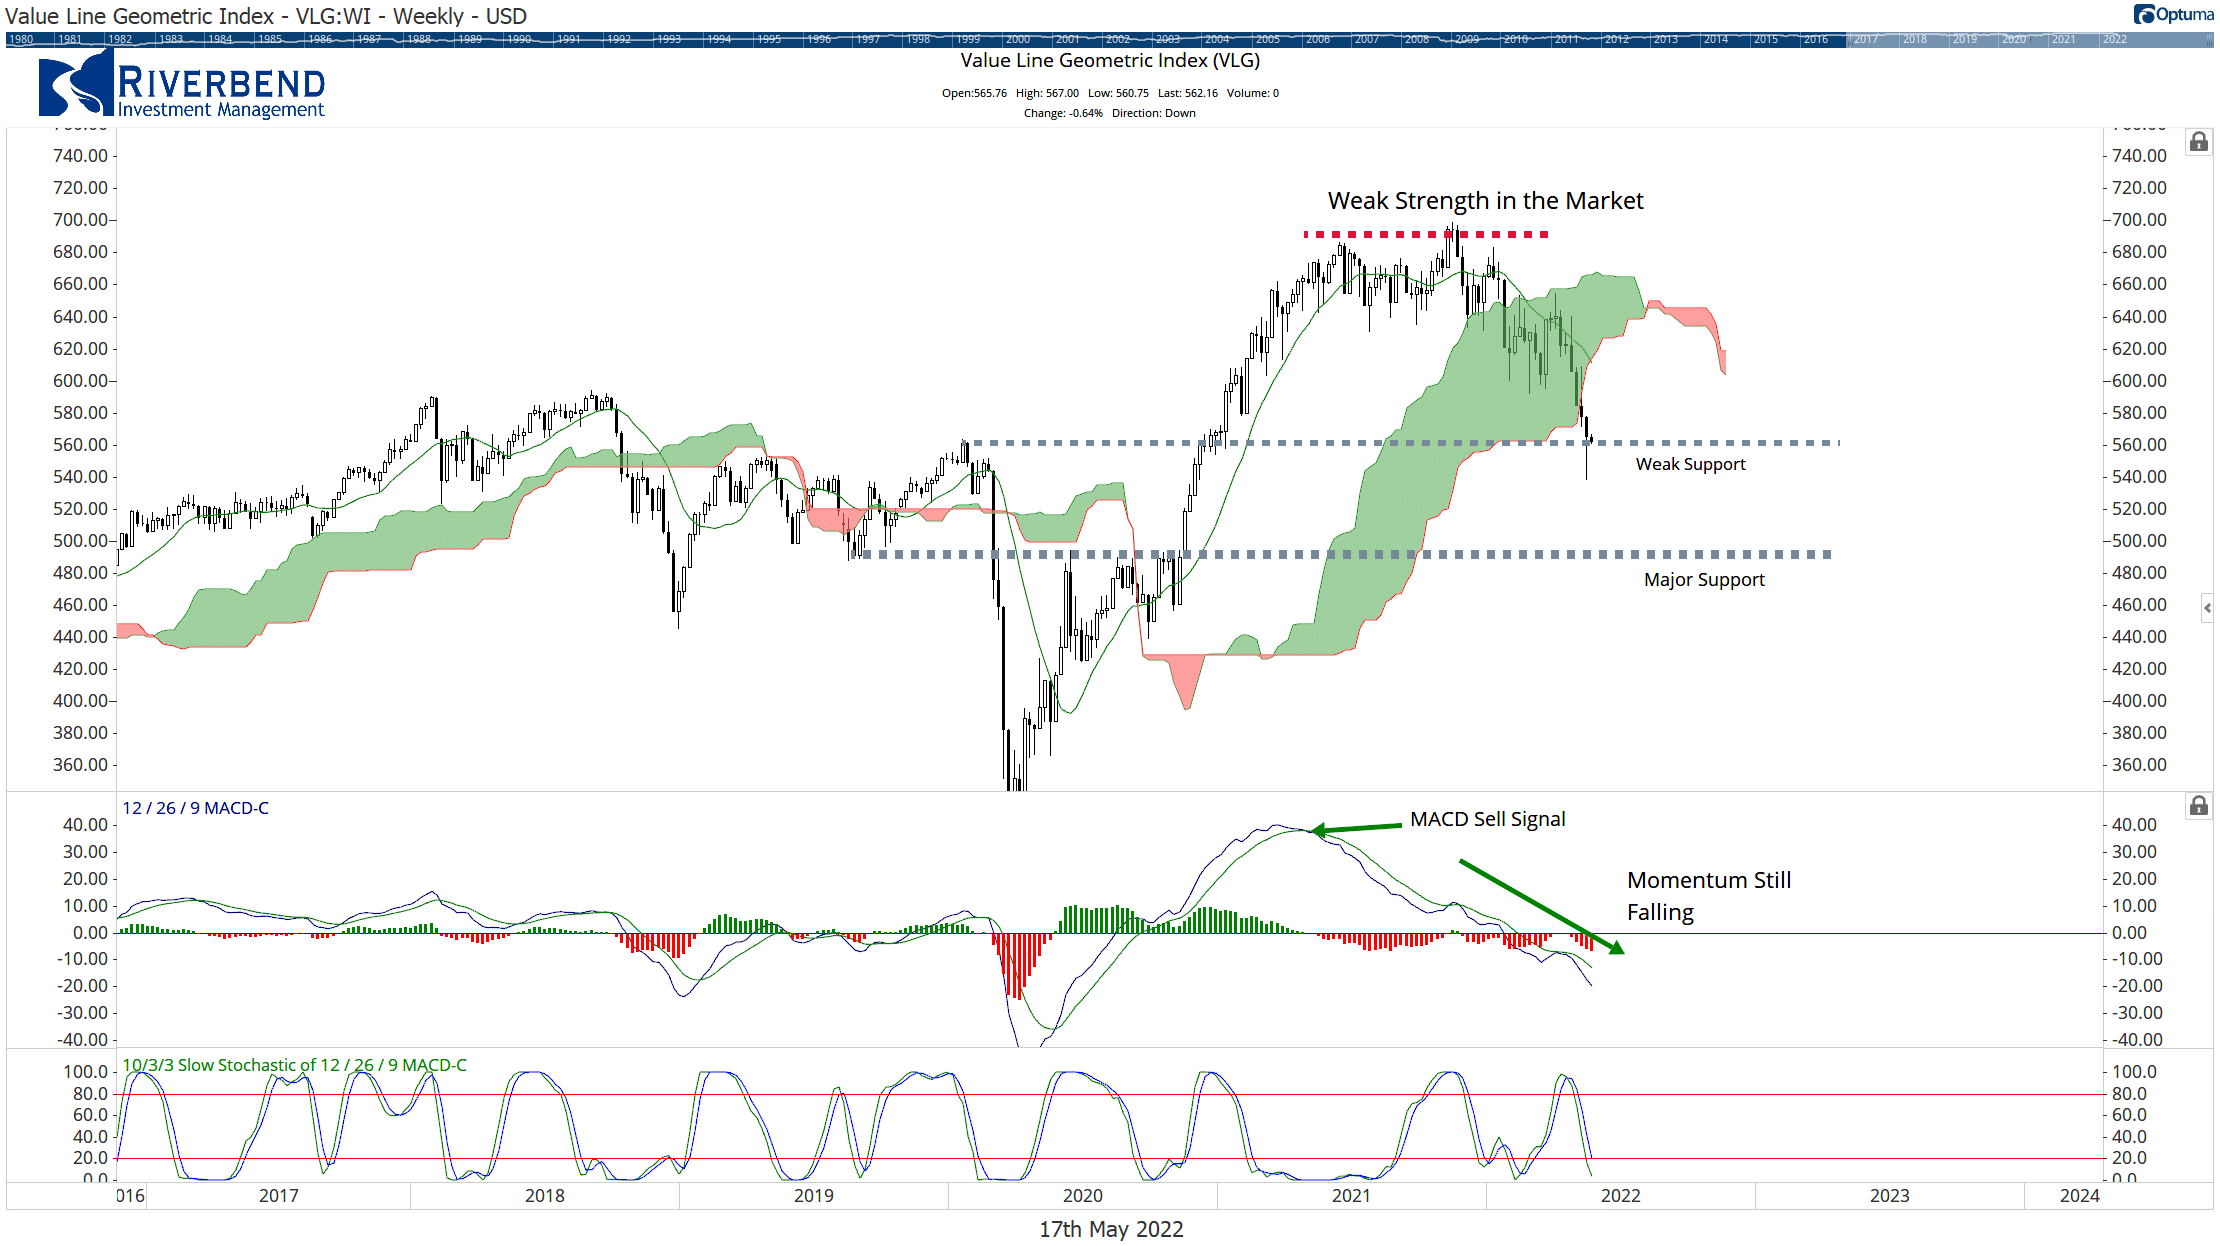
Taking a broader look at the market, the Value Line Geometric Index (an equal-weighted index of 1681 companies) is still in decline and showing an increased level of negative momentum.
We would want to see buy signals in this index as an indication that the broader market is starting to recover.
Another area of the market to keep a close eye on is market breadth.
The chart below shows the percentage of stocks trading above their respected 200-day moving average.
Roughly, only 31% of stocks within the S&P 500 are trading above their 200-day moving average. While this may seem like a small amount, past market declines have ended when levels were lower.
For now, the weight of the evidence is still suggesting a weak market. As a result, our portfolios continue to remain in cash and/or hedged.
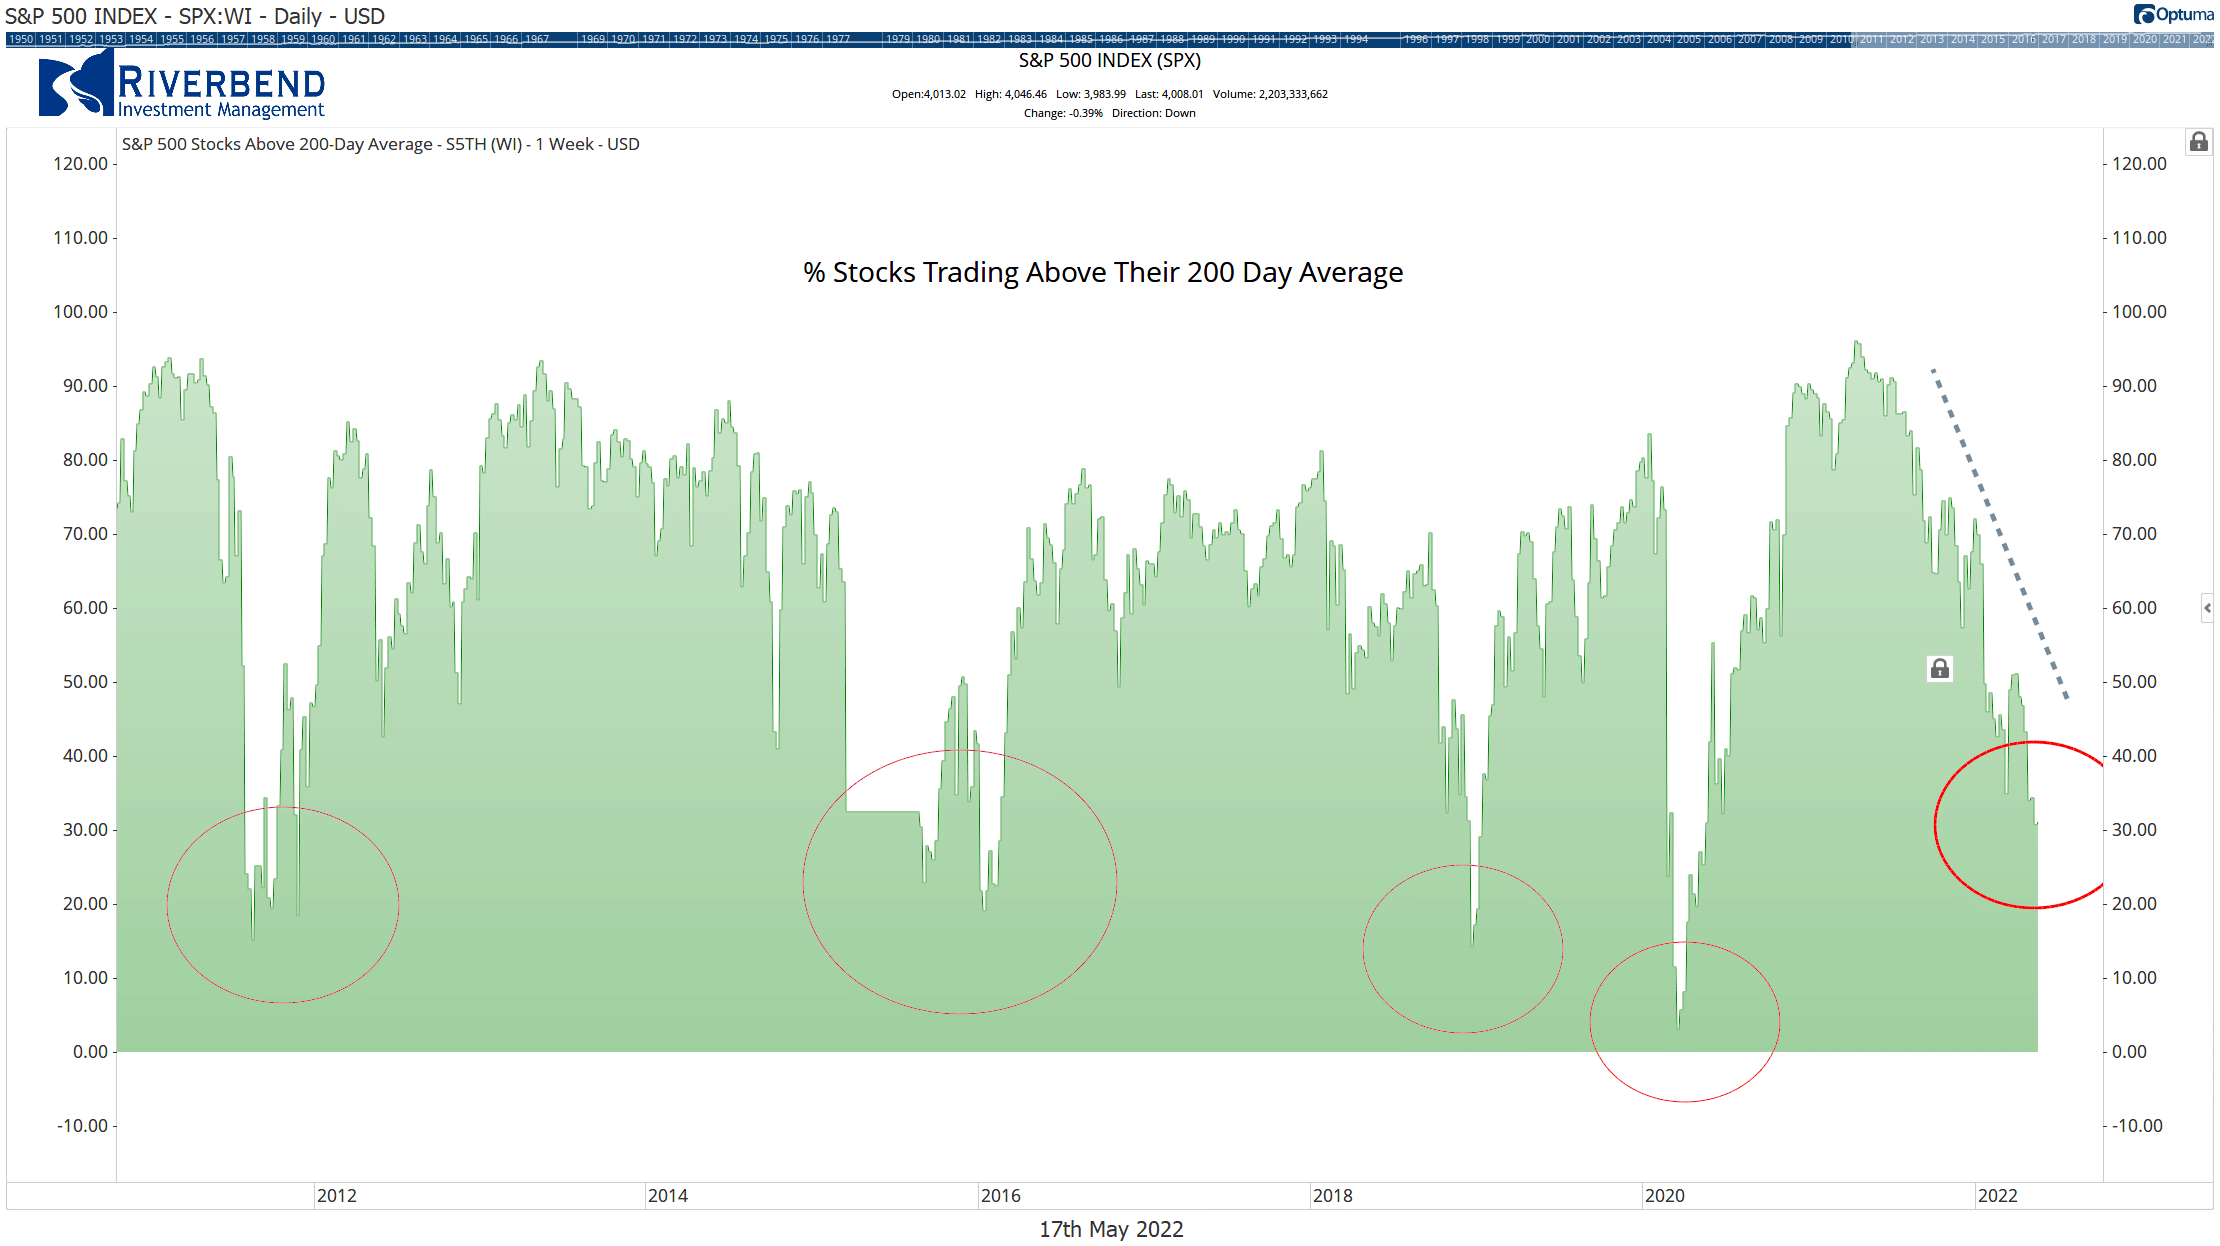
Chart of the Week:
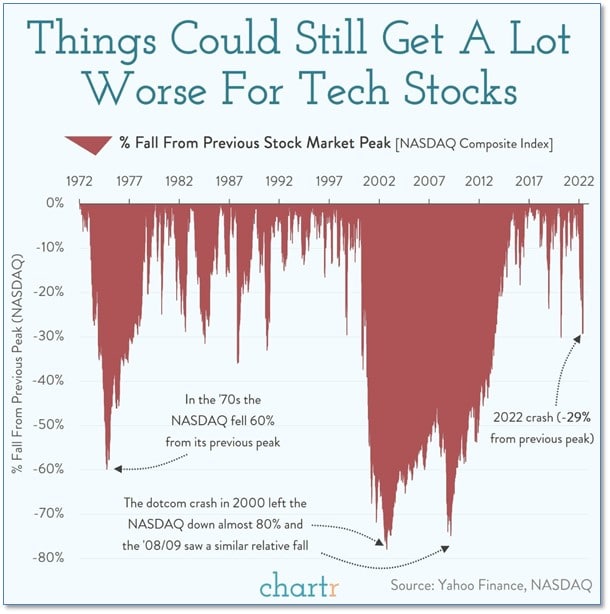
Usually, it’s a newsworthy event when the price of a well-known tech company falls by more than 10% in a week’s time.
However, in the last few weeks, almost every single day has seen multiple major technology bellwethers taking double-digit losses.
So how bad can this get?
Analysts at Chartr combed through 50 years of daily data from the NASDAQ Composite to get perspective on how bad the current sell-off has been—and how much worse could it get.
So far the NASDAQ is down 29% from its previous peak—officially in bear market territory. However, this decline isn’t even close to the 70%-80% declines seen during the bursting of the dot.com bubble in 2000 and the financial crisis of 2008.
Riverbend Indicators:
- As a reading of our Bull-Bear Indicator for U.S. Equities (comparative measurements over a rolling one-year timeframe), we remain in Cyclical Bull territory.
- Counting up the number of all our indicators that are ‘Up’ for U.S. Equities, the current tally is that one of four is Positive (suggesting a short term bounce), representing a multitude of timeframes (two that can be solely days/weeks, or months+ at a time; another, a quarter at a time; and lastly, the {typically} years-long reading, that being the Cyclical Bull or Bear status).
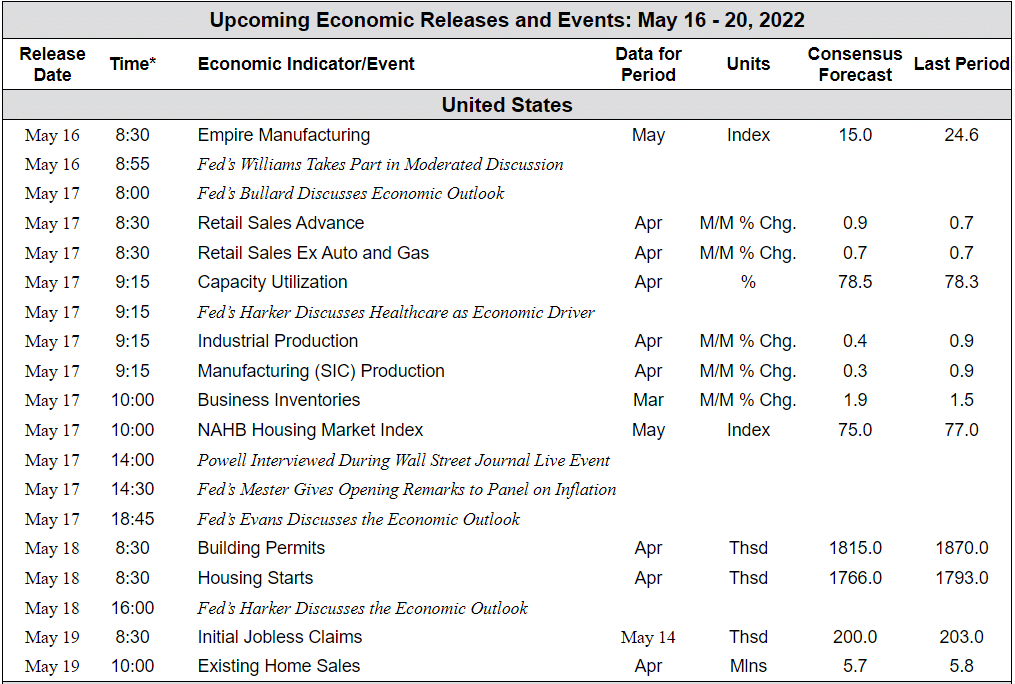
The Week Ahead: