[fusion_builder_container hundred_percent=”no” equal_height_columns=”no” menu_anchor=”” hide_on_mobile=”small-visibility,medium-visibility,large-visibility” class=”” id=”” background_color=”” background_image=”” background_position=”center center” background_repeat=”no-repeat” fade=”no” background_parallax=”none” parallax_speed=”0.3″ video_mp4=”” video_webm=”” video_ogv=”” video_url=”” video_aspect_ratio=”16:9″ video_loop=”yes” video_mute=”yes” overlay_color=”” video_preview_image=”” border_size=”” border_color=”” border_style=”solid” padding_top=”” padding_bottom=”” padding_left=”” padding_right=””][fusion_builder_row][fusion_builder_column type=”1_1″ layout=”1_1″ background_position=”left top” background_color=”” border_size=”” border_color=”” border_style=”solid” border_position=”all” spacing=”yes” background_image=”” background_repeat=”no-repeat” padding_top=”” padding_right=”” padding_bottom=”” padding_left=”” margin_top=”0px” margin_bottom=”0px” class=”” id=”” animation_type=”” animation_speed=”0.3″ animation_direction=”left” hide_on_mobile=”small-visibility,medium-visibility,large-visibility” center_content=”no” last=”no” min_height=”” hover_type=”none” link=””][fusion_text]
[fusion_vimeo id=”604138047″ alignment=”center” width=”1000″ height=”” autoplay=”false” api_params=”” hide_on_mobile=”small-visibility,medium-visibility,large-visibility” class=”” css_id=”” /][fusion_text][fusion_text][fusion_text][fusion_text]
U.S. Markets: 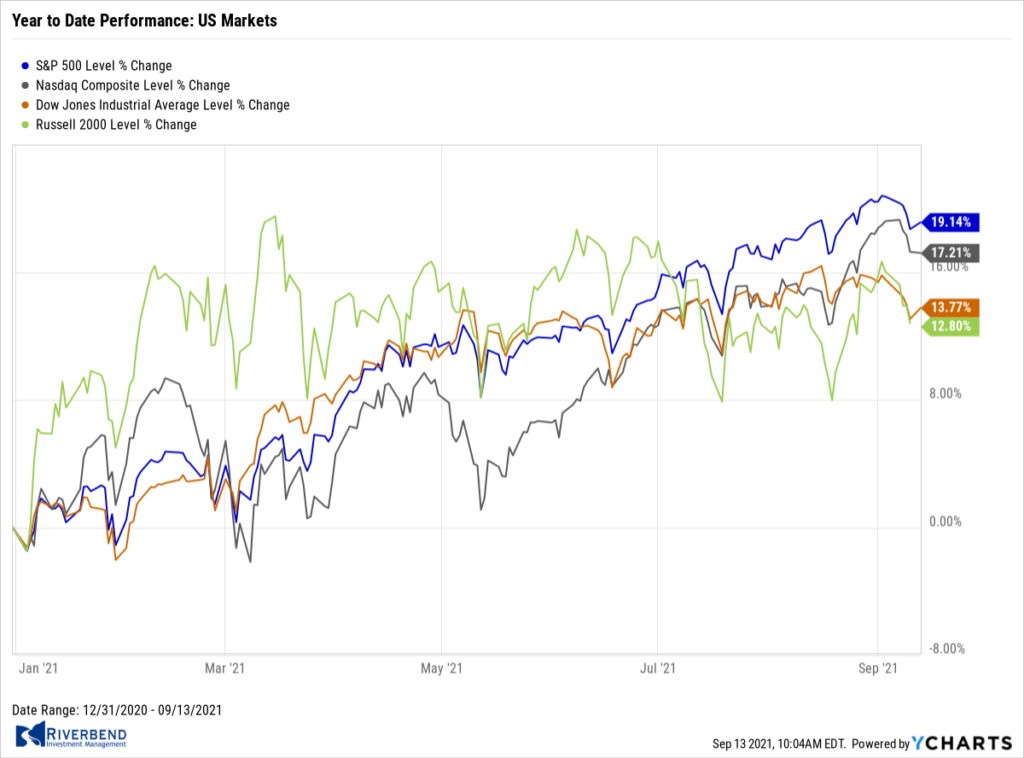
The major U.S. indexes retreated over the holiday-shortened week; the small cap Russell 2000 index fared the worst among the indexes following two weeks of outperformance.
The Dow Jones Industrial Average shed 761 points to finish the week at 34,608—a decline of -2.2%. The technology-heavy Nasdaq Composite gave up 248 points to 15,115—a decline of -1.6%.
By market cap, the large cap S&P 500 retreated -1.7%, while the mid cap S&P 400 and Russell 2000 declined ‑2.7% and -2.8%, respectively.
International Markets: 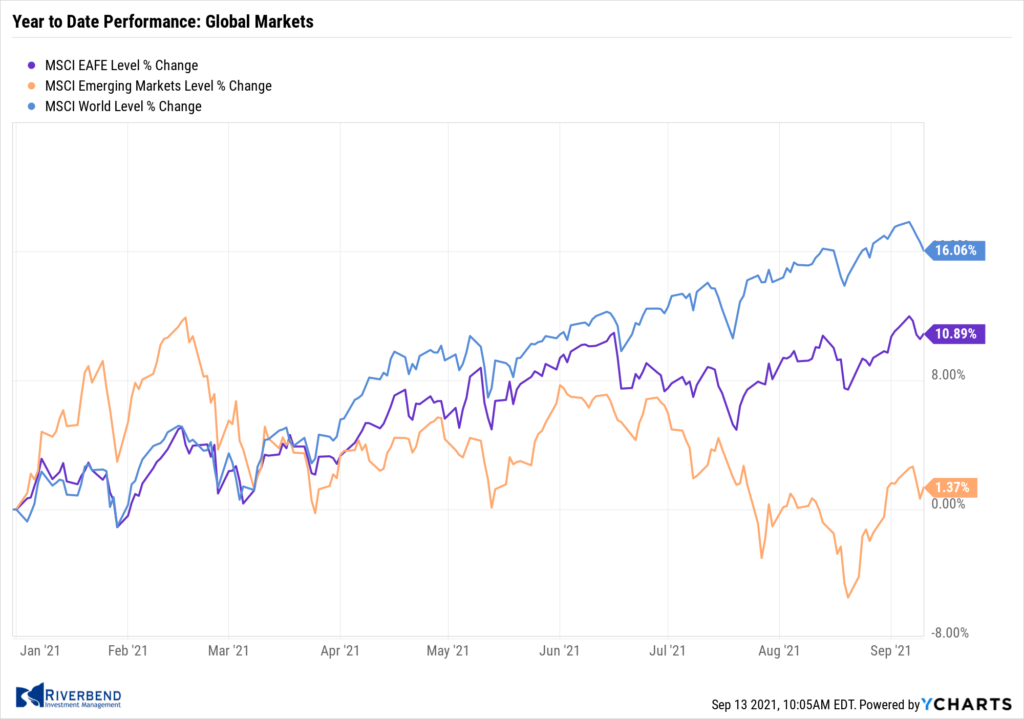
Except in the Far East, international markets were mostly down for the week.
Canada’s TSX retraced last week’s gain ending down -0.9%. In Europe, the United Kingdom’s FTSE 100 retreated -1.5%, France’s CAC 40 shed -0.4% and Germany’s DAX declined -1.5%.
However, in Asia, China’s Shanghai Composite surged 3.4% and Japan’s Nikkei vaulted 4.3%.
As grouped by Morgan Stanley Capital International, developed markets ended down ‑1.1% and emerging markets gave up -1.2%.
Commodities: 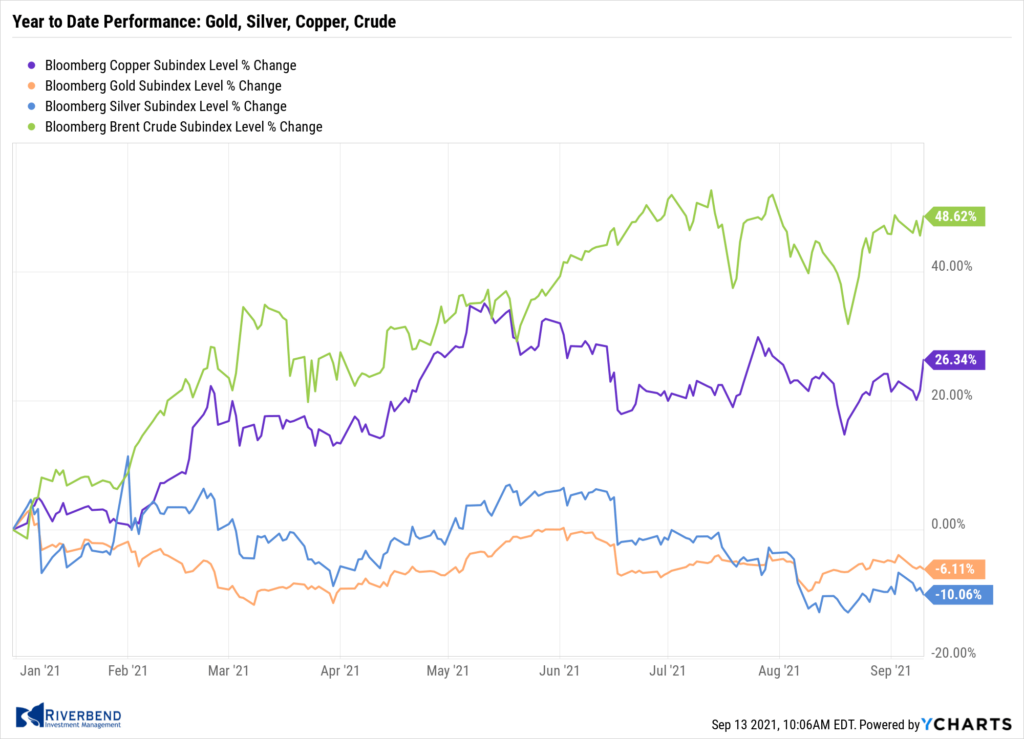
Precious metals declined last week with Gold giving up -2.3% to $1792.10 per ounce and Silver losing ‑3.6% to $23.90.
Energy finished the week up. West Texas Intermediate crude oil finished the week up 0.6% to $69.72 per barrel.
Perhaps the one bright spot in last week’s metals trading was the industrial metal copper, viewed by some analysts as a barometer of world economic health due to its wide variety of uses, which finished the week up 2.7%.
U.S. Economic News: 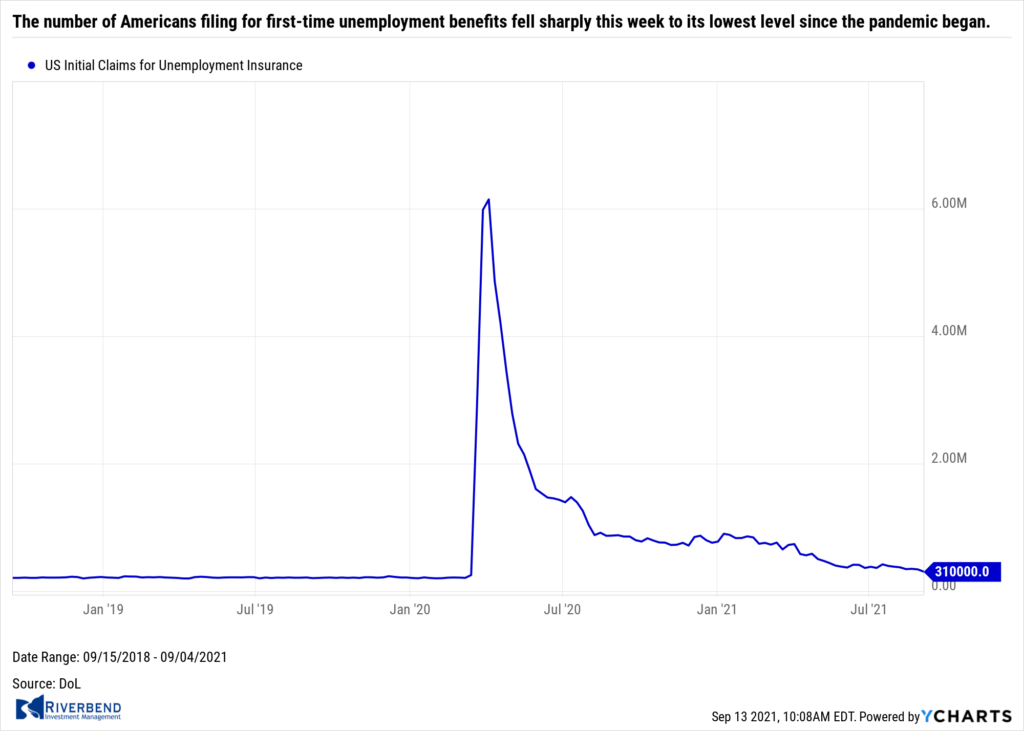
The number of Americans filing for first-time unemployment benefits fell sharply this week to its lowest level since the pandemic began. The Labor Department reported initial jobless claims fell by 35,000 to 310,000.
Economists had forecast new claims would total 335,000. Claims have fallen steadily since mid-July. Analysts state the reading is a sign businesses remain confident about the future. Meanwhile, the number of people already collecting benefits, known as continuing claims, slid by 22,000 to 2.78 million. That number is also at a pandemic-era low.
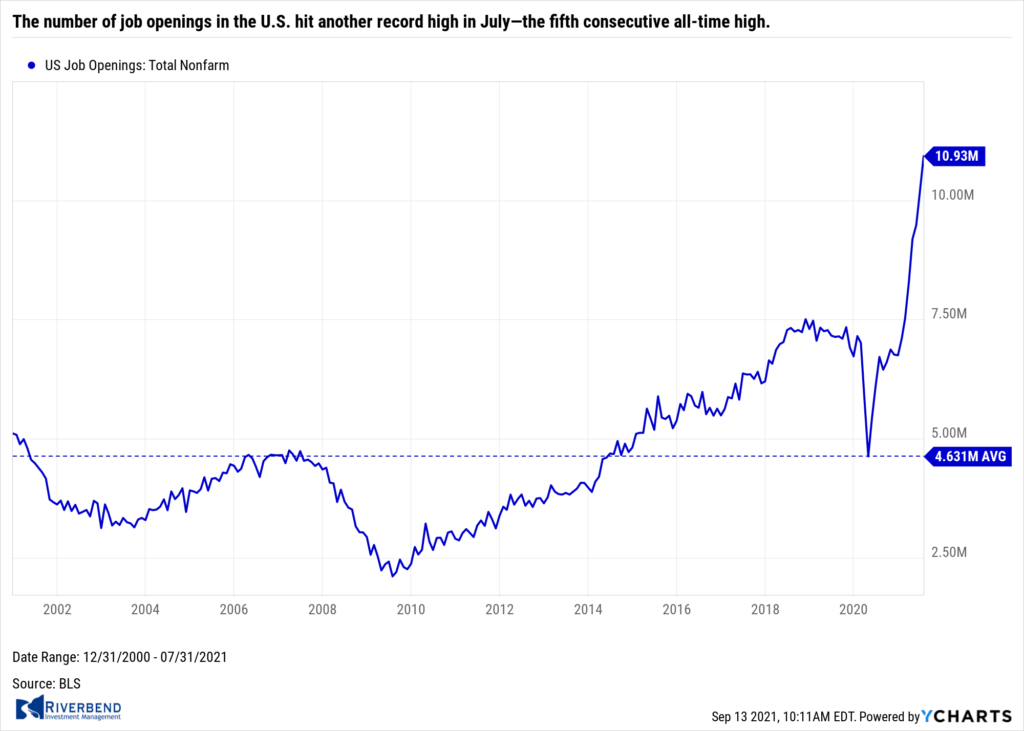 The number of job openings in the U.S. hit another record high in July—the fifth consecutive all-time high. The Labor Department reported job openings hit a record 10.9 million in July. Economists had forecast 10.1 million openings. For the first time in history, the ratio of people unemployed to job openings fell to less than 0.8:1. Not all sectors were impacted equally. Openings fell in construction, trade, transportation and utilities.
Of note, the “quits rate”, rumored to be the Federal Reserve’s preferred measure of the labor market as it assumes one would only quit a job in favor of a more lucrative one, ticked up to 3.1%. Labor market analysts don’t expect the demand in hiring to slow anytime soon. Lydia Boussour, economist at Oxford Economics wrote in a note to clients, “Given red-hot labor demand and rising wage growth, the jobs recovery seems unlikely to go into reverse. We expect the pace of hiring will reaccelerate modestly this fall as the delta coronavirus wave recedes and labor constraints start to ease.”
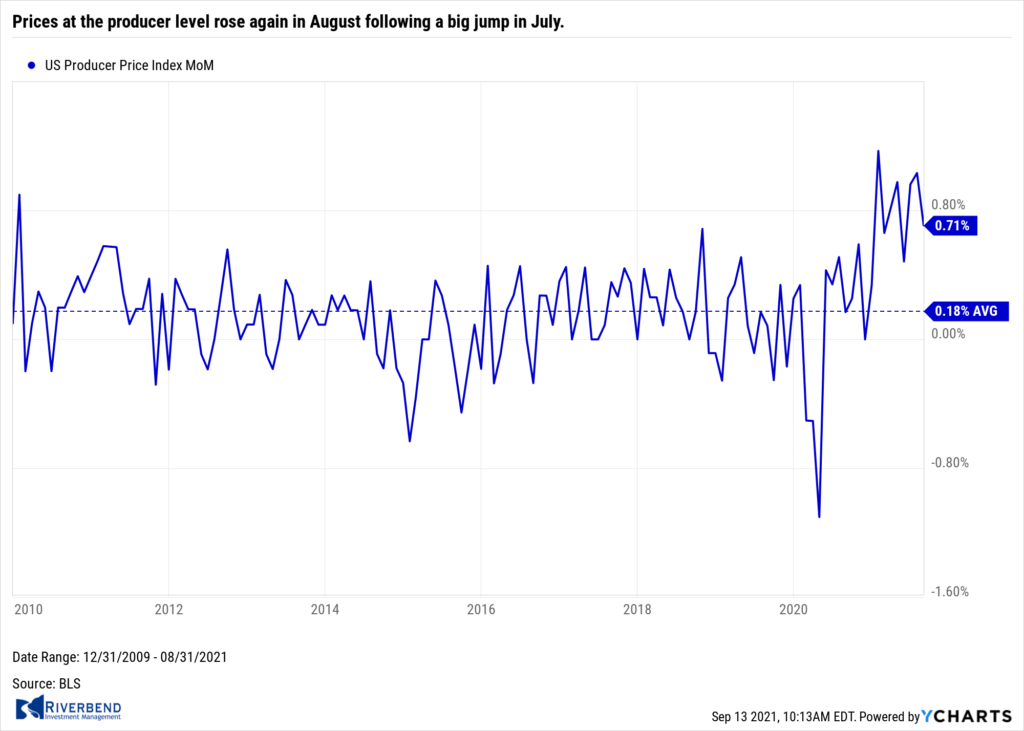 Prices at the producer level rose again in August following a big jump in July. The Bureau of Labor Statistics reported the U.S. producer price index rose 0.7% in August. Economists had expected a 0.6% advance. From the same period last year, producer prices were up 8.3%–its largest gain since the data was first collected in 2010. Core prices, which exclude food and energy, were up 0.3%.
Inflation remains well above the Federal Reserve’s 2% annual target. Producers are still struggling with shortages, bottlenecks and transportation difficulties in the wake of the coronavirus pandemic.
The Federal Reserve’s ‘Beige Book’—a collection of anecdotal economic reports from each of its member banks—reported economic growth is slowing as the ‘delta variant’ hits tourism and restaurants. The worsening situation surrounding the COVID-19 pandemic prompted a pullback in dining out and travel, the Fed reported.
Notably, businesses reported they weren’t encountering difficulty in raising prices to consumers to account for the higher costs they were incurring. Some businesses suggested Americans could see ‘significant hikes’ in prices in the coming months. Businesses remained optimistic, although concerned, about continuing supply disruptions and labor shortages, especially in the West and Midwest.
Chart of the Week: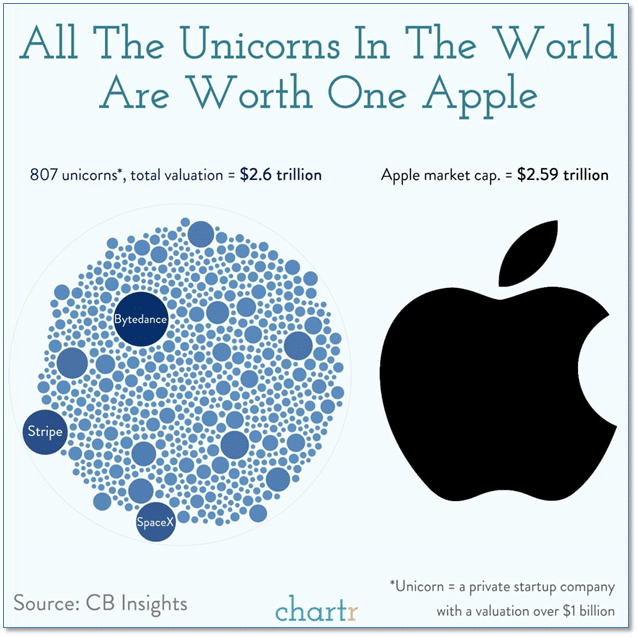
A “unicorn” in business is a startup with a valuation of a billion dollars or more – so-called because they used to be “as rare as a unicorn”.
Not any longer!
Floods of startups and even bigger floods of venture capital have resulted in more than 800 private startups with valuations of a billion dollars or more. Some recent “hotties” are the likes of Stripe, SpaceX, Bytedance and Epic Games.
Adding up the current valuations of all 800+ unicorns comes to a staggering $2.6 trillion!
A sobering thought is that all of those 800 unicorns add up to…1 Apple!
Riverbend Indicators:

Each week we post notable changes to the various market indicators we follow.
- As a reading of our Bull-Bear Indicator for U.S. Equities (comparative measurements over a rolling one-year timeframe), we remain in Cyclical Bull territory.
- Counting up of the number of all our indicators that are ‘Up’ for U.S. Equities, the current tally is that four of four are Positive, representing a multitude of timeframes (two that can be solely days/weeks, or months+ at a time; another, a quarter at a time; and lastly, the {typically} years-long reading, that being the Cyclical Bull or Bear status).
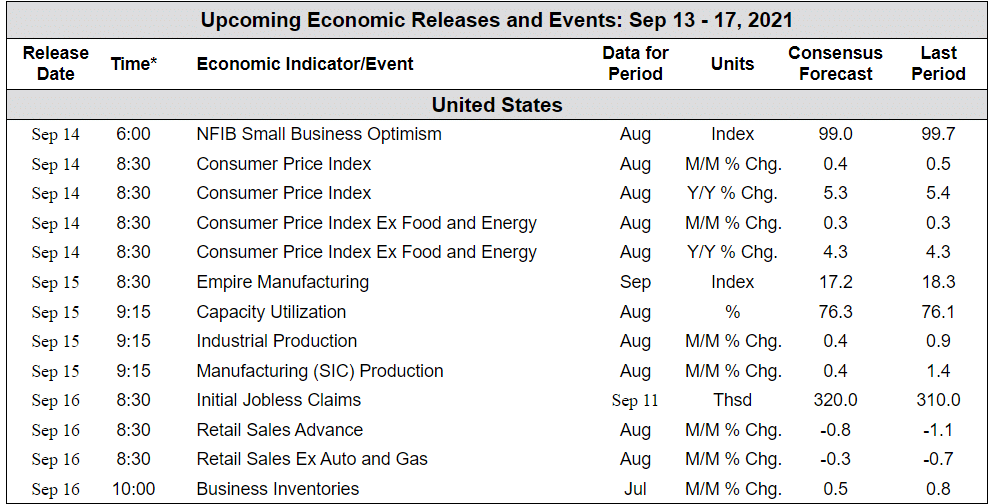
The Week Ahead:
(Sources: All index- and returns-data from Yahoo Finance; news from Reuters, Barron’s, Wall St. Journal, Bloomberg.com, ft.com, guggenheimpartners.com, zerohedge.com, ritholtz.com, markit.com, financialpost.com, Eurostat, Statistics Canada, Yahoo! Finance, stocksandnews.com, marketwatch.com, wantchinatimes.com, BBC, 361capital.com, pensionpartners.com, cnbc.com, FactSet.)
[/fusion_text][/fusion_builder_column][/fusion_builder_row][/fusion_builder_container]


