[fusion_builder_container hundred_percent=”no” equal_height_columns=”no” menu_anchor=”” hide_on_mobile=”small-visibility,medium-visibility,large-visibility” class=”” id=”” background_color=”” background_image=”” background_position=”center center” background_repeat=”no-repeat” fade=”no” background_parallax=”none” parallax_speed=”0.3″ video_mp4=”” video_webm=”” video_ogv=”” video_url=”” video_aspect_ratio=”16:9″ video_loop=”yes” video_mute=”yes” overlay_color=”” video_preview_image=”” border_size=”” border_color=”” border_style=”solid” padding_top=”” padding_bottom=”” padding_left=”” padding_right=””][fusion_builder_row][fusion_builder_column type=”1_6″ layout=”1_6″ spacing=”” center_content=”no” link=”” target=”_self” min_height=”” hide_on_mobile=”small-visibility,medium-visibility,large-visibility” class=”” id=”” hover_type=”none” border_size=”0″ border_color=”” border_style=”solid” border_position=”all” border_radius=”” box_shadow=”no” dimension_box_shadow=”” box_shadow_blur=”0″ box_shadow_spread=”0″ box_shadow_color=”” box_shadow_style=”” padding_top=”” padding_right=”” padding_bottom=”” padding_left=”” margin_top=”” margin_bottom=”” background_type=”single” gradient_start_color=”” gradient_end_color=”” gradient_start_position=”0″ gradient_end_position=”100″ gradient_type=”linear” radial_direction=”center” linear_angle=”180″ background_color=”” background_image=”” background_image_id=”” background_position=”left top” background_repeat=”no-repeat” background_blend_mode=”none” animation_type=”” animation_direction=”left” animation_speed=”0.3″ animation_offset=”” filter_type=”regular” filter_hue=”0″ filter_saturation=”100″ filter_brightness=”100″ filter_contrast=”100″ filter_invert=”0″ filter_sepia=”0″ filter_opacity=”100″ filter_blur=”0″ filter_hue_hover=”0″ filter_saturation_hover=”100″ filter_brightness_hover=”100″ filter_contrast_hover=”100″ filter_invert_hover=”0″ filter_sepia_hover=”0″ filter_opacity_hover=”100″ filter_blur_hover=”0″ last=”no”][/fusion_builder_column][fusion_builder_column type=”2_3″ layout=”1_1″ background_position=”left top” background_color=”” border_size=”” border_color=”” border_style=”solid” border_position=”all” spacing=”yes” background_image=”” background_repeat=”no-repeat” padding_top=”” padding_right=”” padding_bottom=”” padding_left=”” margin_top=”0px” margin_bottom=”0px” class=”” id=”” animation_type=”” animation_speed=”0.3″ animation_direction=”left” hide_on_mobile=”small-visibility,medium-visibility,large-visibility” center_content=”no” last=”no” min_height=”” hover_type=”none” link=””][fusion_text columns=”” column_min_width=”” column_spacing=”” rule_style=”default” rule_size=”” rule_color=”” hide_on_mobile=”small-visibility,medium-visibility,large-visibility” class=”” id=”” animation_type=”” animation_direction=”left” animation_speed=”0.3″ animation_offset=””]
Economics is often called the “dismal science” in part because of its poor track record at making predictions. Perhaps the biggest reason for this is the difficulty in determining whether something is a new trend or a temporary event.
This has been the case for inflation forecasts not only over the past two years — but since at least the global financial crisis. What’s different this time is that rapid inflation is rattling markets and consumers alike. How should investors adjust to a world of rising prices for the first time in decades?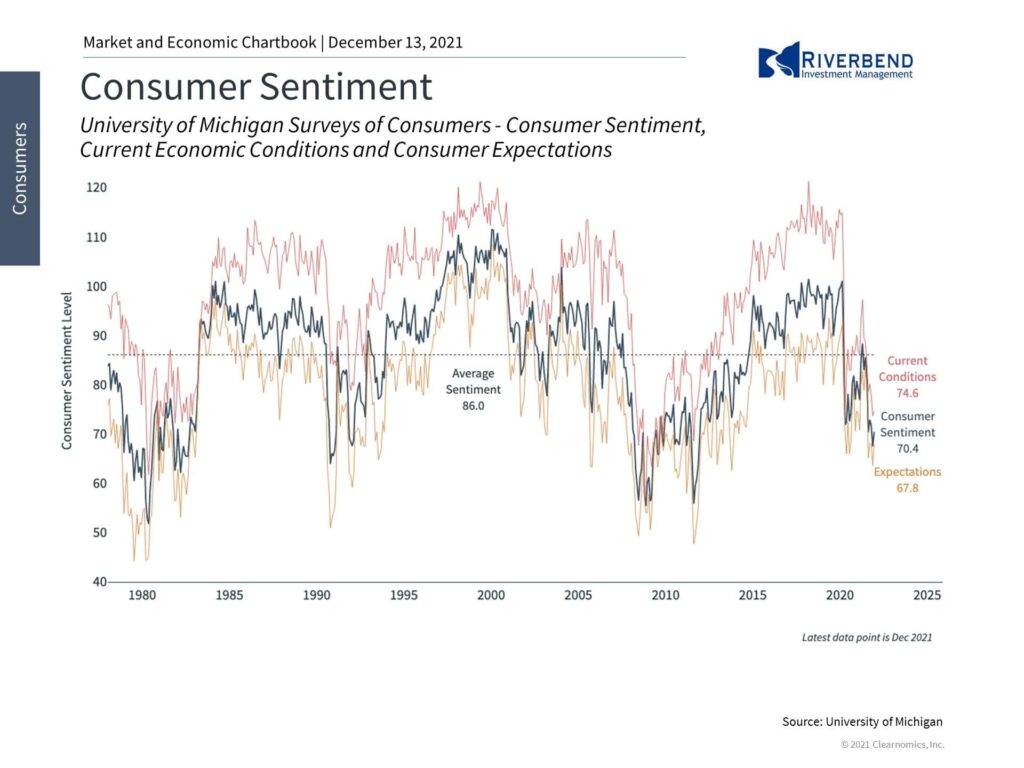
Last week’s Consumer Price Index showed that headline inflation grew by 6.8% in November compared to a year earlier, and 4.9% when food and energy costs are excluded. This is more evidence that prices could rise faster than expected for some time.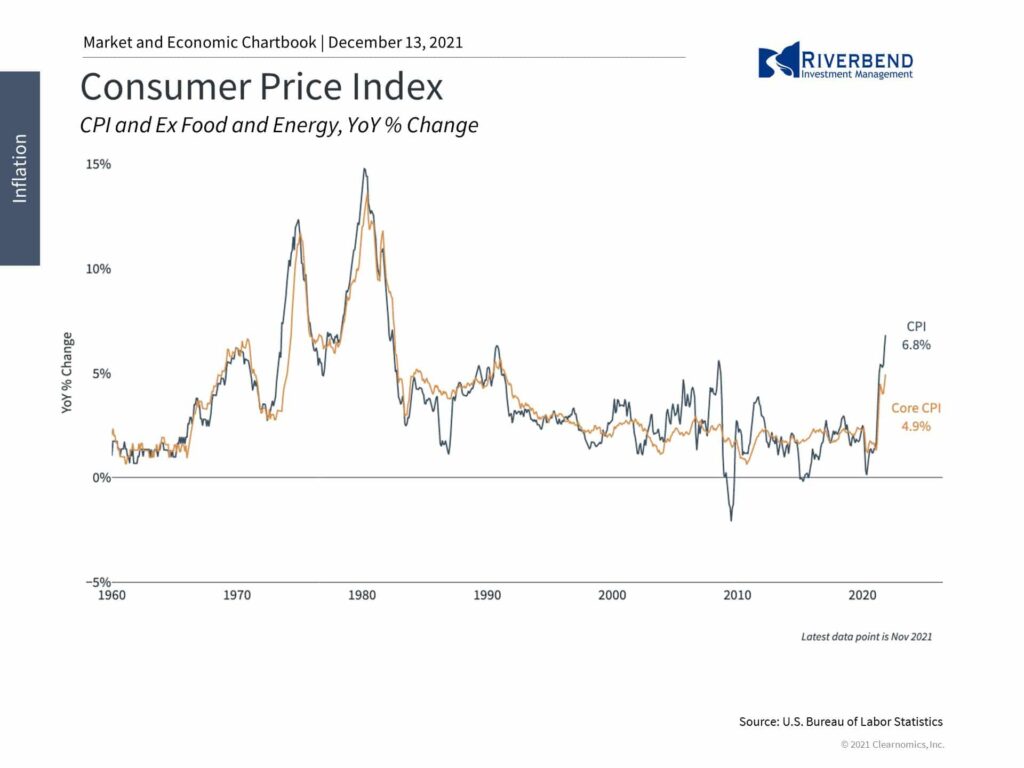
Nearly all components of the index contributed to higher prices, including the cost of energy, cars, and meat. This is the fastest rate of price increases in nearly four decades and an acceleration from last month’s reading of 6.2%.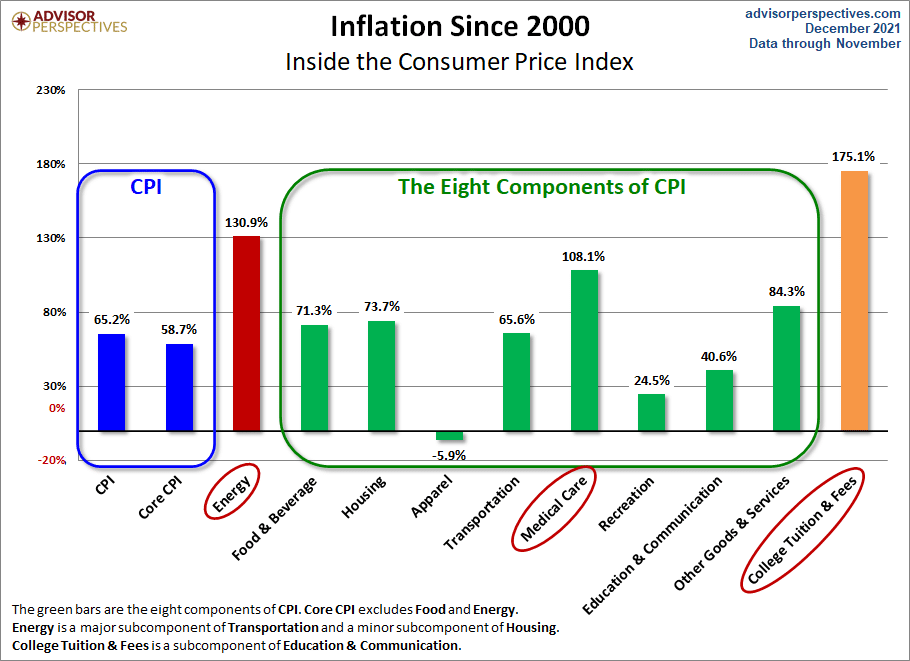
For many, including the Fed, the defining word for inflation has been, until recently, “transitory.” Unfortunately, this has two interpretations.
Transitory can be taken to mean “short-lived,” i.e., lasting only a few months or quarters, or “temporary” meaning that the effects are due to a one-time event and will eventually fade. And while these definitions are related, they have different implications for the global economy.
There are a couple of points of irony here. The first is that the Fed’s biggest historical success is arguably its handling of the 1970s and early 1980s stagflationary period. By using their interest rate tools, the Fed was able to control inflation, with recessionary side effects.
The second is that the inflation pressures that many feared following the 2008 financial crisis never materialized.
There are a number of reasons for this including the deflationary effects of technology and globalization, which make goods more cheaply available, in addition to more arcane details such as the Fed paying banks interest on excess reserves, which increased the incentive to keep money parked at the central bank rather than lending it into the system.
Whatever the reasons, this time is undeniably different. While the long-term deflationary forces are still here, they are overpowered by the near-term effects of the pandemic, supply chain disruptions, excess demand for goods and services, and rising energy prices.
This is making it difficult to predict exactly when inflation might subside. And, even when it does, it may remain above historical averages especially when compared to recent history.
Still, unless the underlying economy were to fundamentally change, it is the case that these effects are “temporary” in nature. This doesn’t necessarily mean that they will fade quickly. But, like the old quote puts it, “if something cannot go on forever, it will stop.”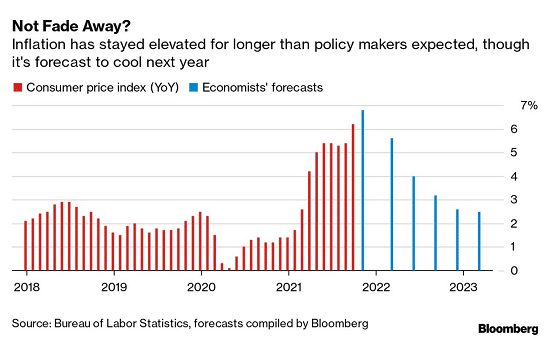
Where does that leave consumers and investors?
Rising inflation has already soured the mood among households with near-term inflation expectations jumping and consumer sentiment plummeting. However, consumers are still spending and household balance sheets are still in a strong position. Unlike the 1970s when the economy was contracting and the job market was shrinking, inflation today is rising alongside a robust economic expansion.
For investors, it continues to be important to stay diversified and to hold assets that can adapt to evolving inflationary environments. Many asset classes that investors already own have these properties including stocks, commodities, and real estate, to name but a few. Large-cap companies, for instance, tend to have pricing power and can therefore adapt over time.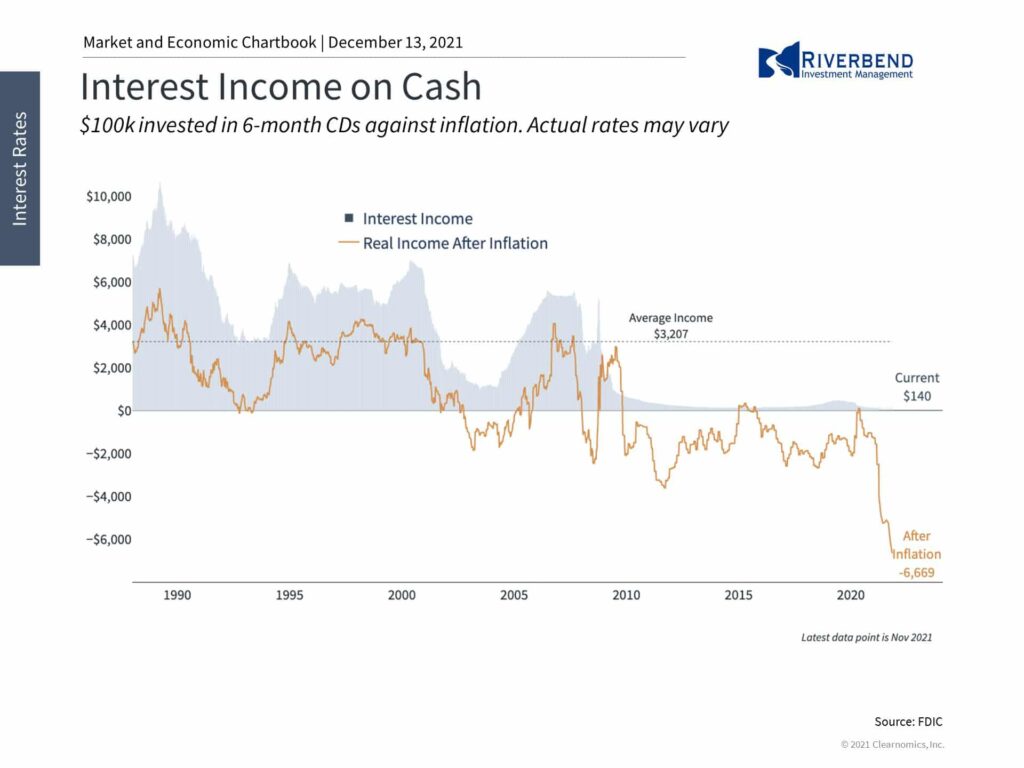
Rising inflation may push up interest rates which makes bond investing challenging, but these trends in rates have occurred in fits and starts. If any asset class is vulnerable in these periods, it’s plain cash. Rising prices erode the value of cash holdings, underscoring the importance of investing in appropriately diversified portfolios for both return and income.
Chart of the Week:
A Starbucks location in Buffalo, NY, voted for unionization during the past week. It was the first time a union won the right to represent Starbucks workers in that company’s history.
Starbucks has an army of 235,000 workers in the U.S. and Starbucks management has spent significant resources over the years successfully dissuading its stores from unionizing. Is this a sign of a turn in the fortunes of union membership?
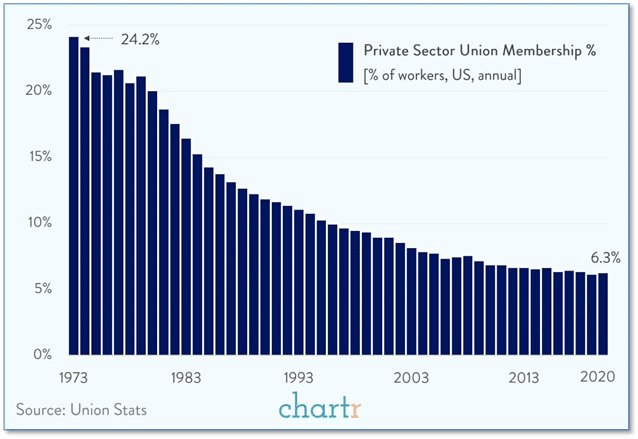
Over the past 50 years, private sector unionization has collapsed. Private sector unionization has dropped by almost three-fourths, from about 24% in the early 70’s to about 6% currently.
If the Starbucks vote is a sign of things to come, there’s a long road back to previous levels. In the coming years, we may start to see unionization movements take hold in companies that didn’t exist in the 1970s, like Amazon for example.
Riverbend Indicators:

Each week we post notable changes to the various market indicators we follow.
- As a reading of our Bull-Bear Indicator for U.S. Equities (comparative measurements over a rolling one-year timeframe), we remain in Cyclical Bull territory.
- Counting up of the number of all our indicators that are ‘Up’ for U.S. Equities, the current tally is that four of four are Positive, representing a multitude of timeframes (two that can be solely days/weeks, or months+ at a time; another, a quarter at a time; and lastly, the {typically} years-long reading, that being the Cyclical Bull or Bear status).
The Week Ahead:
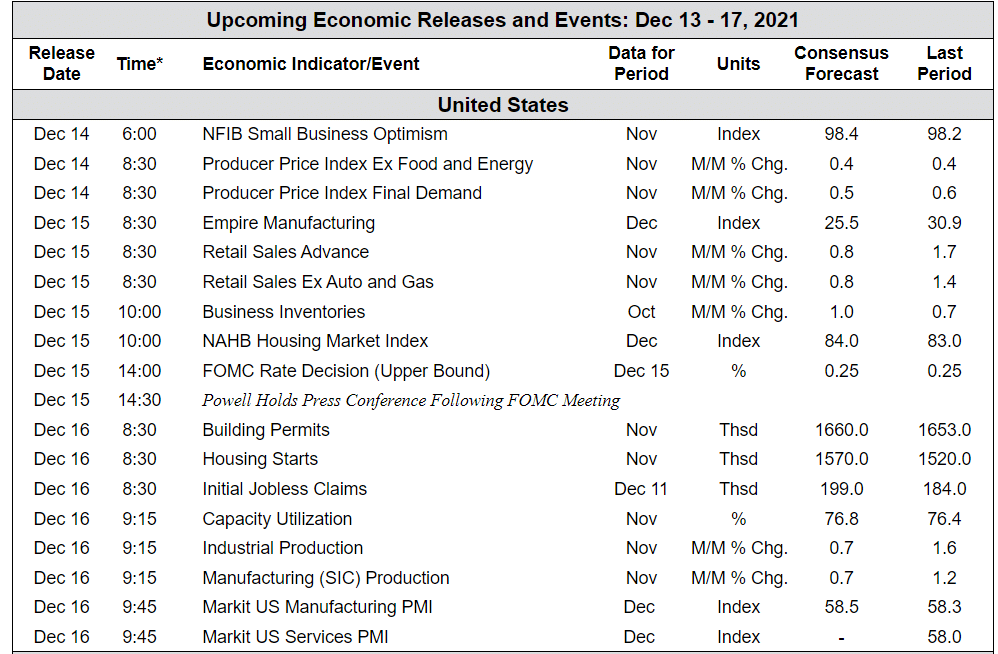
Source: Bloomberg, TD Economics
[/fusion_text][/fusion_builder_column][fusion_builder_column type=”1_6″ layout=”1_6″ spacing=”” center_content=”no” link=”” target=”_self” min_height=”” hide_on_mobile=”small-visibility,medium-visibility,large-visibility” class=”” id=”” hover_type=”none” border_size=”0″ border_color=”” border_style=”solid” border_position=”all” box_shadow=”no” box_shadow_blur=”0″ box_shadow_spread=”0″ box_shadow_color=”” box_shadow_style=”” background_type=”single” gradient_start_position=”0″ gradient_end_position=”100″ gradient_type=”linear” radial_direction=”center” linear_angle=”180″ background_color=”” background_image=”” background_image_id=”” background_position=”left top” background_repeat=”no-repeat” background_blend_mode=”none” animation_type=”” animation_direction=”left” animation_speed=”0.3″ animation_offset=”” filter_type=”regular” filter_hue=”0″ filter_saturation=”100″ filter_brightness=”100″ filter_contrast=”100″ filter_invert=”0″ filter_sepia=”0″ filter_opacity=”100″ filter_blur=”0″ filter_hue_hover=”0″ filter_saturation_hover=”100″ filter_brightness_hover=”100″ filter_contrast_hover=”100″ filter_invert_hover=”0″ filter_sepia_hover=”0″ filter_opacity_hover=”100″ filter_blur_hover=”0″ last=”no”][/fusion_builder_column][/fusion_builder_row][/fusion_builder_container]


