[fusion_builder_container hundred_percent=”no” equal_height_columns=”no” menu_anchor=”” hide_on_mobile=”small-visibility,medium-visibility,large-visibility” class=”” id=”” background_color=”” background_image=”” background_position=”center center” background_repeat=”no-repeat” fade=”no” background_parallax=”none” parallax_speed=”0.3″ video_mp4=”” video_webm=”” video_ogv=”” video_url=”” video_aspect_ratio=”16:9″ video_loop=”yes” video_mute=”yes” overlay_color=”” video_preview_image=”” border_size=”” border_color=”” border_style=”solid” padding_top=”” padding_bottom=”” padding_left=”” padding_right=””][fusion_builder_row][fusion_builder_column type=”1_1″ layout=”1_1″ background_position=”left top” background_color=”” border_size=”” border_color=”” border_style=”solid” border_position=”all” spacing=”yes” background_image=”” background_repeat=”no-repeat” padding_top=”” padding_right=”” padding_bottom=”” padding_left=”” margin_top=”0px” margin_bottom=”0px” class=”” id=”” animation_type=”” animation_speed=”0.3″ animation_direction=”left” hide_on_mobile=”small-visibility,medium-visibility,large-visibility” center_content=”no” last=”no” min_height=”” hover_type=”none” link=””][fusion_text]
[/fusion_text][fusion_vimeo id=”560028123″ alignment=”center” width=”1000″ height=”” autoplay=”false” api_params=”” hide_on_mobile=”small-visibility,medium-visibility,large-visibility” class=”” css_id=”” /][fusion_text][fusion_text]
U.S. Markets: 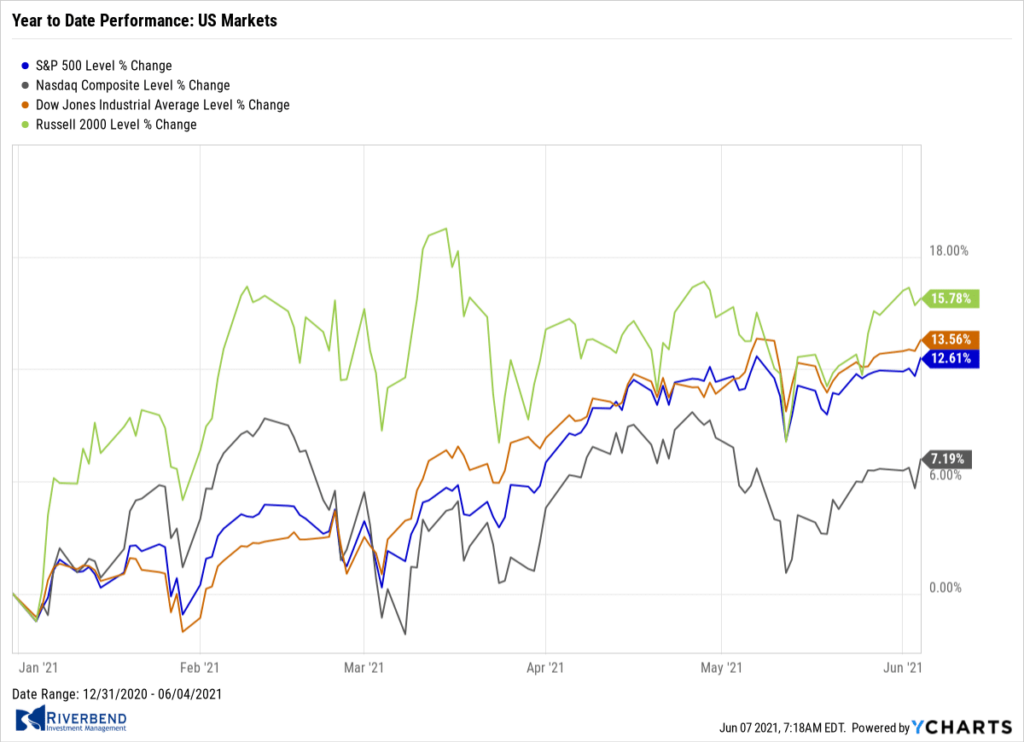
The major U.S. indexes closed moderately higher in a shortened trading week. Energy shares performed best within the S&P 500 Index as oil prices reached their highest level in two years.
The Dow Jones Industrial Average added 227 points to finish the week at 34,756 – a gain of 0.7%. The technology-heavy NASDAQ Composite rose 0.5% to 13,814.
By market cap, the large cap S&P 500 gained 0.6%, while the mid cap S&P 400 finished the week flat, and the small cap Russell 2000 added 0.8%.
International Markets: 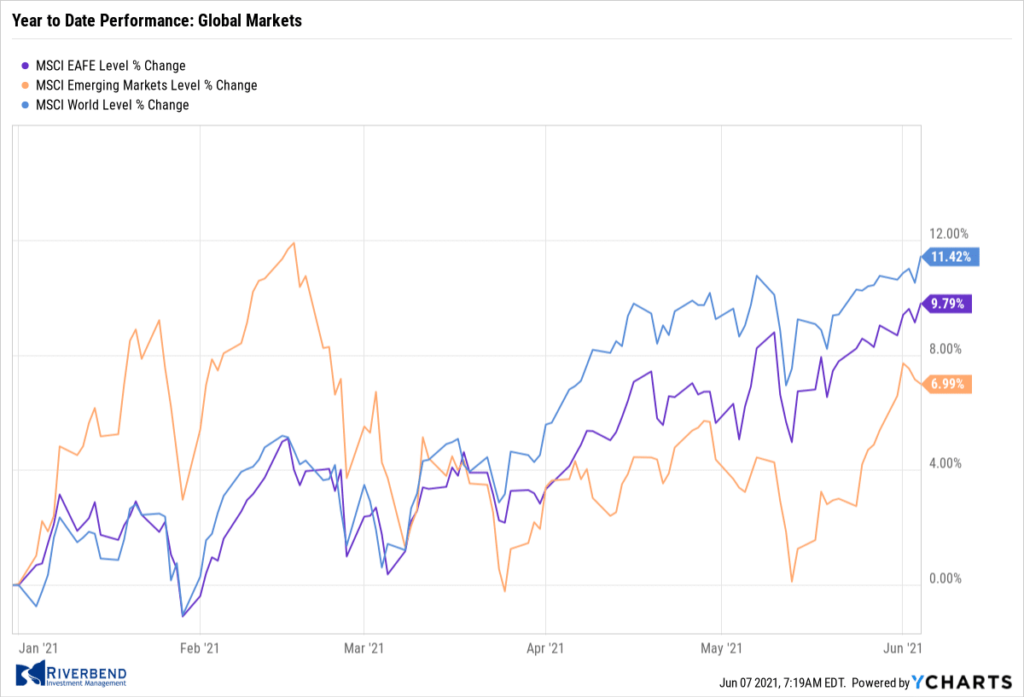
Canada’s TSX booked its third consecutive week of gains by adding 0.9%, while the United Kingdom’s FTSE 100 rose 0.7%.
On Europe’s mainland, France’s CAC 40 gained 0.5% and Germany’s DAX added 1.1%.
In Asia, China’s Shanghai Composite finished down -0.2%, while Japan’s Nikkei ended down -0.7%.
As grouped by Morgan Stanley Capital International, developed markets finished the week up 1.1%, while emerging markets gained 2%.
Commodities: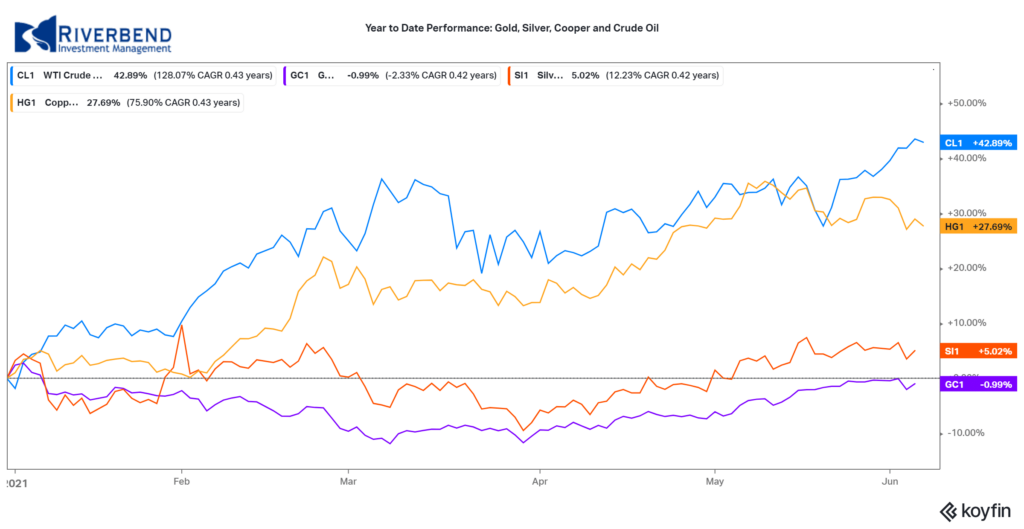
Gold had its first down week in five, giving up 0.7% to $1892.00 per ounce. Likewise, Silver retreated -0.4% to $27.90.
Crude oil hit new highs for the year. West Texas Intermediate crude rose 4.9% to $69.62 per barrel.
The industrial metal copper, viewed by some analysts as a barometer of world economic health due to its wide variety of uses, finished the week down -3.2%.
U.S. Economic News: 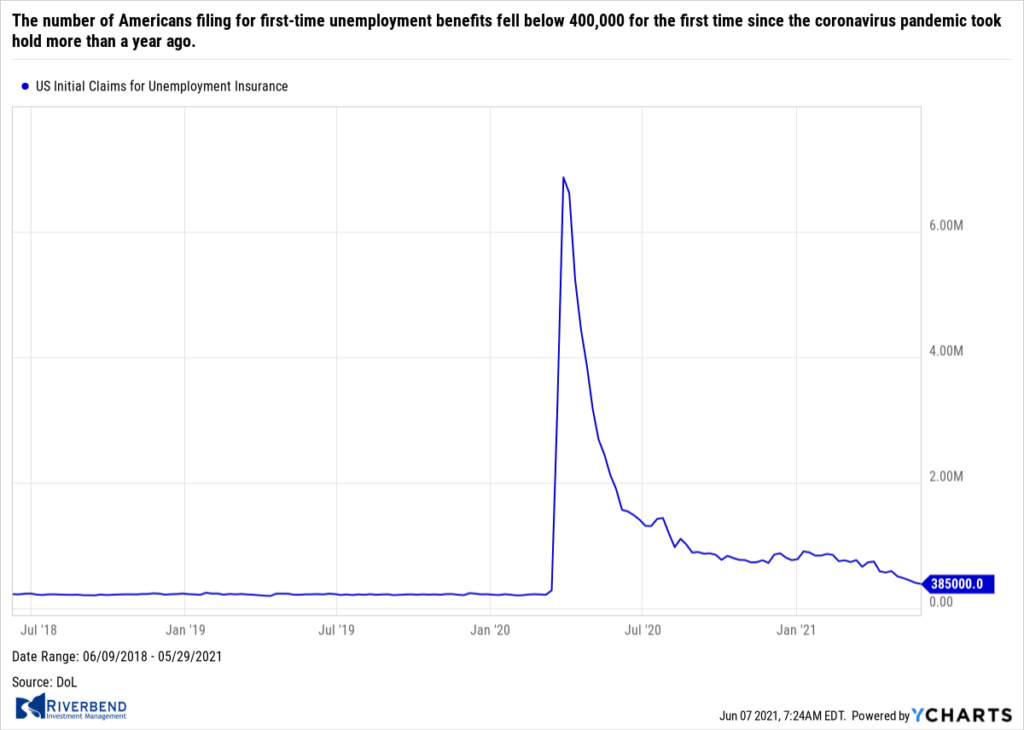
The number of Americans filing for first-time unemployment benefits fell below 400,000 for the first time since the coronavirus pandemic took hold more than a year ago. The Labor Department reported initial jobless claims dropped by 20,000 to 385,000 in the week ended May 29th. It was the fifth consecutive decline in initial jobless claims. Economists had forecast new claims would slip to 393,000. Of note, new unemployment claims remain almost twice as high as they were before the pandemic–new applications had been running in the low 200,000s before the viral outbreak in early 2020.
Continuing claims, which counts the number of Americans already receiving benefits, rose by 169,000 to 3.77 million. That number is reported with a one-week delay. Ian Shepherdson chief economist of Pantheon Macroeconomics stated, “Claims remain elevated by normal standards, but the downward trend has been relentless in recent months, and a return to the pre-Covid level, in the low 200,000s, over the summer seems a decent bet.”
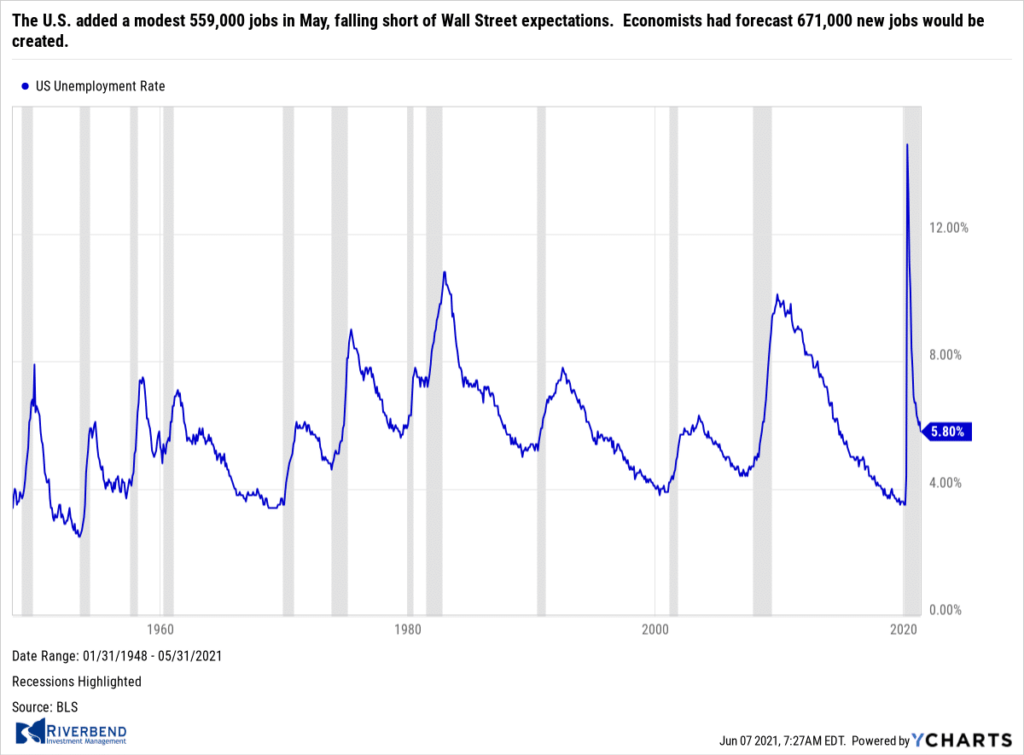 The U.S. added a modest 559,000 jobs in May, falling short of Wall Street expectations. Economists had forecast 671,000 new jobs would be created. The unemployment rate, meanwhile, slipped in May to a pandemic low of 5.8% from 6.1%. Economists say early retirements, a lack of child-care options, lingering fear of the coronavirus and generous unemployment benefits explain why more people haven’t returned to work.
The bulk of the new jobs in May were created by the businesses that suffered the biggest declines in employment during the pandemic. Restaurants added 186,000 new jobs last month as more Americans went out to eat. Other service-oriented businesses such as hotels, museums, parks and entertainment venues also added scores of new jobs. However, employment shrank in construction and retail. Home builders still can’t find enough skilled tradespeople despite an industry boom.
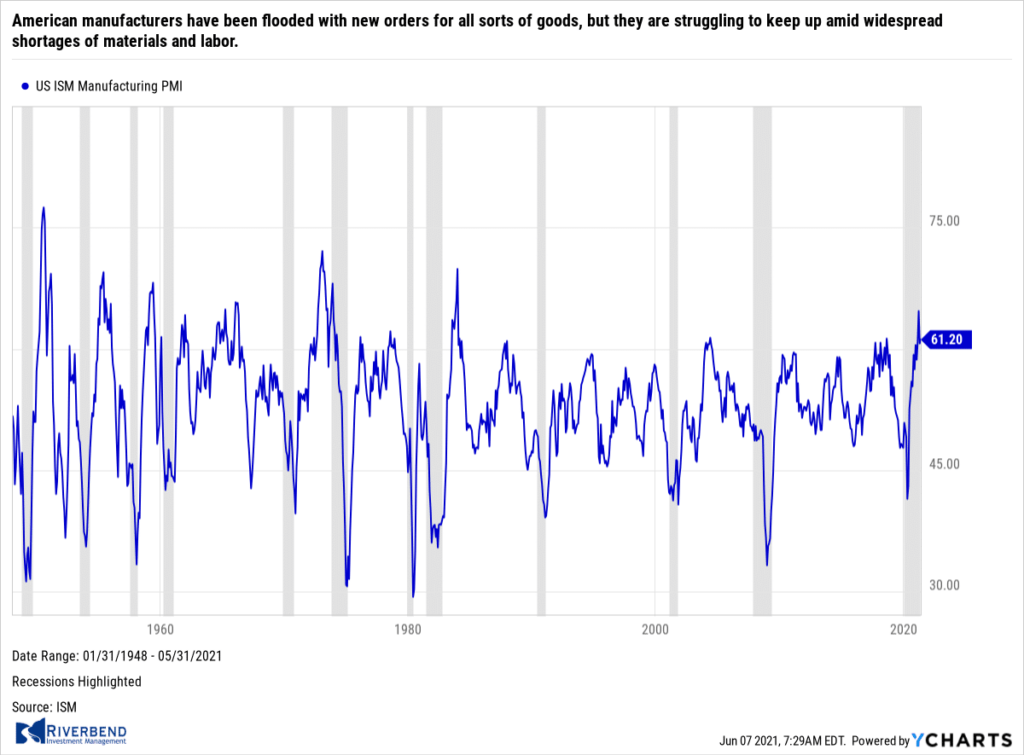 American manufacturers have been flooded with new orders for all sorts of goods, but they are struggling to keep up amid widespread shortages of materials and labor. The Institute for Supply Management (ISM) reported its manufacturing sector index rose 0.5% to 61.2% in May. Economists had expected a reading of just 60.7%. Yet the ISM manufacturing report showed production and hiring actually slowed and companies fell further behind in filling new orders.
Backlogs rose to the highest level on record. Economists state the economy is recovering so rapidly from the coronavirus pandemic that big strains are being put on many companies. Nor is demand expected to slow down anytime soon. A measure of future activity, new orders, rose to 67% – near a 17-year high.
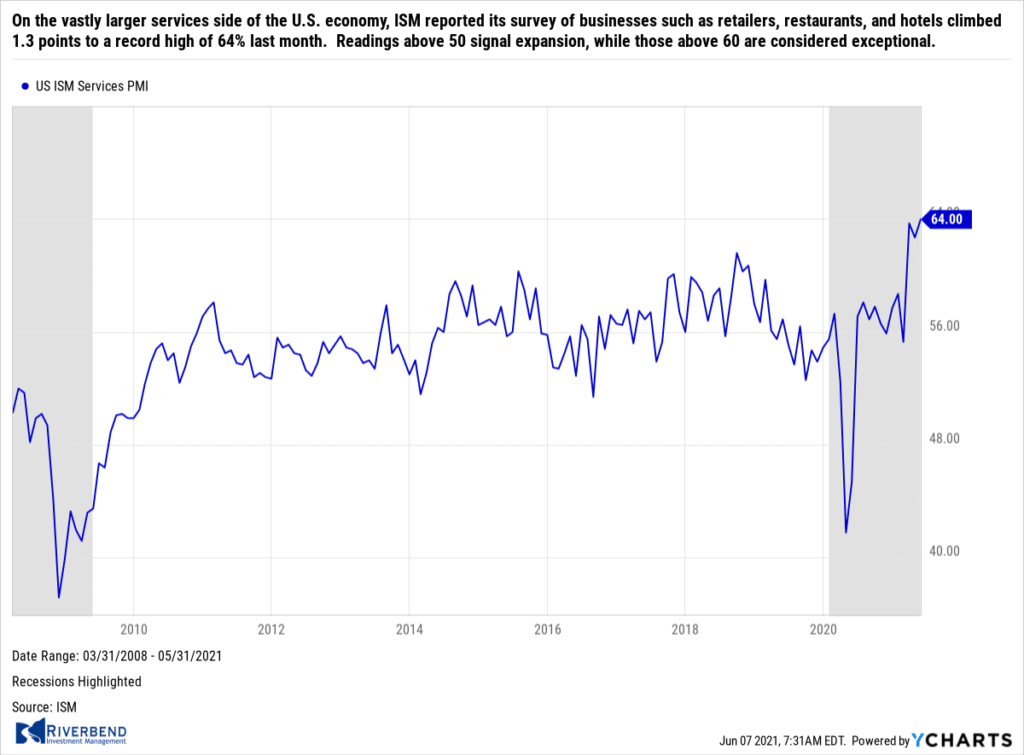 On the vastly larger services side of the U.S. economy, ISM reported its survey of businesses such as retailers, restaurants, and hotels climbed 1.3 points to a record high of 64% last month. Readings above 50 signal expansion, while those above 60 are considered exceptional. “The rate of expansion is very strong, as businesses have reopened and production capacity has increased” said Anthony Nieves, chairman of the survey. Economists had forecast the index would total 62.5%. All 18 service industries tracked by ISM expanded last month – a rarity. The indexes for production and new orders both increased and topped the 60% mark, pointing to an explosion in demand.
The Federal Reserve’s ‘Beige Book’, a collection of anecdotal reports from each of its member banks, sees a pickup in U.S. economic growth in its latest report. The U.S. economy expanded at a “moderate pace” in April and May as consumer spending picked up and manufacturing activity increased, the report found. In the report, the St. Louis Fed noted, a job fair held by a dozen restaurants to find 100 workers drew barely a dozen applicants, while the Atlanta Fed reported firms in their region believed labor shortages would abate this fall.
Chart of the Week:
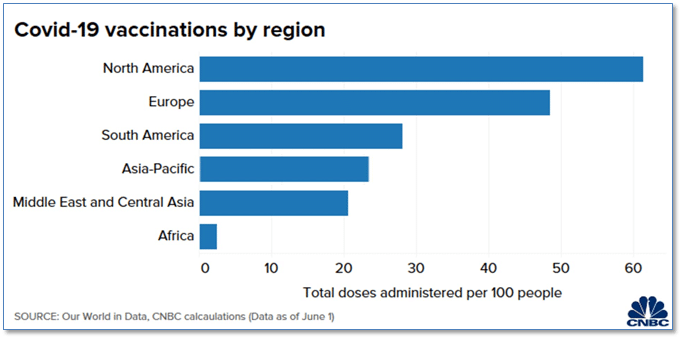
As COVID-19 vaccination efforts continue here in North America, how exactly are we doing relative to the rest of the world? It turns out, actually pretty well. North America has now reached approximately 60% of its population vaccinated, followed closely by Europe at 48.5% of its population. Surprisingly, the Asia-Pacific region has one of the lowest vaccination rates in the world. Analysts report that skepticism over the newly developed vaccines seems to be the common reason for hesitance everywhere, but even more so in Asia where fairly effective containment in the very early stages of the Covid-19 crisis seems to have led to a lower current sense of urgency. Africa, at less than 5%, is reportedly stymied by a triple-whammy of suspicious populations, under-developed distribution networks and widespread shortages of vaccines. (Chart from CNBC)
Riverbend Indicators:

Each week we post notable changes to the various market indicators we follow.
- As a reading of our Bull-Bear Indicator for U.S. Equities (comparative measurements over a rolling one-year timeframe), we remain in Cyclical Bull territory.
- Counting-up of the number of all our indicators that are ‘Up’ for U.S. Equities, the current tally is that four of four are Positive, representing a multitude of timeframes (two that can be solely days/weeks, or months+ at a time; another, a quarter at a time; and lastly, the {typically} years-long reading, that being the Cyclical Bull or Bear status).
The Week Ahead:
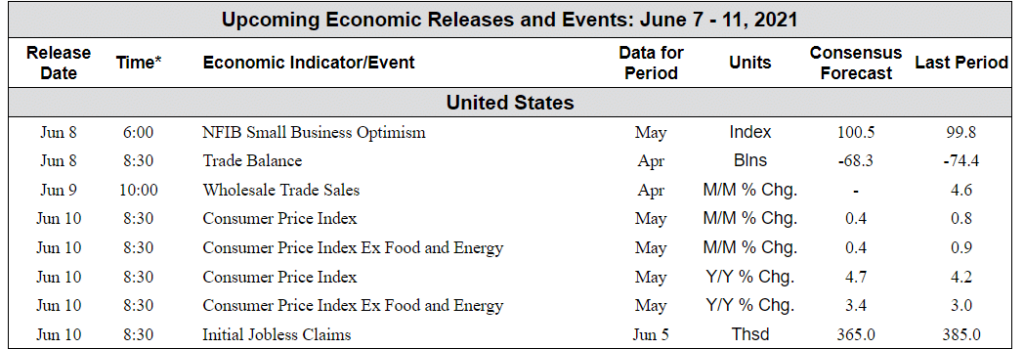
Source: Bloomberg, TD Economics
(Sources: All index- and returns-data from Yahoo Finance; news from Reuters, Barron’s, Wall St. Journal, Bloomberg.com, ft.com, guggenheimpartners.com, zerohedge.com, ritholtz.com, markit.com, financialpost.com, Eurostat, Statistics Canada, Yahoo! Finance, stocksandnews.com, marketwatch.com, wantchinatimes.com, BBC, 361capital.com, pensionpartners.com, cnbc.com, FactSet.)
[/fusion_text][/fusion_builder_column][/fusion_builder_row][/fusion_builder_container]


