[fusion_builder_container hundred_percent=”no” equal_height_columns=”no” menu_anchor=”” hide_on_mobile=”small-visibility,medium-visibility,large-visibility” class=”” id=”” background_color=”” background_image=”” background_position=”center center” background_repeat=”no-repeat” fade=”no” background_parallax=”none” parallax_speed=”0.3″ video_mp4=”” video_webm=”” video_ogv=”” video_url=”” video_aspect_ratio=”16:9″ video_loop=”yes” video_mute=”yes” overlay_color=”” video_preview_image=”” border_size=”” border_color=”” border_style=”solid” padding_top=”” padding_bottom=”” padding_left=”” padding_right=””][fusion_builder_row][fusion_builder_column type=”1_1″ layout=”1_1″ background_position=”left top” background_color=”” border_size=”” border_color=”” border_style=”solid” border_position=”all” spacing=”yes” background_image=”” background_repeat=”no-repeat” padding_top=”” padding_right=”” padding_bottom=”” padding_left=”” margin_top=”0px” margin_bottom=”0px” class=”” id=”” animation_type=”” animation_speed=”0.3″ animation_direction=”left” hide_on_mobile=”small-visibility,medium-visibility,large-visibility” center_content=”no” last=”no” min_height=”” hover_type=”none” link=””][fusion_text]
For the last few weeks, US equities have been in decline, as I write this, the S&P 500 has pulled back approximately 5% from its highs.
Despite the doom and gloom you might see from the media, 5-10% pullbacks are typical in a normal market environment and occur quite often — in fact, 2021 has been an abnormal year with the current pullback being the first 5% decline this year:
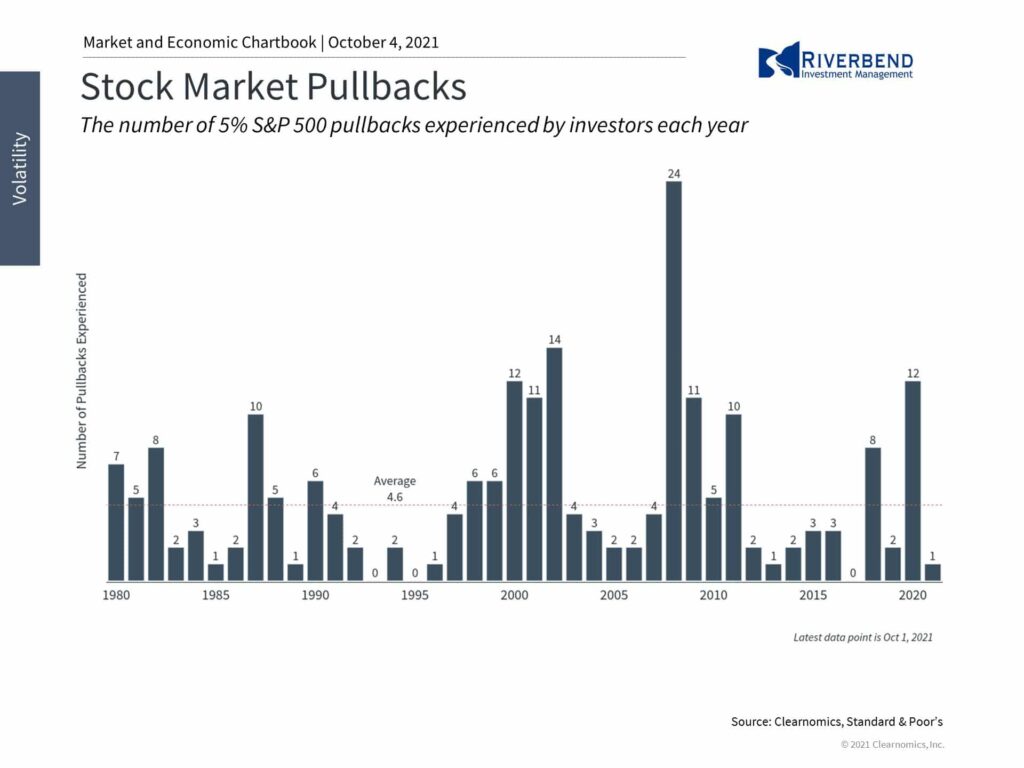
Since 1980, the average year sees a stock market drop of -13.5% with most years ending in positive territory, averaging 9% gains:
![]()
So, what we are experiencing now is nothing unusual.
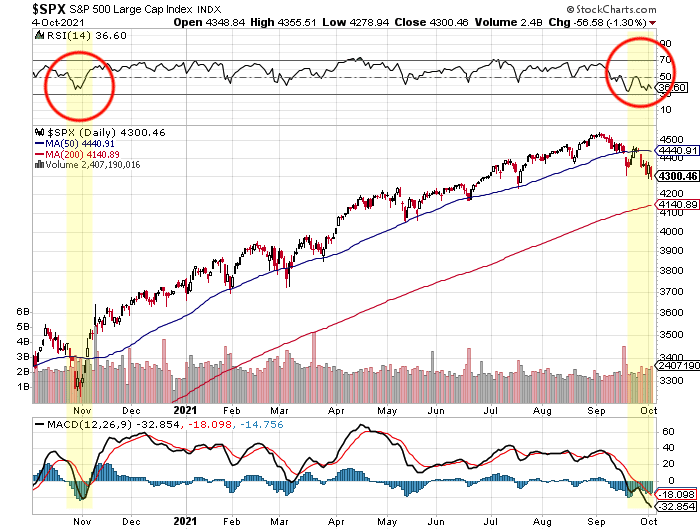
Overall the market is looking a bit oversold at this level and looks similar to the oversold conditions we saw last Fall. Interestingly, volume is lower than it was earlier this year – a possible indication that the market is being pulled down due to lack of participation (as investors wait out all the DC shenanigans) instead of investors rushing to the exits.
Within our client portfolios, we are viewing this as a short-term decline and taking this opportunity to position the portfolios to take advantage of the post-Delta environment.
Strength vs Weakness:
During the current decline – which many are attributing to recent Fed statements and DC policymakers – we are continuing to see a rotation out of COVID winners, back into the areas of the market that are expected to benefit from the continuation of the reopening of our economy.
COVID winners reemerged over the past two quarters as investors worried about the Delta variant, as it began to become more widespread.
Now, investors seem to be shifting back into the reopening trade, or Reopening Trade 2.0 as I have been calling it. This means what did well in the first quarter should lead the market again.
Below I review the individual sectors that make up the S&P 500 and discuss which areas are getting weaker and which are getting stronger, based on relative strength vs the S&P 500 and using a 21-day moving average to smooth out the trend.
What’s Getting Weaker:
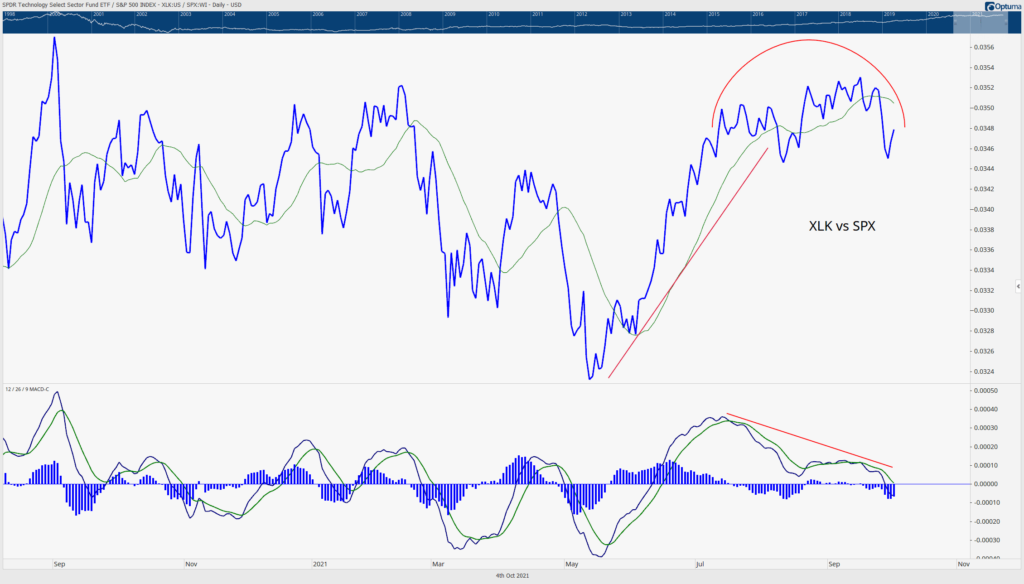
Technology – During the first quarter of the year, the technology sector underperformed the S&P 500. During the second and third quarters, tech stocks outperformed the broader market and continued to get stronger until last month. The strength in tech stocks is starting to roll over. This may be the beginning of a period of underperformance, similar to what we saw earlier this year.
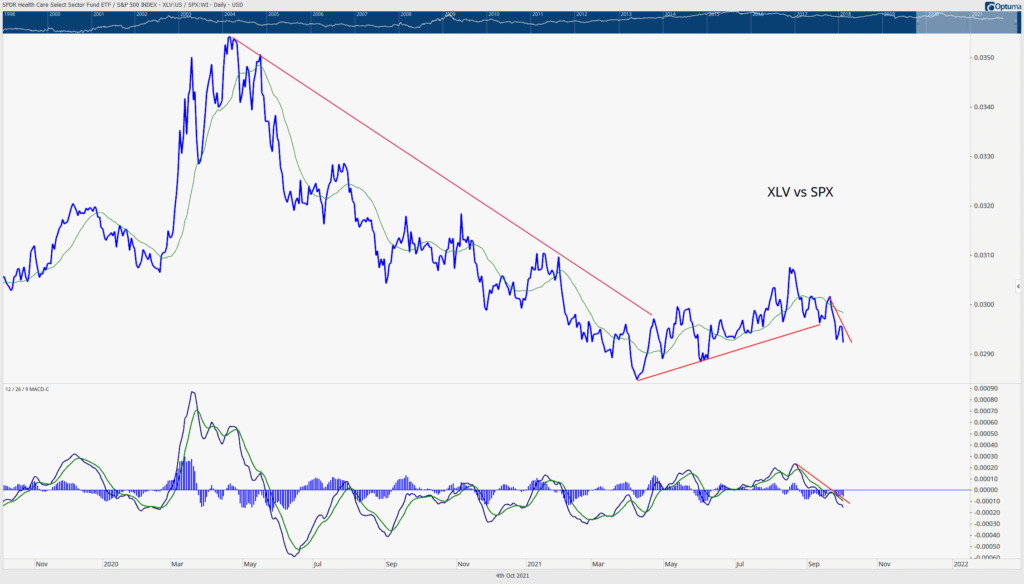
Healthcare – Healthcare stocks have been following a similar pattern to that of the tech sector. As investors began to look past COVID, the sector weakened up until the emergence of Delta. However, investors are beginning to look past the Delta variant as vaccination rates continue to rise and sector strength has started to weaken again.
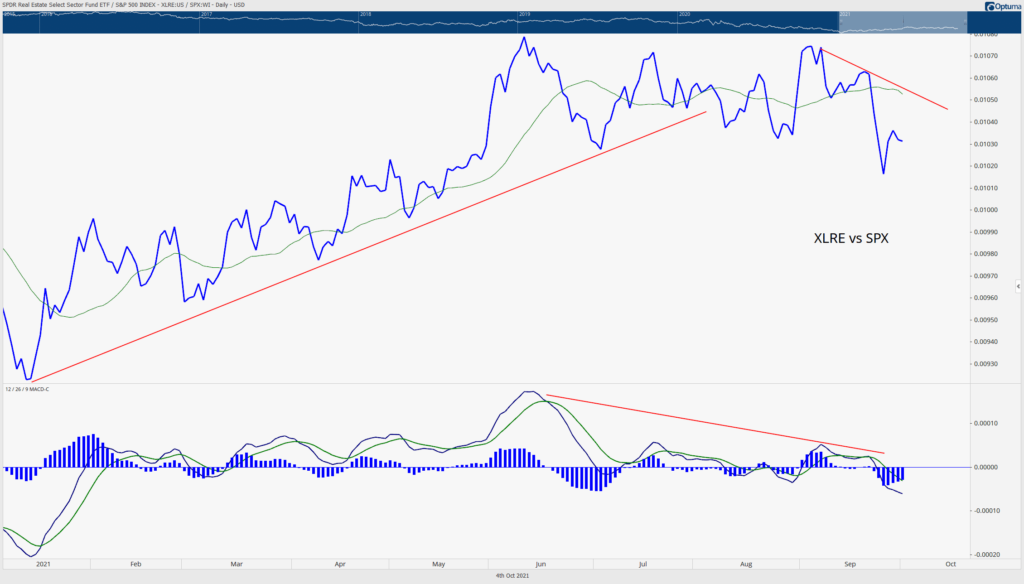
Real Estate – The Real Estate sector is starting to feel some pressure from rising interest rates. Market internals have been getting weaker since mid-summer and the weakness seems to be accelerating in conjunction with the rise of interest rates this past month.
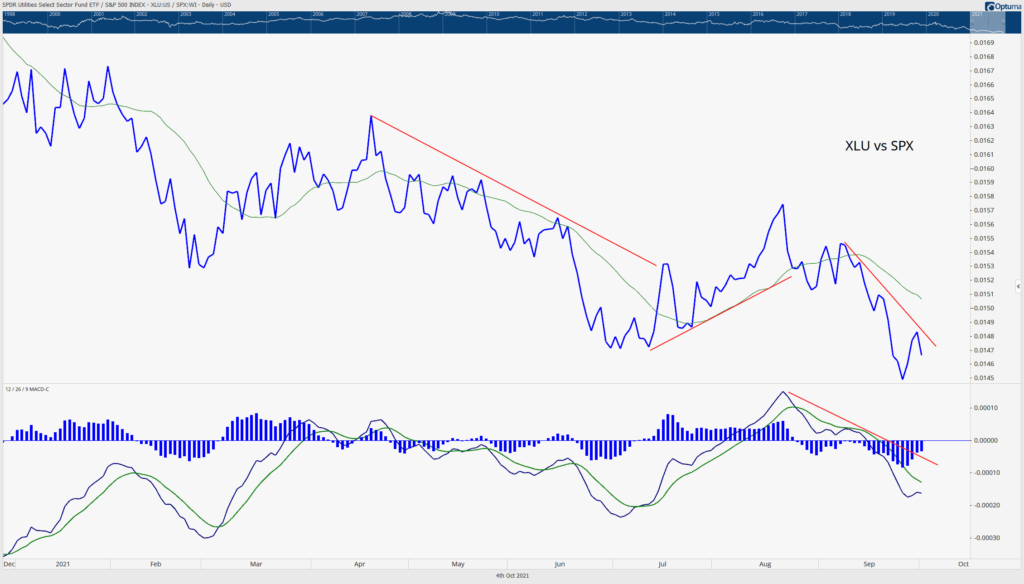
Utilities – Strength in utilities began to rise this summer as the market narrowed. However, as interest rates began to rise, investors have quickly exited the Utility sector. Utilities have a high borrowing rate and can be impacted by a rise in rates. Additionally, investors looking for yield will start shifting from dividend-paying stocks into bonds. (Since they can have a similar yield without the risk of owning equities.)
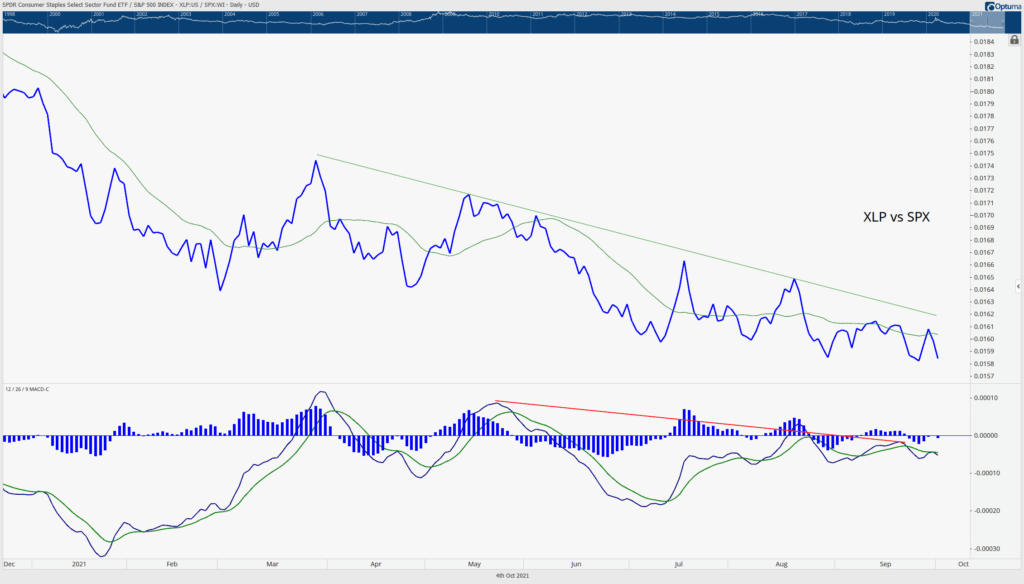
Consumer Staples – Consumer staples have been weakening for most of the year. Higher underlying costs and delays within supply channels are impacting prices as investors worry about what impact this will have on corporate earnings.
What’s Getting Stronger:
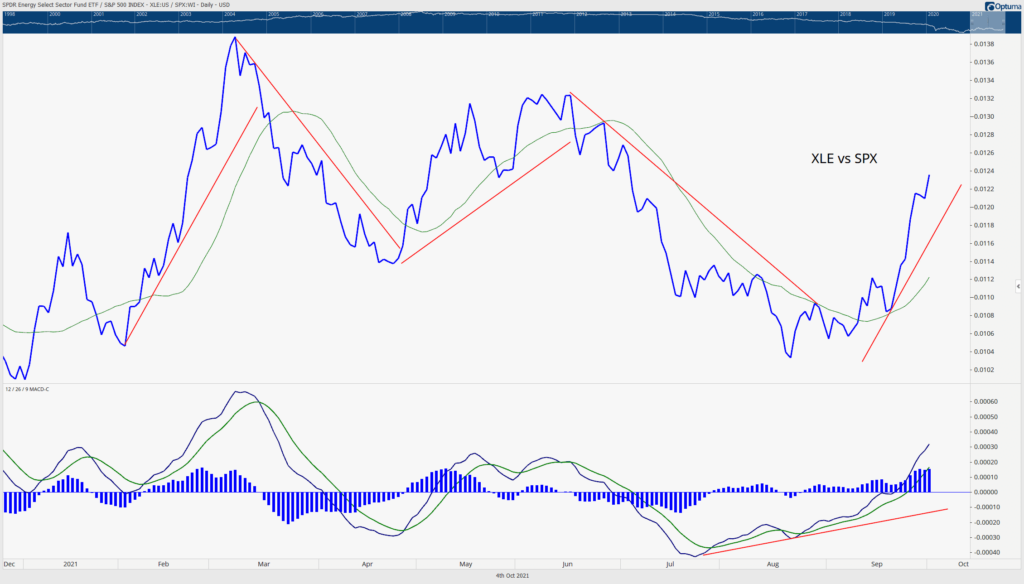 Energy – The energy sector is providing a great illustration of the impact of the Delta variant on the stock market. As the economy began to reopen, energy prices rose as consumer demand rose. During Delta, we saw sector strength decline. Currently, energy is rising aggressively again – as it did during the 1st quarter of the year.
Financials – Financial stocks are starting to gain strength as interest rates rise. Banks typically do well during a rising rate environment as the spread between the money they borrow vs the money they lend out increases – which benefits their profit margin.
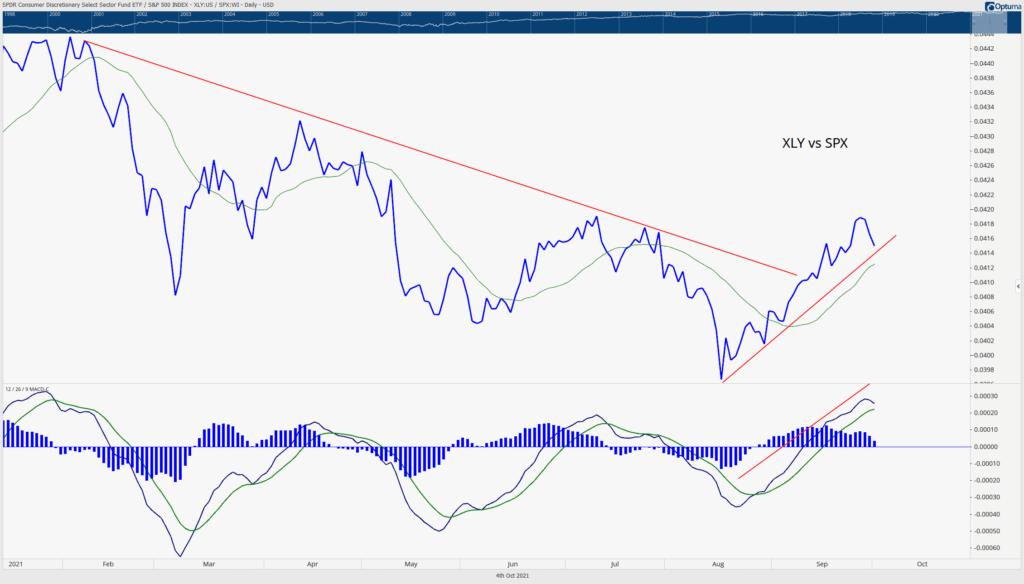
Consumer Discretionary – The consumer discretionary sector has been rising in strength vs the S&P 500 since August. This sector did well during the first reopening trade. Looking past Delta, the hope is consumers will return to stores and provide this sector with strong Christmas numbers.
Early Signs of Strength (Maybe):
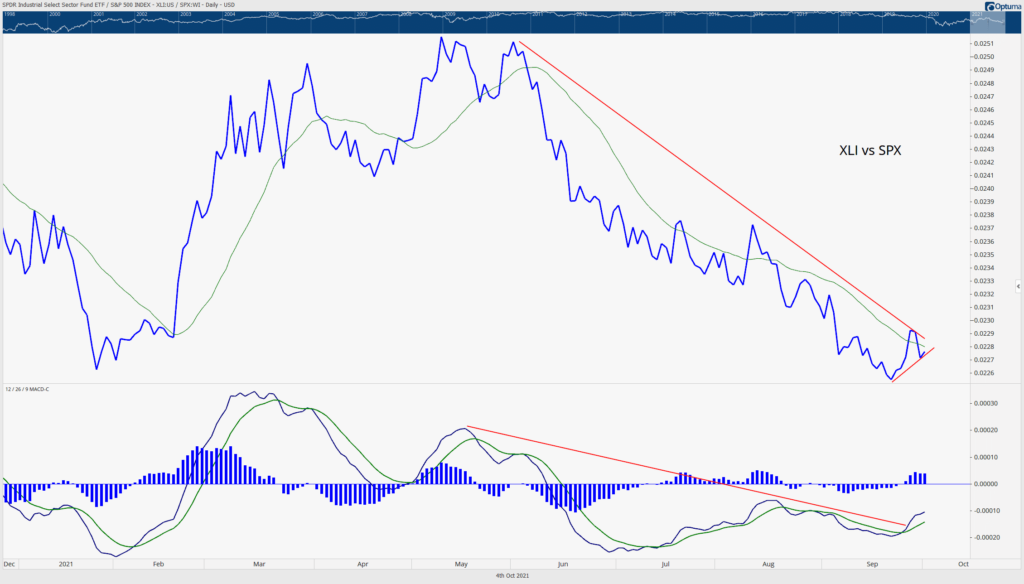 Industrials – Strength in industrials have been weakening since April. However, the sector has been strengthing over the past month, but, it is still a bit early in the pattern. Keep an eye on this sector to see if it follows other reopening trade members.
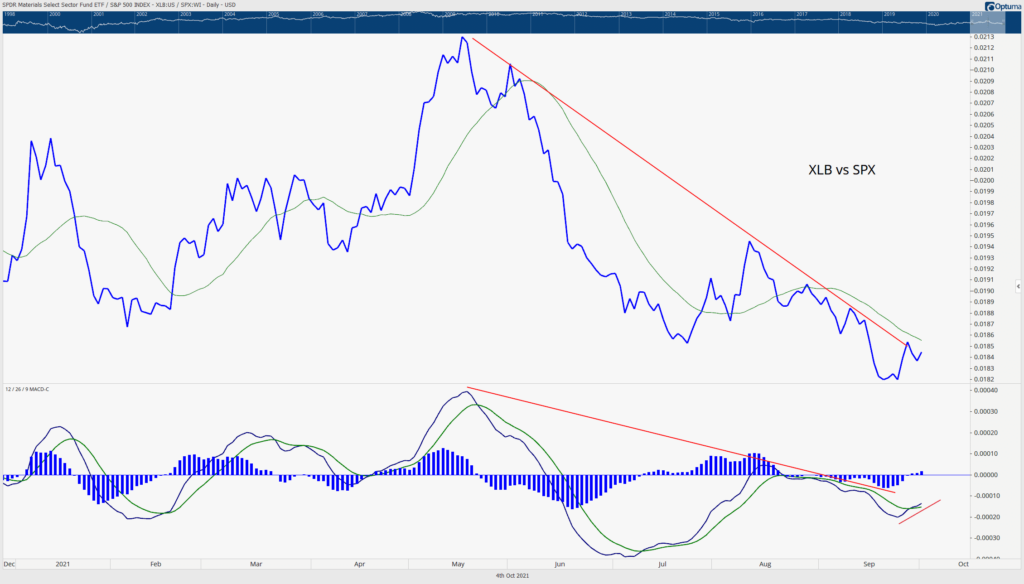 Materials – Similar to the pattern we see within the industrial sector, Materials are starting to rise in strength – but it is still too early to call it a reversal pattern.
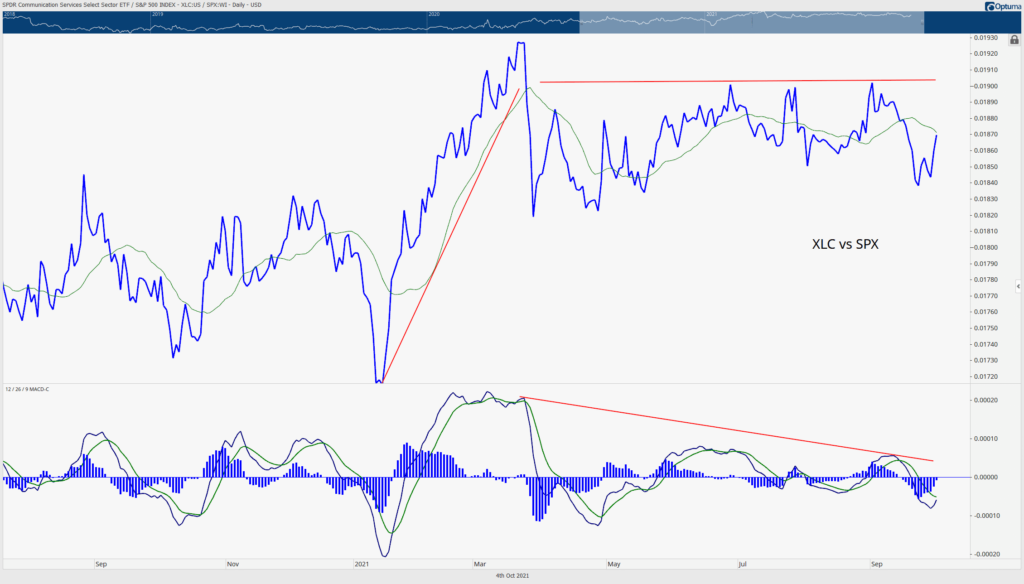
Communication – The communication sector has been gyrating since March. Looking at market internals (specifically the MACD), the sector looks to be on the verge of getting stronger – but this trend may fail. Facebook, Alphabet (Google) and Netflix make up a large portion of this sector. The weakness within the technology sector will most likely impact these stocks.
Chart of the Week:
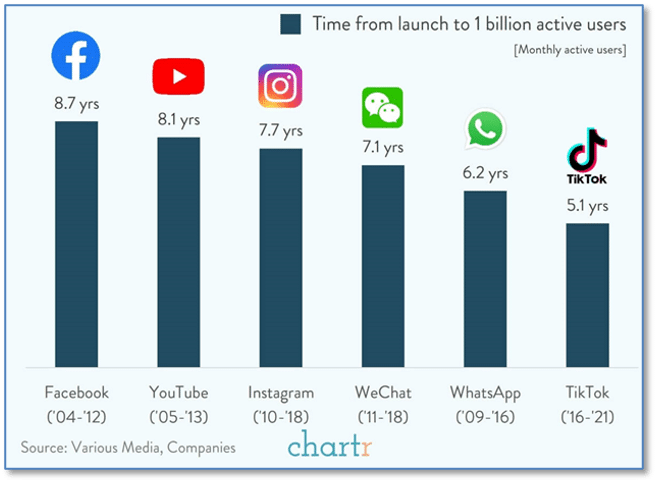
Initially released just five years ago, video-sharing app TikTok announced this week that the company has hit one billion active users.
The billion-user club is very small, with the likes of Facebook, YouTube and Instagram. However, no member of the billion-user club has achieved that status in such a short time as TikTok – just 5 years!
This is significantly shorter than the time it took the others to join the club…and works out to an average 16,666,667 new users every single month for the last 5 years.
Riverbend Indicators:

Each week we post notable changes to the various market indicators we follow.
- As a reading of our Bull-Bear Indicator for U.S. Equities (comparative measurements over a rolling one-year timeframe), we remain in Cyclical Bull territory.
- Counting up of the number of all our indicators that are ‘Up’ for U.S. Equities, the current tally is that four of four are Positive, representing a multitude of timeframes (two that can be solely days/weeks, or months+ at a time; another, a quarter at a time; and lastly, the {typically} years-long reading, that being the Cyclical Bull or Bear status).
The Week Ahead:
Source: Bloomberg, TD Economics
[/fusion_text][/fusion_builder_column][/fusion_builder_row][/fusion_builder_container]


