[fusion_builder_container hundred_percent=”no” equal_height_columns=”no” menu_anchor=”” hide_on_mobile=”small-visibility,medium-visibility,large-visibility” class=”” id=”” background_color=”” background_image=”” background_position=”center center” background_repeat=”no-repeat” fade=”no” background_parallax=”none” parallax_speed=”0.3″ video_mp4=”” video_webm=”” video_ogv=”” video_url=”” video_aspect_ratio=”16:9″ video_loop=”yes” video_mute=”yes” overlay_color=”” video_preview_image=”” border_size=”” border_color=”” border_style=”solid” padding_top=”” padding_bottom=”” padding_left=”” padding_right=””][fusion_builder_row][fusion_builder_column type=”1_1″ layout=”1_1″ background_position=”left top” background_color=”” border_size=”” border_color=”” border_style=”solid” border_position=”all” spacing=”yes” background_image=”” background_repeat=”no-repeat” padding_top=”” padding_right=”” padding_bottom=”” padding_left=”” margin_top=”0px” margin_bottom=”0px” class=”” id=”” animation_type=”” animation_speed=”0.3″ animation_direction=”left” hide_on_mobile=”small-visibility,medium-visibility,large-visibility” center_content=”no” last=”no” min_height=”” hover_type=”none” link=””][fusion_text]
U.S. Markets: 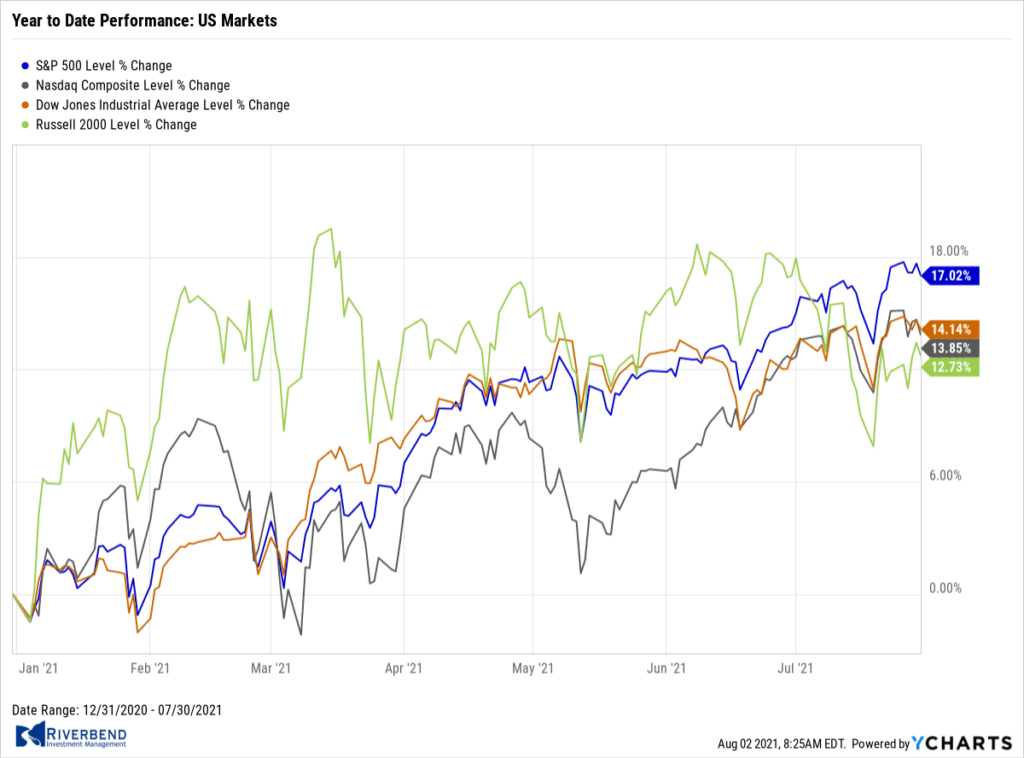
The major U.S. indexes finished the week mixed. The large-cap benchmarks and technology-focused Nasdaq Composite managed record highs before pulling back late in the week, while the mid cap S&P 400 index and small-cap Russell 2000 broke a string of underperformances and recorded gains.
The Dow Jones Industrial Average finished the week down -126 points to 34,935, a decline of -0.4%. The NASDAQ retraced some of last week’s gain giving up -1.1% to 14,673.
By market cap, the large cap S&P 500 retreated -0.4%, while mid caps and small caps rose 1.2% and 0.8%, respectively.
International Markets: 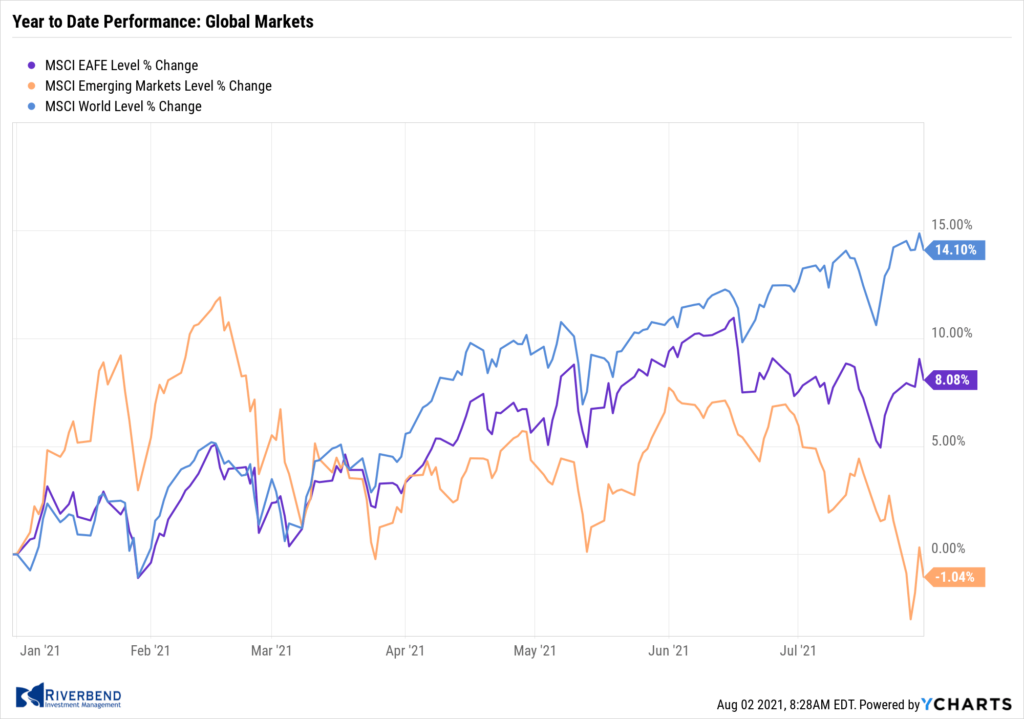
Canada’s TSX rose 0.5% while the UK’s FTSE 100 ticked up 0.1%. European markets were mixed with France’s CAC rising 0.7%, while Germany’s DAX retreated -0.8%.
In Asia, China’s Shanghai index plunged ‑4.3%, while Japan’s Nikkei declined -1.0%.
As grouped by Morgan Stanley Capital International, developed markets rose 0.3%, while emerging markets retreated -1.7%.
Commodities: 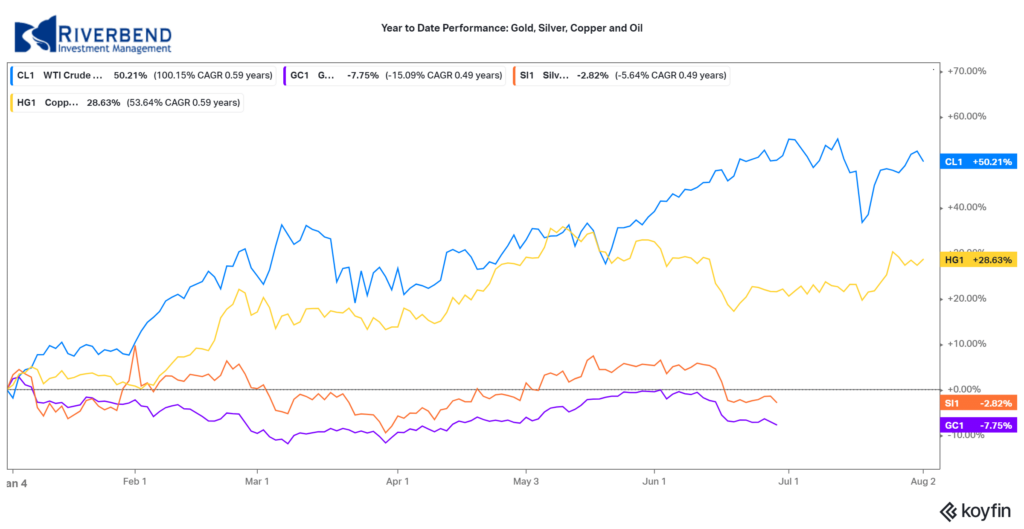
Precious metals finished the week to the upside. Gold rose 0.9% to $1817.20 per ounce, while Silver added 1.2% to $25.55.
Oil rose for a second week. West Texas Intermediate crude oil rose 2.6% to $73.95 per barrel.
The industrial metal copper, viewed by analysts as a barometer of global economic health due to its wide variety of uses, finished the week up 1.9%.
U.S. Economic News: 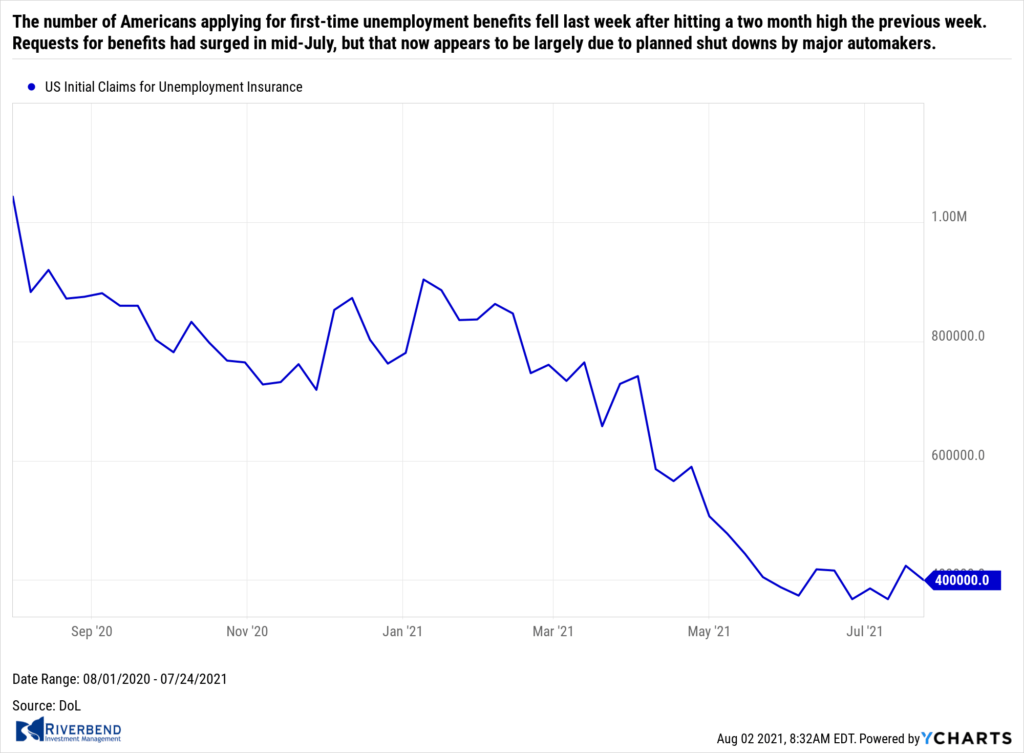
The number of Americans applying for first-time unemployment benefits fell last week after hitting a two month high the previous week. The Labor Department reported initial jobless claims declined by 24,000 to 400,000 in the week ended July 24. Economists had forecast 380,000 new claims. Requests for benefits had surged in mid-July, but that now appears to be largely due to planned shut downs by major automakers. Meanwhile, continuing claims, which counts the number of people already receiving benefits, rose by 7,000 to 3.27 million. Continuing claims remain near a pandemic low.
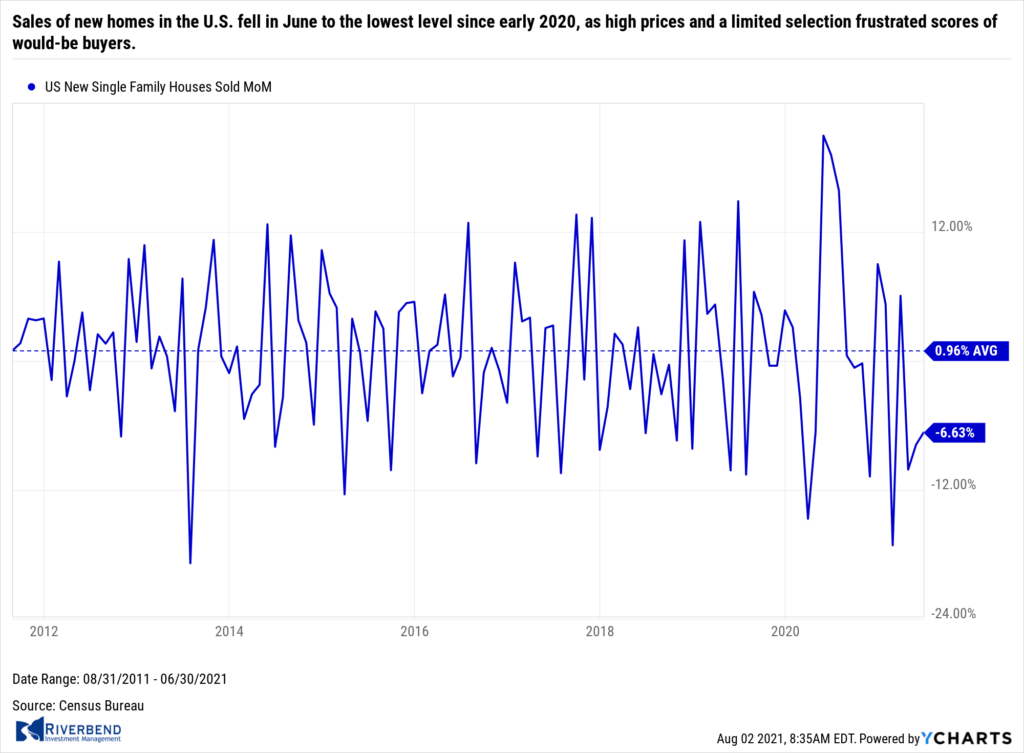 Sales of new homes in the U.S. fell in June to the lowest level since early 2020, as high prices and a limited selection frustrated scores of would-be buyers. New-home sales dropped 6.6% to an annual rate of 676,000, the government reported. The decline in sales was much larger than analysts had expected. Economists had forecast an annual sales rate of 795,000. New-home sales had surged at the beginning of the year to its highest level in almost 15 years reaching an almost 1 million annual rate as buyers took advantage of record-low mortgages rates. Sales have now pulled back due to a shortage of properties and higher costs.
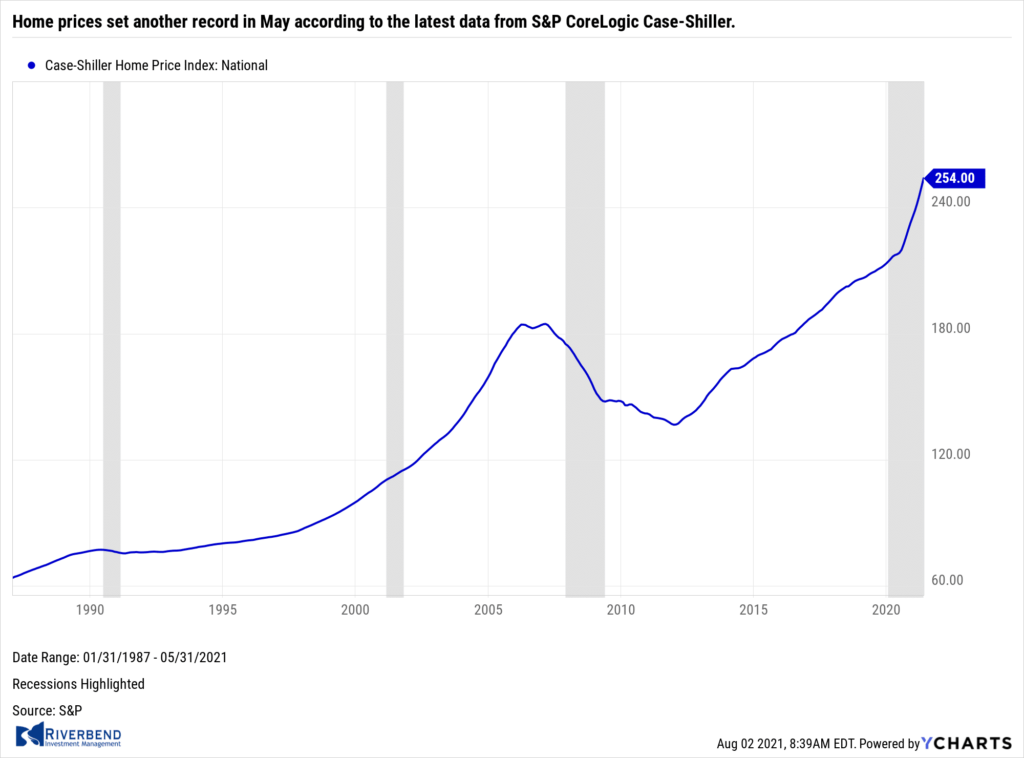 Home prices set another record in May according to the latest data from S&P CoreLogic Case-Shiller. At a national level, Case-Shiller’s home price index recorded an increase of 16.6% over the past year—up from the prior record of 14.8% set just last month. The separate 20-city index, which gauges home prices across a selection of major cities across the country, increased by 17% in May—an increase of 2% from the prior month. In keeping with recent trends, Phoenix, San Diego and Seattle reported the highest year-over-year gains among the 20 cities in May. All 20 cities showed a gain in prices. Record price gains were seen in Charlotte, Cleveland, Dallas, Denver and Seattle.
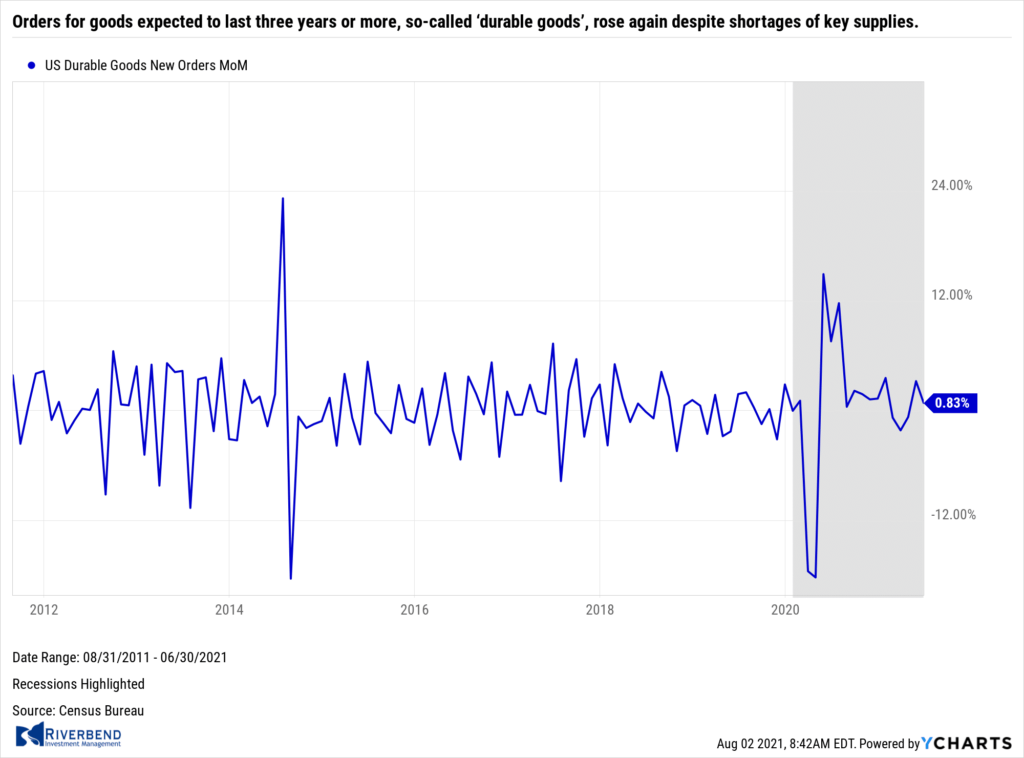 Orders for goods expected to last three years or more, so-called ‘durable goods’, rose again despite shortages of key supplies. The government reported durable goods orders climbed 0.8% last month, missing economists’ forecasts of a 2% increase. The increase fell short of Wall Street expectations mostly because new orders in the prior month were revised upwards. The rebound in the U.S. economy has ignited a surge in demand for cars, electronics, and other goods. That, in turn, has led to big shortages in both supplies and labor. The shortages have driven up the cost of supplies and pushed companies to try to pass these costs onto customers by charging higher prices. All of this has added to the biggest burst of inflation in the U.S. since at least 2008.
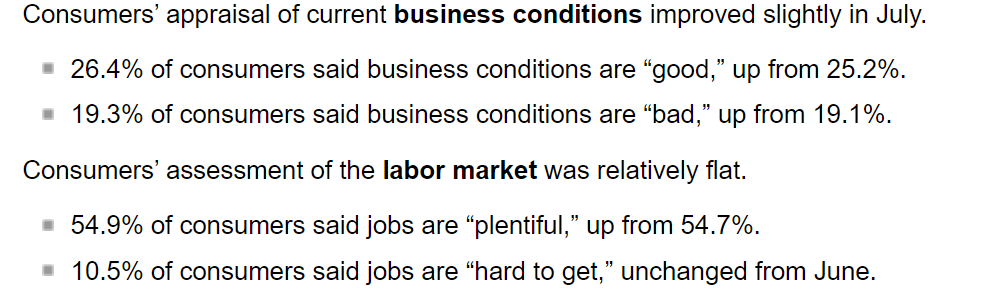 Confidence among the nation’s consumers climbed to a 16-month high, despite concerns of a spread of a new “delta” variant of the coronavirus. The Conference Board reported its index of consumer confidence ticked up to 129.1 in July from a revised 128.9 in June. That’s the highest level since just before the onset of the coronavirus pandemic early last year. Economists had expected a reading of just 125. The economy has been surging since the spring thanks to rising vaccinations, massive government financial stimulus and the almost full reopening of the economy. The part of the survey that tracks how consumers feel about the economy right now inched up to 160.3 from 159.6 in the prior month. Another measure that assesses how Americans view the next six month, the “future expectations index”, remained unchanged at 108.4—another strong reading.
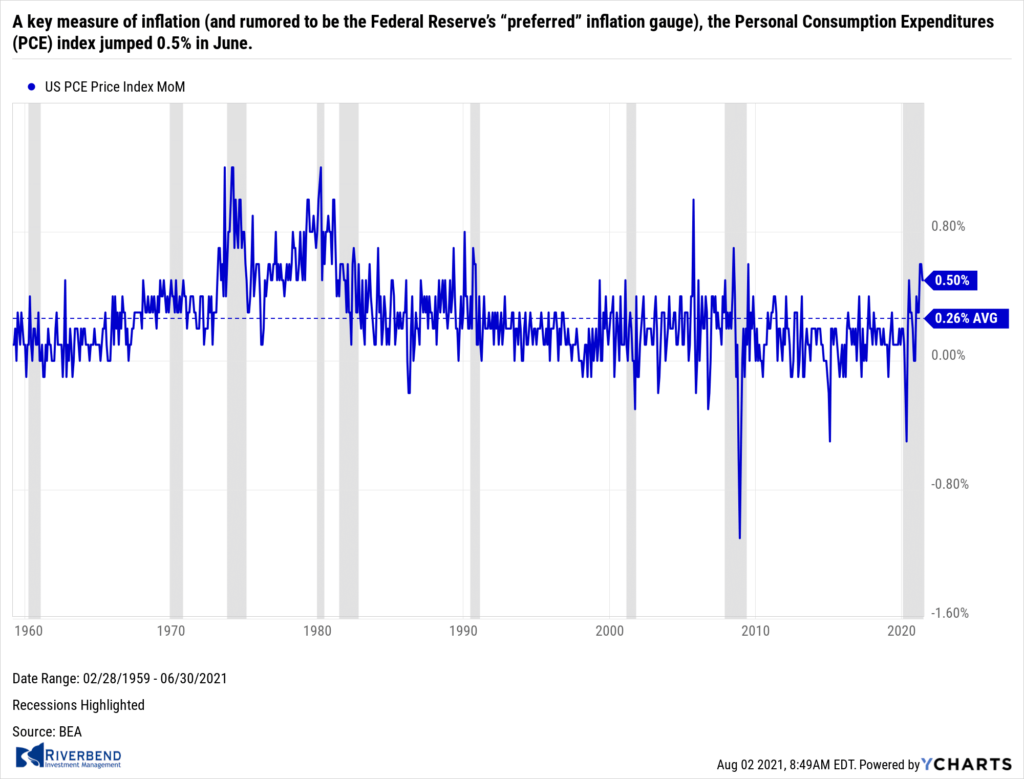 A key measure of inflation (and rumored to be the Federal Reserve’s “preferred” inflation gauge), the Personal Consumption Expenditures (PCE) index jumped 0.5% in June. It was the fourth big upturn in a row and pushed the increase over the past 12 months to 4%. That’s the highest level since 2008 and double the Federal Reserve’s 2% target. A separate measure of inflation, the consumer price index, is running even hotter. The Federal Reserve has said for months inflation would subside as the bottlenecks eased and the central bank is sticking to that view. Chairman Jerome Powell finally acknowledged this week that what he’s been calling “transitory” inflation could stay high longer than the Fed had anticipated, perhaps well into next year.
Chart of the Week:
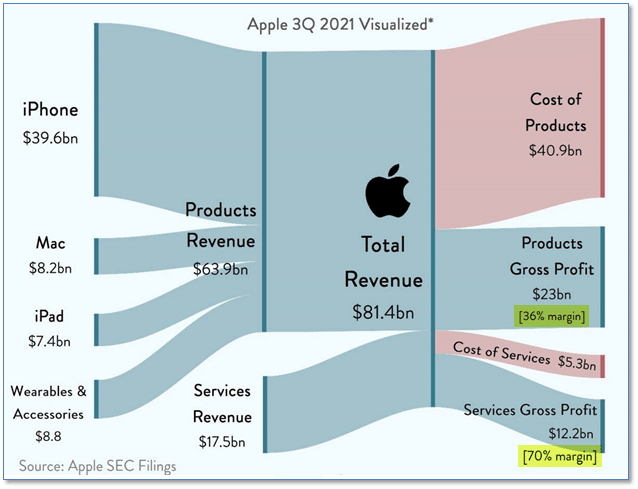
Tech behemoth Apple reported quarterly earnings this week and demolished Wall Street expectations. The world’s most valuable company just reported more than $81bn of revenue for the three months ending in June – a 36% increase over the same quarter last year. That works out to roughly $900m a day or $10,000 every single second of the quarter. But while the iPhone remains Apple’s biggest product, its services businesses are getting many investors even more excited. Things like Apple Music, the App Store, Apple Pay, Apple TV, and potentially an Apple Car (under secret development since 2014) have or will have very lucrative profit margins (already at 70%, almost twice the margin of the 36% generated by the “Products” business).
Riverbend Indicators:

Each week we post notable changes to the various market indicators we follow.
- As a reading of our Bull-Bear Indicator for U.S. Equities (comparative measurements over a rolling one-year timeframe), we remain in Cyclical Bull territory.
- Counting up of the number of all our indicators that are ‘Up’ for U.S. Equities, the current tally is that four of four are Positive, representing a multitude of timeframes (two that can be solely days/weeks, or months+ at a time; another, a quarter at a time; and lastly, the {typically} years-long reading, that being the Cyclical Bull or Bear status).
The Week Ahead:
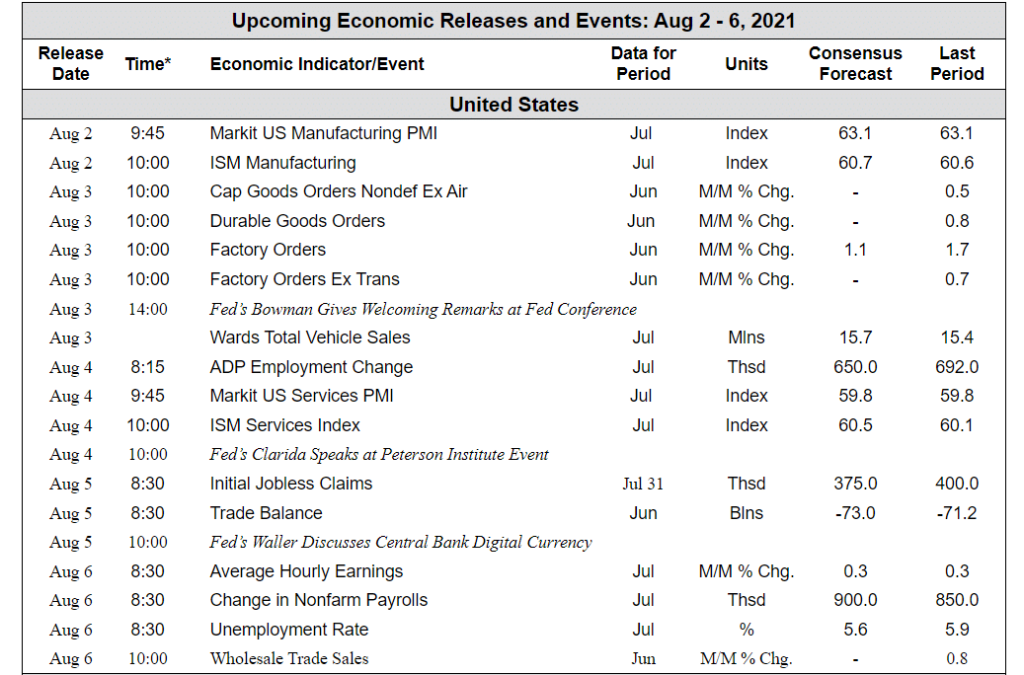
Source: Bloomberg, TD Economics
[/fusion_text][/fusion_builder_column][/fusion_builder_row][/fusion_builder_container]


