U.S. Markets: 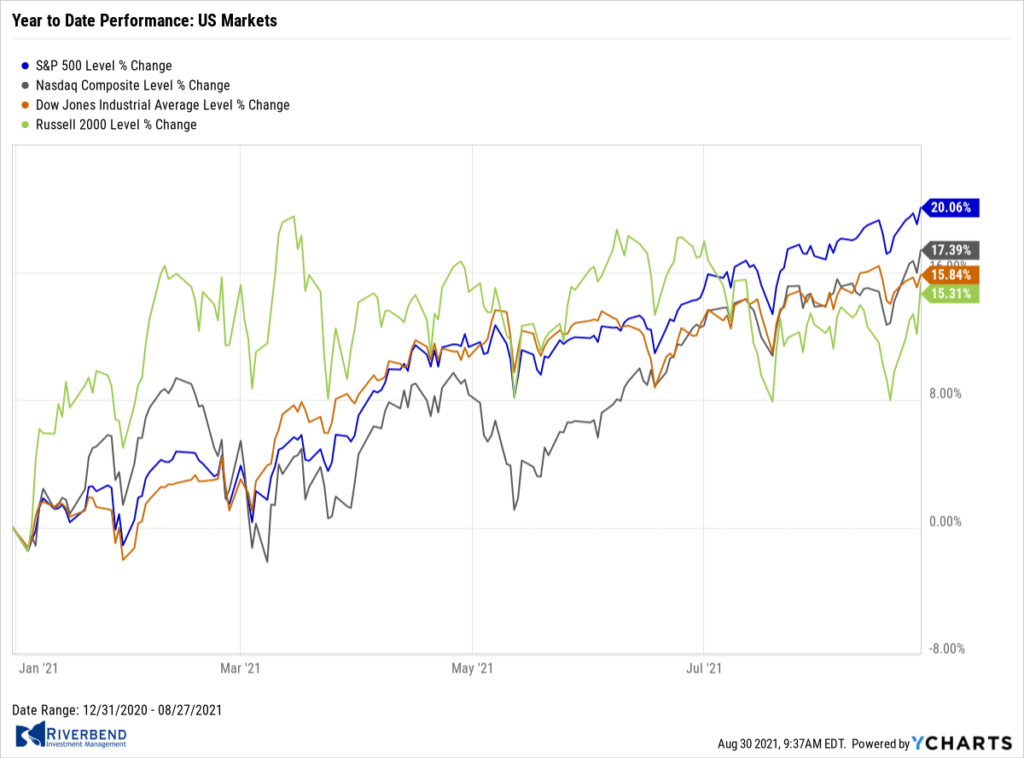
The benchmark U.S. equity indexes finished the week to the upside with the technology-heavy NASDAQ Composite outperforming the broader market S&P 500 and narrowly-focused Dow Jones Industrial Average.
The Dow Jones Industrial Average rose 336 points finishing the week at 35,456, a gain of 1%. The NASDAQ rallied 2.8% finishing at 15,130.
By market cap, the large cap S&P 500 added 1.5%, while the mid cap S&P 400 gained 3.4%; the small cap Russell 2000 lead the pack by surging 5.1%.
International Markets: 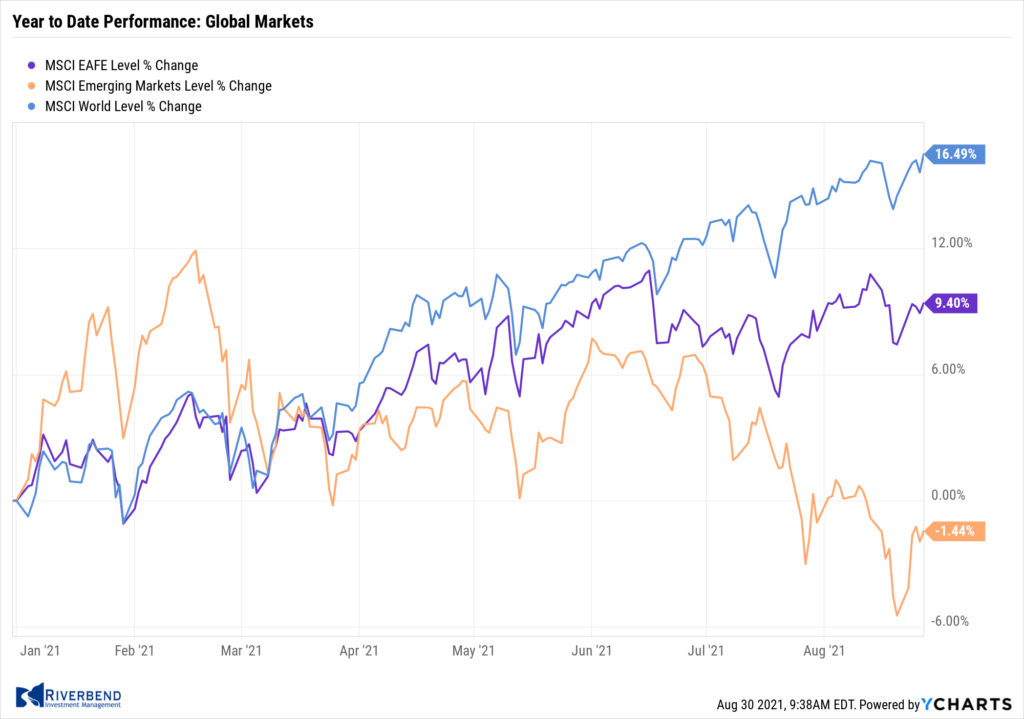
Major international markets were also positive for the week. Canada’s TSX gained 1.5%, while the United Kingdom’s FTSE 100 rose 0.8%. France’s CAC 40 and Germany’s DAX added 0.8% and 0.3%, respectively, while in Asia China’s Shanghai Composite finished up 2.8%. Japan’s Nikkei ended the week up 2.3%.
As grouped by Morgan Stanley Capital International, developed markets finished the week up 1.6% and emerging markets rallied 4.2%.
Commodities: 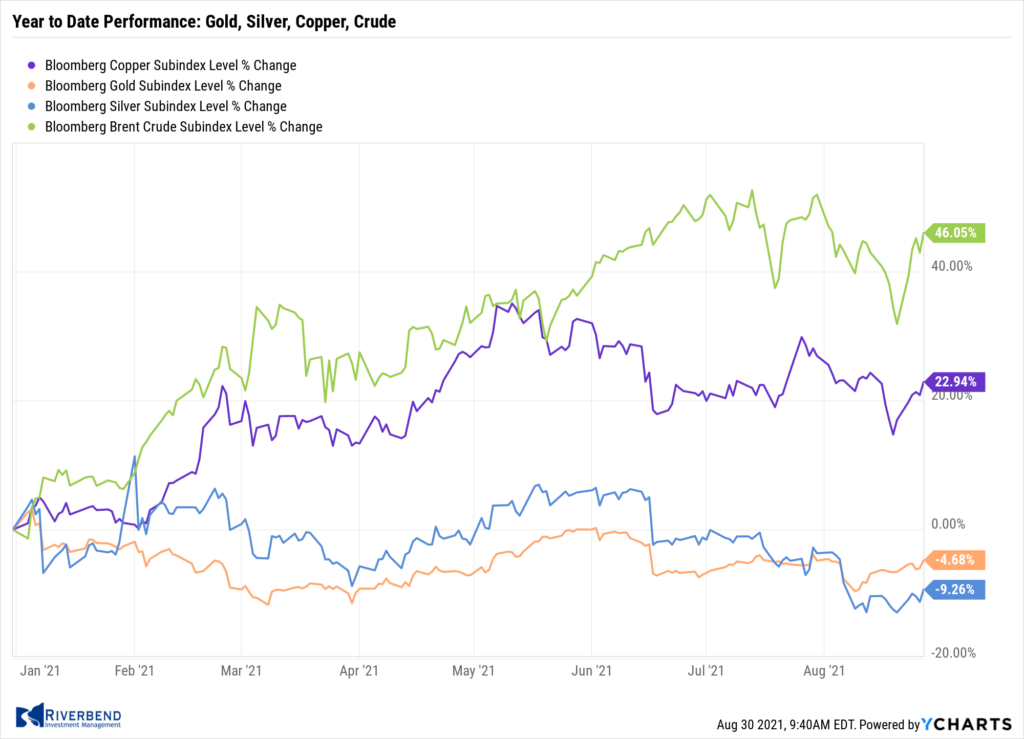
Precious metals rose as inflationary economic reports were released this week. Gold rose 2.0% to $1819.50 per ounce, while Silver added 4.1% finishing the week at $24.06.
Crude oil retraced all of last week’s decline by surging 10.6% to $68.74 per barrel of West Texas Intermediate crude.
The industrial metal copper, viewed by some analysts as a barometer of world economic health due to its wide variety of uses, finished the week up 4.7%.
U.S. Economic News: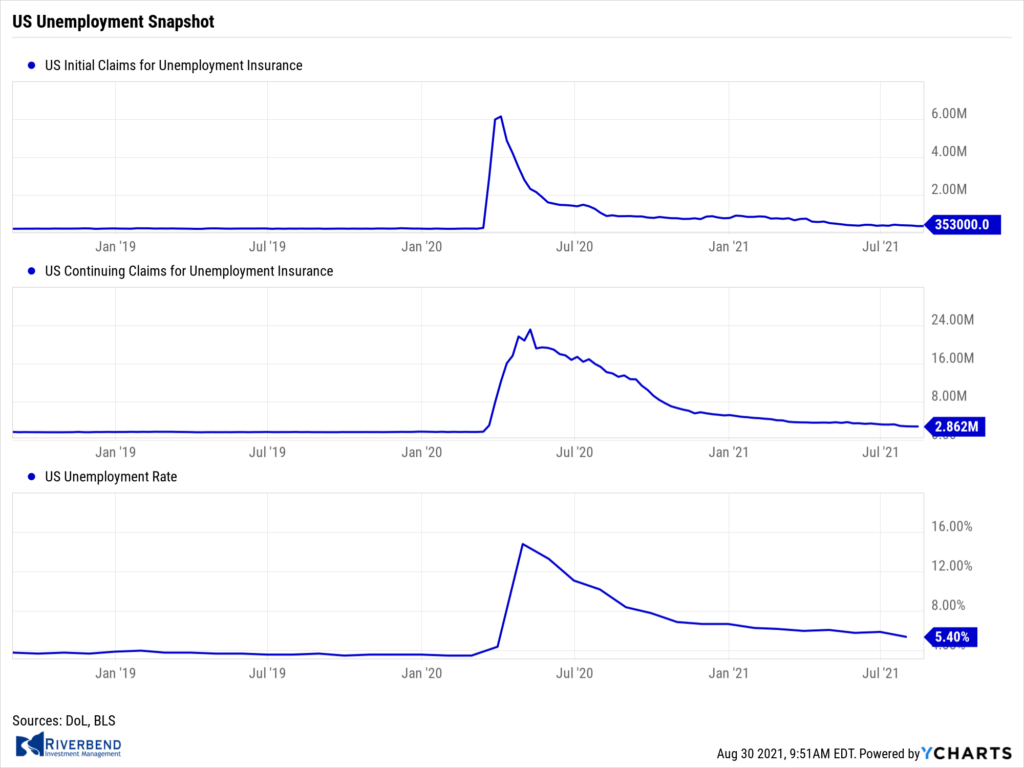
The number of Americans who applied for first-time unemployment benefits rose last week for the first time in over a month, but jobless claims remain near their pandemic lows. The Labor Department reported initial jobless claims increased by 4,000 to 353,000. Economists had expected claims to total 350,000.
For perspective, before the pandemic initial jobless claims averaged in the low 200,000’s, spiking as high as 6.9 million during the pandemic. Claims have been falling ever since. Meanwhile, continuing claims, which count the number of people already receiving benefits, dipped by 3,000 to 2.86 million. That number is also at a pandemic low.
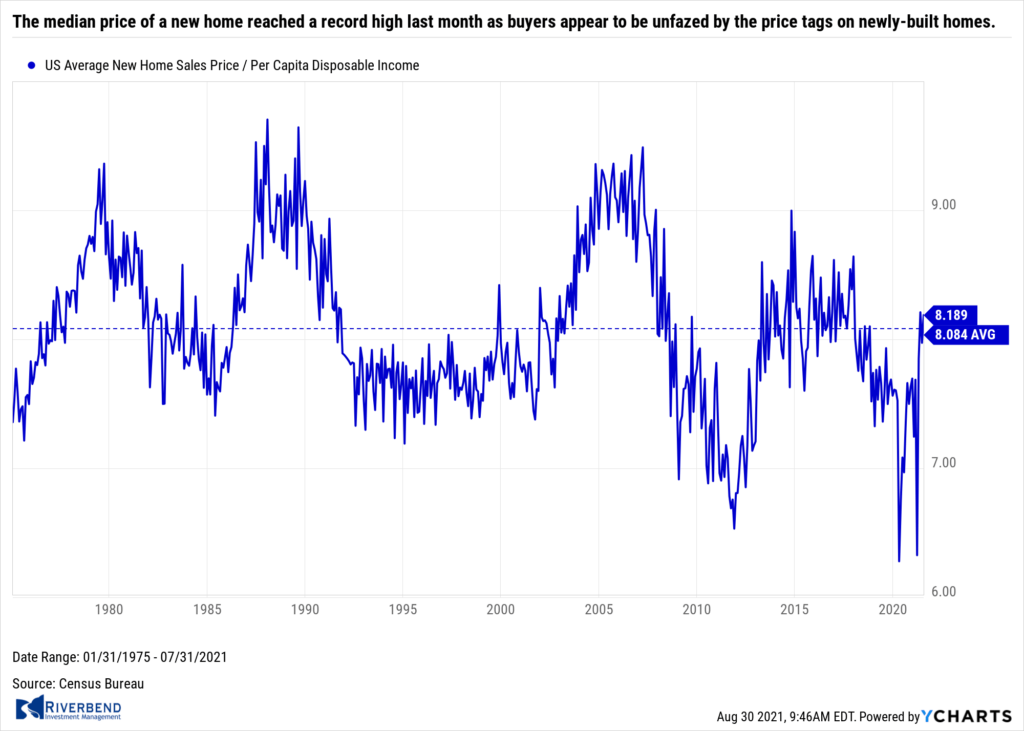
The median price of a new home reached a record high last month as buyers appear to be unfazed by the price tags on newly-built homes. The Census Bureau reported new-home sales increased 1% to an annual rate of 708,000 in July. The report exceeded expectations, as economists had forecast an annual sales rate of 700,000. Sales rates varied by region, with the Northeast and Midwest seeing declines of more than 20% compared to last month, while the West posted a 14% gain and the South a 1.3% uptick. The number of new homes for sale at the end of July increased 5.5% from the month prior, and were up 26% from the same time last year. The inventory in July equated to a 6.2-month supply, representing the highest level of supply in over a year.
Sales of existing homes rose as the inventory of homes for sale grew, giving relief to buyers who had been bidding up prices to excessive levels. The National Association of Realtors (NAR) reported existing-home sales rose 2% to a seasonally-adjusted 5.99 million in July. Economists had expected home sales to come in at 5.83 million. The median sales price of an existing home was $359,900, up 17.8% from the same time last year. Sales rose in three of the four regions nationally, with the Northeast the only region not to see an increase. The Midwest saw the largest gain from June, with a 3.8% uptick, followed by the West (up 3.3%) and the South (up 1.2%).
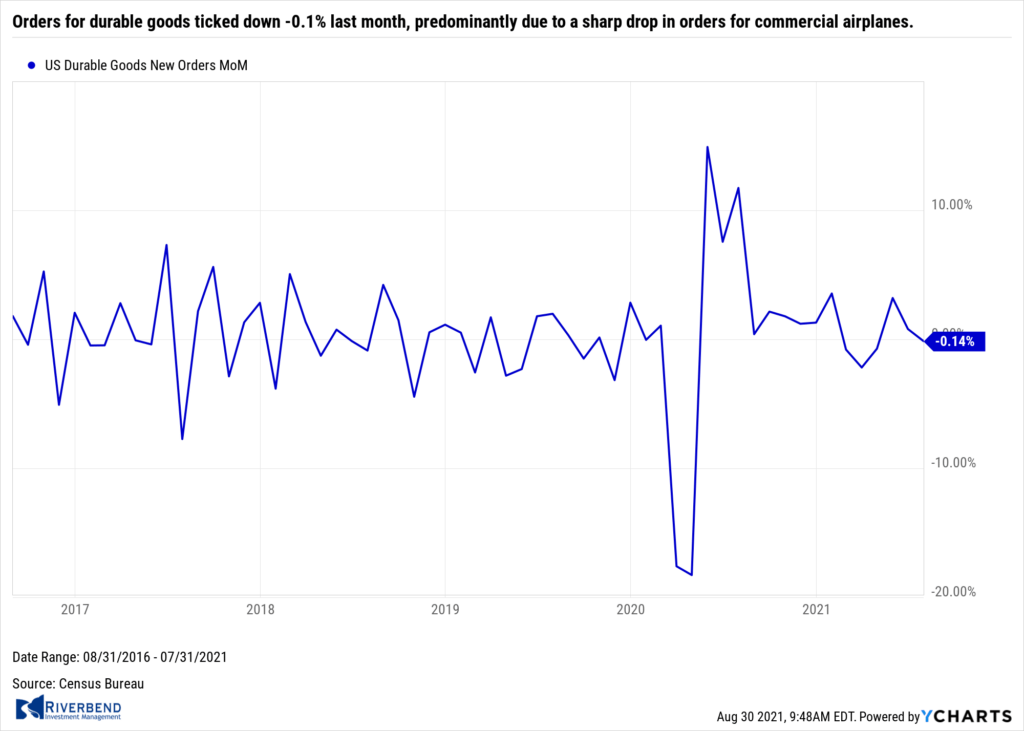
Orders for longer-lasting ‘durable’ goods dipped in July but analysts were quick to note the overall report was positive. The government reported orders for durable goods ticked down -0.1% last month, predominantly due to a sharp drop in orders for commercial airplanes. Removing the big-ticket transportation categories, new orders were actually up 0.7% last month. Citibank economists Andrew Hollenhorst and Veronica Clark said in a note to clients, “The underlying trend of demand for durable goods remains at very elevated levels and should support sustained production into 2022 as supply issues are eventually resolved.”
Spending among the nation’s consumers slowed in July but remained positive as inflation and the delta-variant of the coronavirus weighed on spending. The government reported consumer spending rose 0.3% last month, matching economists’ estimates. Analysts note the biggest potential obstacle for the economy is inflation tied to widespread shortages of labor and materials and Fed liquidity.
Consumer spending actually fell 0.1% in July if inflation is taken into account. The biggest increase in spending in July was on services such as dining out, renting hotel rooms or going on vacation. Spending fell on goods such as new cars and trucks, clothing and footwear. The Personal Consumption Expenditures Index—rumored to be the Federal Reserve’s preferred inflation measure, climbed to 4.2% in July—its highest level in 30 years. 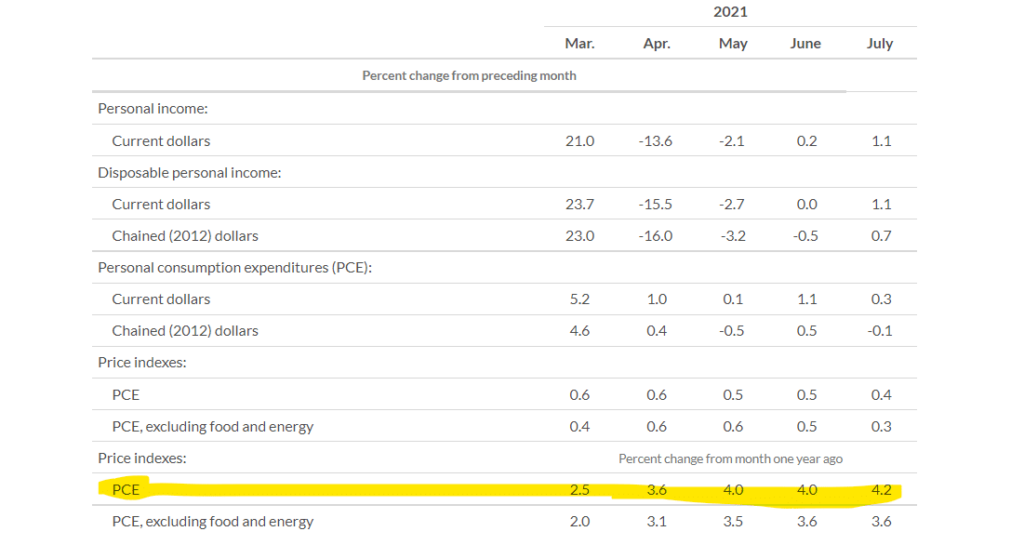
Source: U.S. Bureau of Economic Analysis
Federal Reserve Chairman Jerome Powell, in his closely-watched speech in Jackson Hole, Wyoming, stated he believed the central bank can begin to “taper” or slow its bond purchases. Powell said, “at the FOMC’s recent July meeting, I was of the view, as were most participants, that if the economy evolved broadly as anticipated, it could be appropriate to start reducing the pace of asset purchases this year.” This is the first time Powell has given his personal opinion publicly.
“My view is that the ‘substantial further progress’ test has been met for inflation. There has also been clear progress toward maximum employment,” Powell said. The Fed is buying $80 billion of Treasuries and $40 billion of mortgage-backed securities each month to put downward pressure on long-term interest rates and boost demand in the economy. However, Powell was careful not to say when the tapering would begin. Most market participants rated Powell’s remarks as “dovish” and the market responded positively.
Chart of the Week:
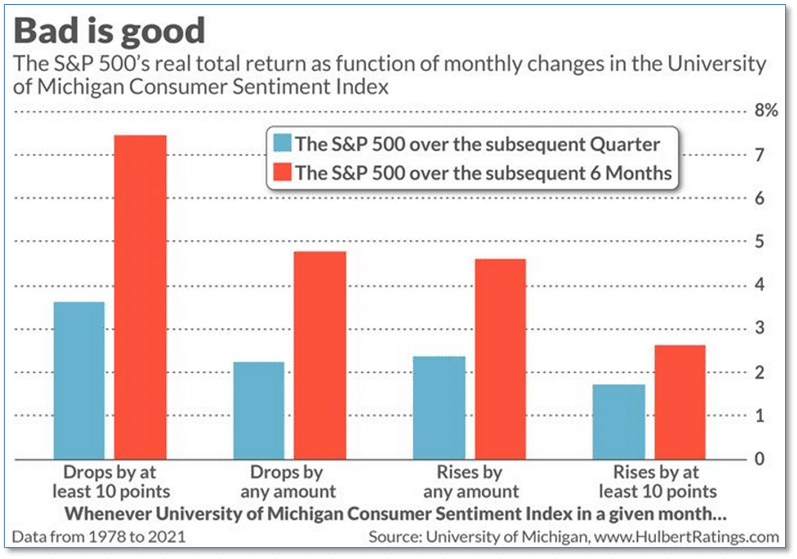
The University of Michigan reported a recent plunge in its Consumer Sentiment Index. Contrary to what you might logically expect, this is actually a positive for the stock market.
Analyst Mark Hulbert notes that the American consumer is a fairly reliable contrarian stock market indicator, and calculated the data in the chart below.
More often than not, large declines in consumer confidence have been followed by above-average stock market returns. As Warren Buffett says – it is wise for investors to be “fearful when others are greedy, and greedy when others are fearful.”
Riverbend Indicators:

Each week we post notable changes to the various market indicators we follow.
- As a reading of our Bull-Bear Indicator for U.S. Equities (comparative measurements over a rolling one-year timeframe), we remain in Cyclical Bull territory.
- Counting up of the number of all our indicators that are ‘Up’ for U.S. Equities, the current tally is that four of four are Positive, representing a multitude of timeframes (two that can be solely days/weeks, or months+ at a time; another, a quarter at a time; and lastly, the {typically} years-long reading, that being the Cyclical Bull or Bear status).
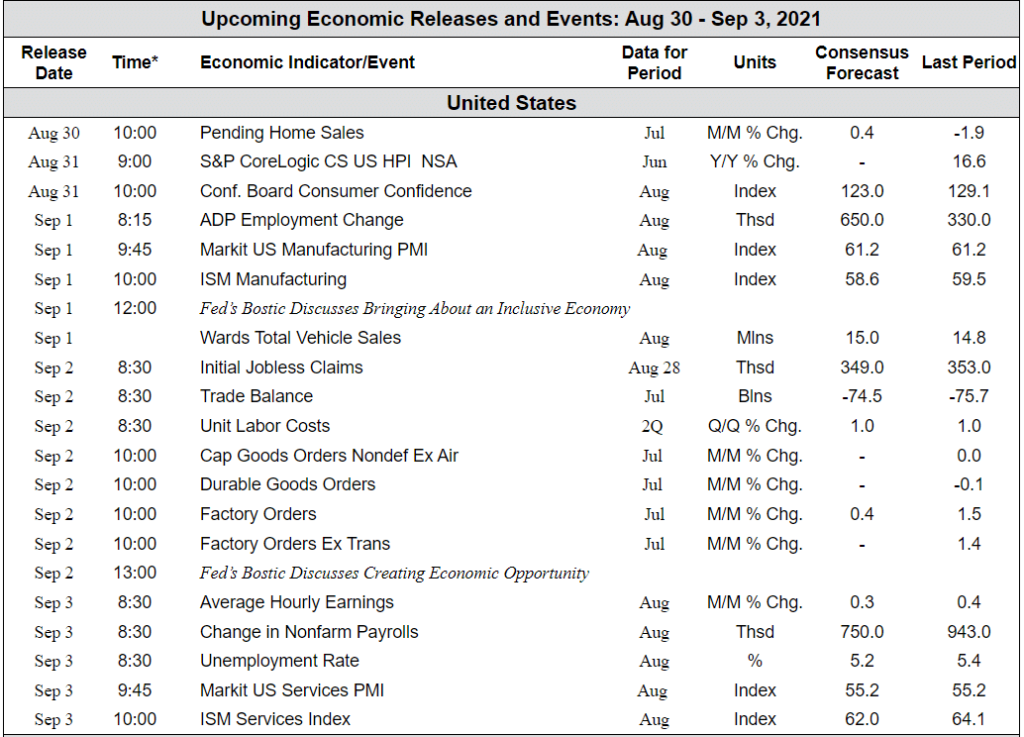
The Week Ahead:
(Sources: All index- and returns-data from Yahoo Finance; news from Reuters, Barron’s, Wall St. Journal, Bloomberg.com, ft.com, guggenheimpartners.com, zerohedge.com, ritholtz.com, markit.com, financialpost.com, Eurostat, Statistics Canada, Yahoo! Finance, stocksandnews.com, marketwatch.com, wantchinatimes.com, BBC, 361capital.com, pensionpartners.com, cnbc.com, FactSet, TD Economics.)


