U.S. Markets: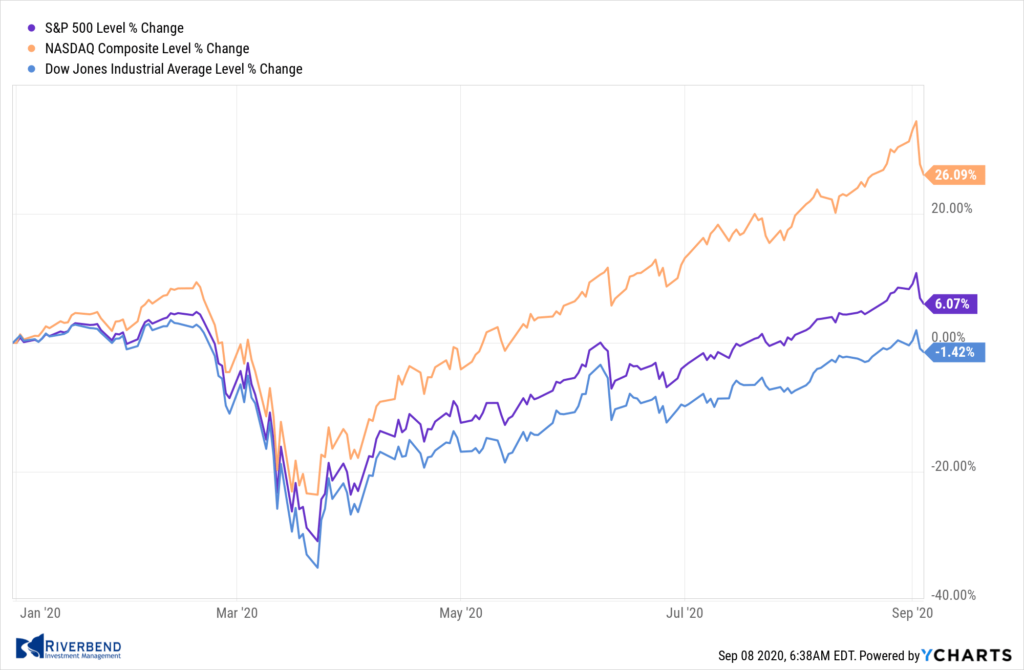
U.S. stocks finished the week lower as investors suddenly took profits on Thursday and Friday after setting new all-time highs on Wednesday on several benchmark indexes.
The technology-heavy NASDAQ Composite index suffered the deepest decline, giving up more than 3% on the week, but still remains comfortably up year-to-date. The Dow Jones Industrial Average tumbled by more than 500 points to finish the week at 28,133, a decline of -1.8%. The NASDAQ capped five consecutive weeks of gains with a -3.3% decline.
By market cap, the large cap S&P 500 retreated ‑2.3%, while the mid cap S&P 400 and small cap Russell 2000 declined -2.5% and -2.7%, respectively.
International Markets: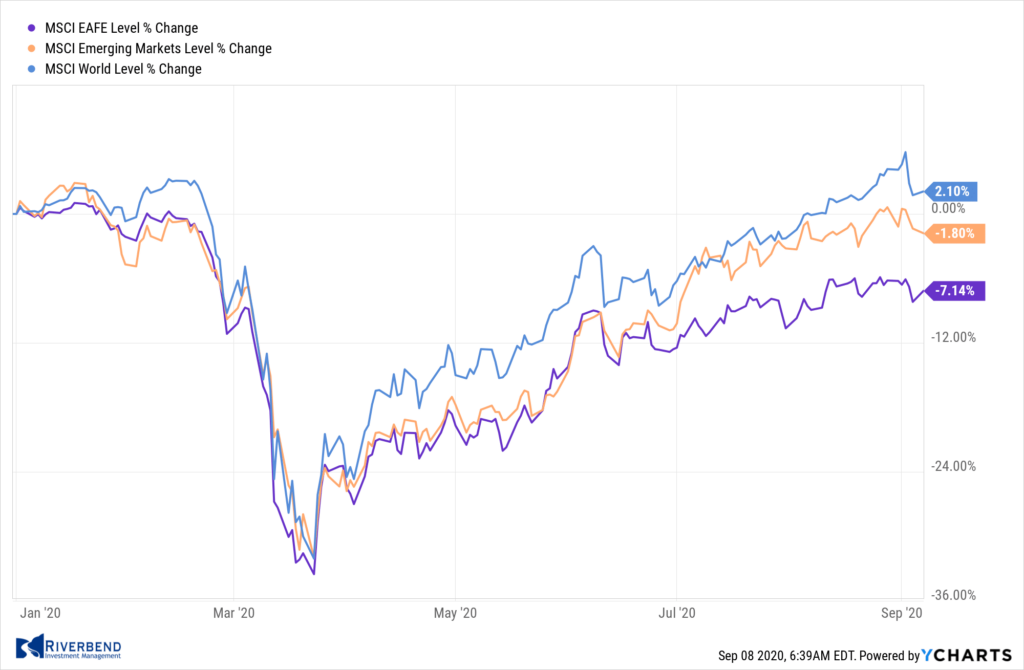
Canada’s TSX declined -2.9% and the United Kingdom’s FTSE 100 gave up -2.8%. On Europe’s mainland, France’s CAC 40 declined -0.8%, Germany’s DAX fell -1.5%, and Italy’s Milan FTSE retreated -2.3%.
In Asia, China’s Shanghai Composite ended down -1.4%, while Japan’s Nikkei was the lone major market winner, gaining 1.4%.
As grouped by Morgan Stanley Capital International, developed markets fell -1.5%, while emerging markets declined a steeper -2.7%.
Commodities: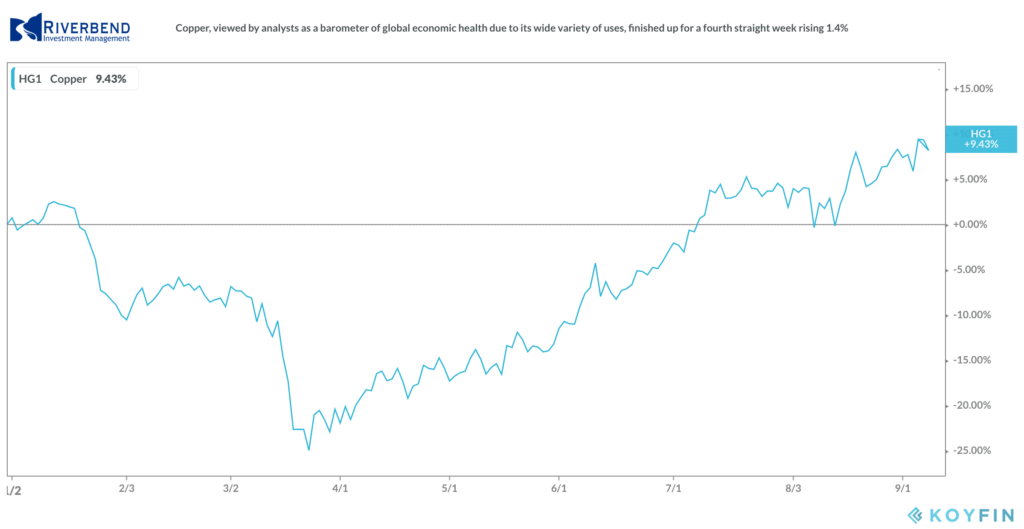
Precious metals were unable to finish the week in the green despite the weakness in the equities markets. Gold declined -2.1% to $1934.30 an ounce, while Silver finished the week at $26.71 per ounce, a decline of -3.9%.
Oil, too, finished the week down after four consecutive weeks of gains. West Texas Intermediate crude oil fell -7.5% to $39.77 per barrel.
On the other hand, the industrial metal copper, viewed by analysts as a barometer of global economic health due to its wide variety of uses, finished up for a fourth straight week rising 1.4%.
U.S. Economic News:
The number of Americans seeking first-time unemployment benefits fell sharply last week to a new pandemic low. The Labor Department reported initial jobless claims fell by 130,000 to a seasonally-adjusted 881,000 in the last week of August.
Economists had expected 940,000 new claims. It was the fifth consecutive week in which unadjusted claims have been below one million. Still, jobless claims remain exceedingly high. They averaged in the low 200,000s and stood near a half-century low just before the coronavirus pandemic broke out in February.
Continuing claims, which counts the number of people already receiving benefits, fell to a seasonally-adjusted 13.25 million from 14.49 million in the week ended August 22. That number is reported with a one-week delay.
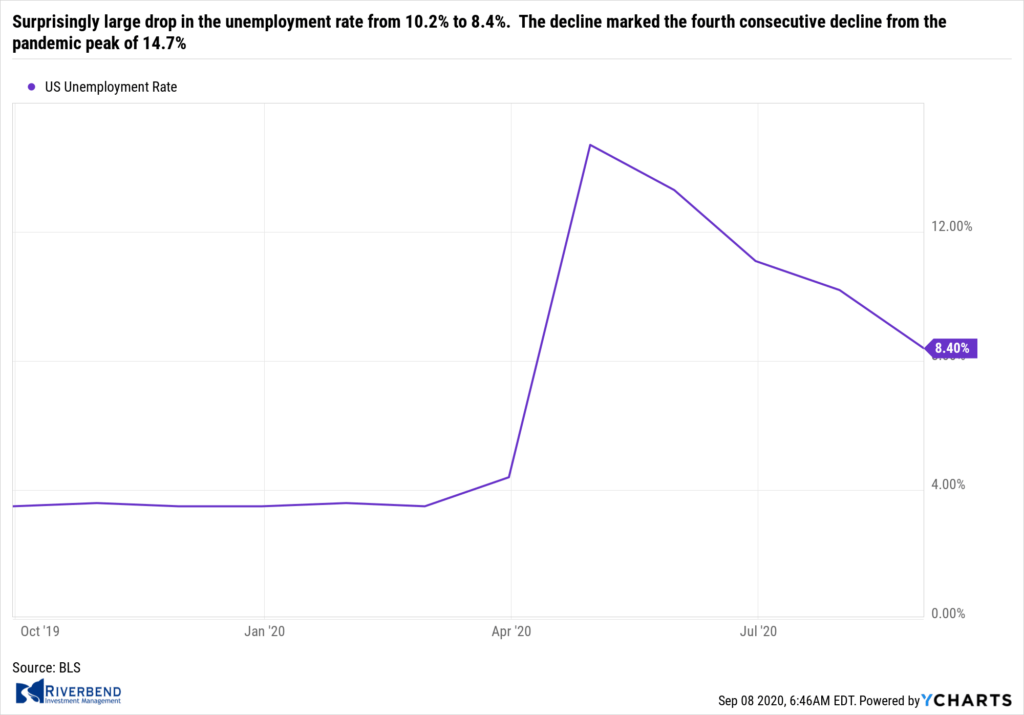 The jobs recovery from the pandemic continued in August, but at a slower pace. Nonfarm payrolls expanded by 1.4 million in August, 50,000 above the consensus. However, the big story in the release was the surprisingly large drop in the unemployment rate from 10.2% to 8.4%. The decline marked the fourth consecutive decline from the pandemic peak of 14.7%. “I would say today’s jobs report was a good one,” Federal Reserve Chairman Jerome Powell stated in an interview.
The U.S. shed more than 22 million jobs during the worst of the pandemic. So far it has restored about 10.7 million jobs, leaving about half of the people who were laid off still out of work. A broader measure of unemployment known as the U6 rate suggests the “real” rate was 14.2% in August, down from 16.5% in the prior month. The U6 rate includes workers who can only find part-time work and those who have become discouraged.
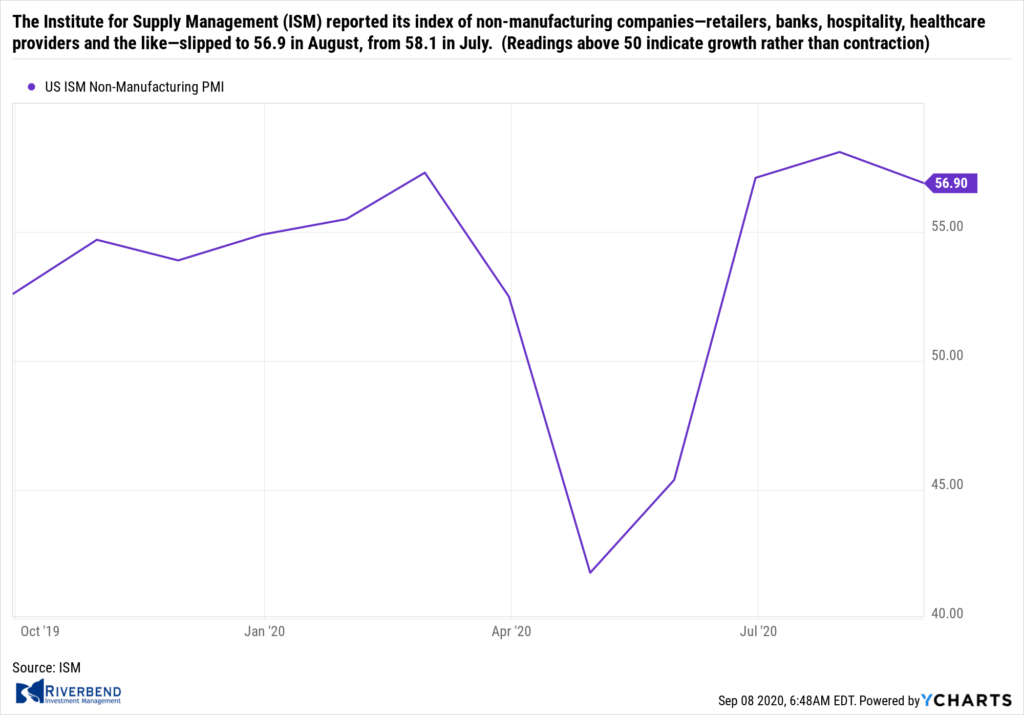 The services sector, which makes up the vast majority of the U.S. economy, expanded again in August—but companies still haven’t brought back most of their workers amid the uncertainty of the coronavirus. The Institute for Supply Management (ISM) reported its index of non-manufacturing companies—retailers, banks, hospitality, healthcare providers and the like—slipped to 56.9 in August, from 58.1 in July. Readings above 50 indicate growth rather than contraction. The reading was only slightly below the consensus of 57.0.
In the report, new orders and production both grew more slowly in August, but they still showed a marked improvement from several months ago. Employment levels, meanwhile, continued to stabilize after massive layoffs and furloughs earlier in the year. ISM’s employment gauge rose to 47.9 from 42.1, marking the highest level since the pandemic began in March.
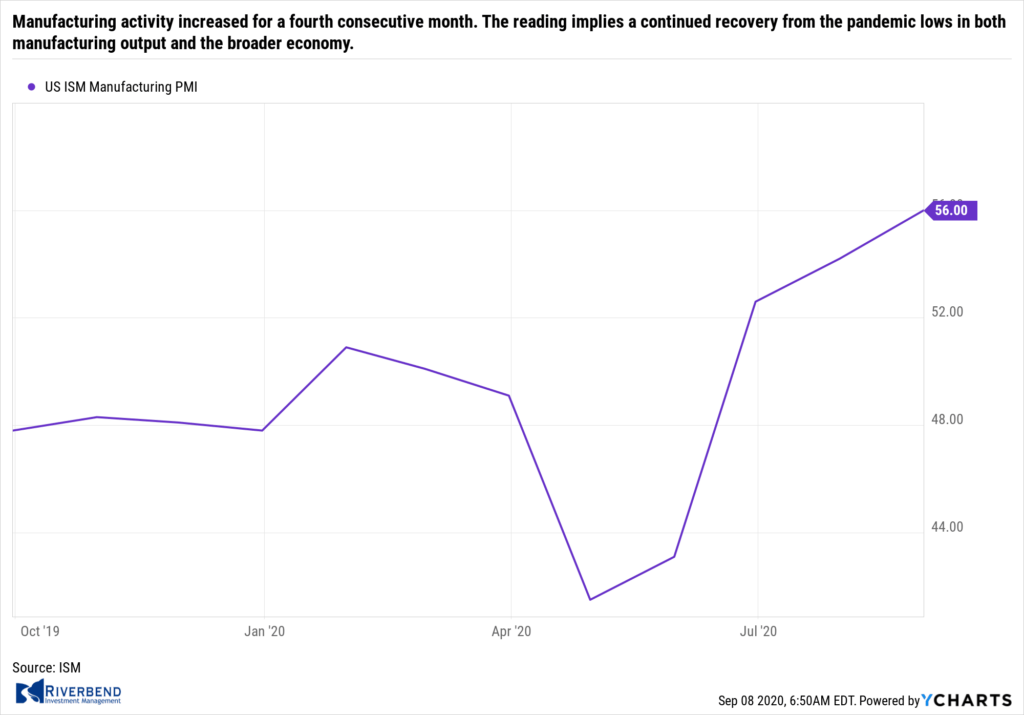 Manufacturing activity increased for a fourth consecutive month, according to the latest data from the Institute for Supply Management (ISM). ISM reported that its manufacturing index climbed 1.8 points to a 21-month high of 56.0. Economists had expected a reading of 55.0. The reading implies a continued recovery from the pandemic lows in both manufacturing output and the broader economy.
Four of the five ISM index components increased last month, led by a 6.1-point jump in new orders to 67.6, the highest level since January 2004. Furthermore, production increased at its fastest pace since the beginning of 2018. Similarly, research firm Markit reported its U.S. Manufacturing Purchasing Managers’ Index (PMI) rose 2.2 points in August to 53.1—its highest level since January 2019. Markit reported strong upturns in output and new orders, boosted by firmer export orders.
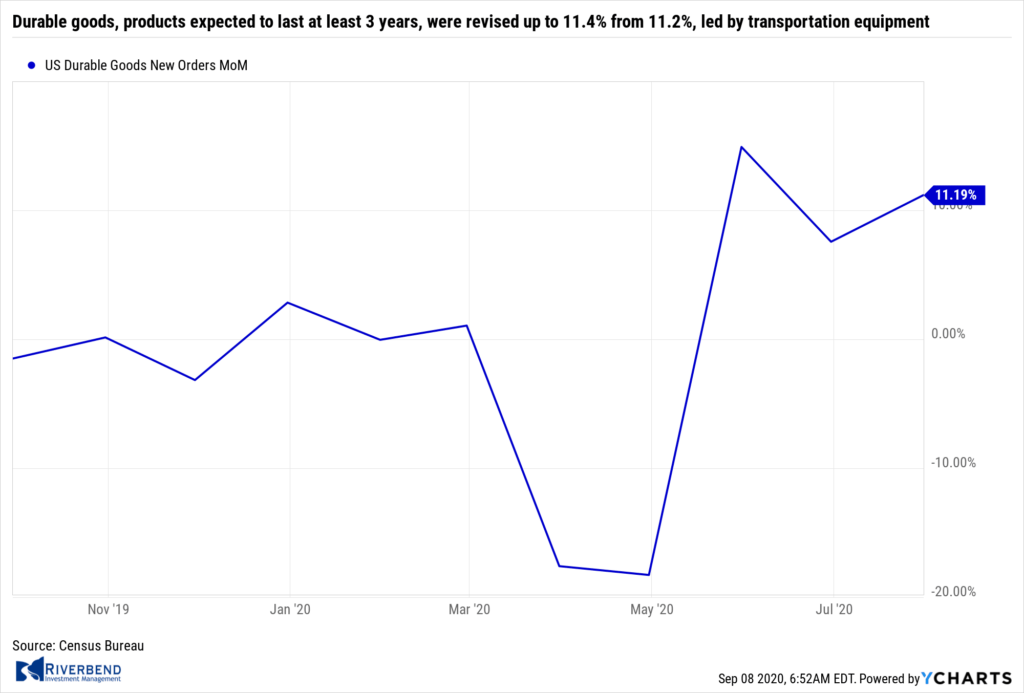 The Commerce Department reported that factory orders jumped 6.4% in July, the third consecutive increase. Economists had expected an increase of 6.2%. Durable goods, products expected to last at least 3 years, were revised up to 11.4% from 11.2%, led by transportation equipment.
Orders for nondefense capital goods ex-aircraft, a proxy for capital expenditures, rose 1.9% also up a third straight month. Nondurable goods rose 1.8%, led by petroleum products. On a year-over-year trend basis, factory orders were down 10.9%, but the negative momentum has abated since May.
“Continued uncertainty and volatility related to the pandemic, and its negative effect on consumer and business activity, was a theme echoed across the country,” the central bank’s Beige Book reported.
The Federal Reserve’s ‘Beige Book’, a collection of anecdotes from each of the Federal Reserve’s member banks, softened in August as many parts of the country expanded at slower pace of growth and reported lingering anxiety over the coronavirus. “Continued uncertainty and volatility related to the pandemic, and its negative effect on consumer and business activity, was a theme echoed across the country,” the central bank’s Beige Book reported.
Nonetheless, the Fed said manufacturers in most of the country grew again. Consumer spending on houses and new cars and trucks were also bright spots. Yet total spending by both businesses and consumers was still well below pre-crisis levels. Energy producers and farmers in particular suffered from low prices and little prospect of any improvement soon.
Chart of the Week: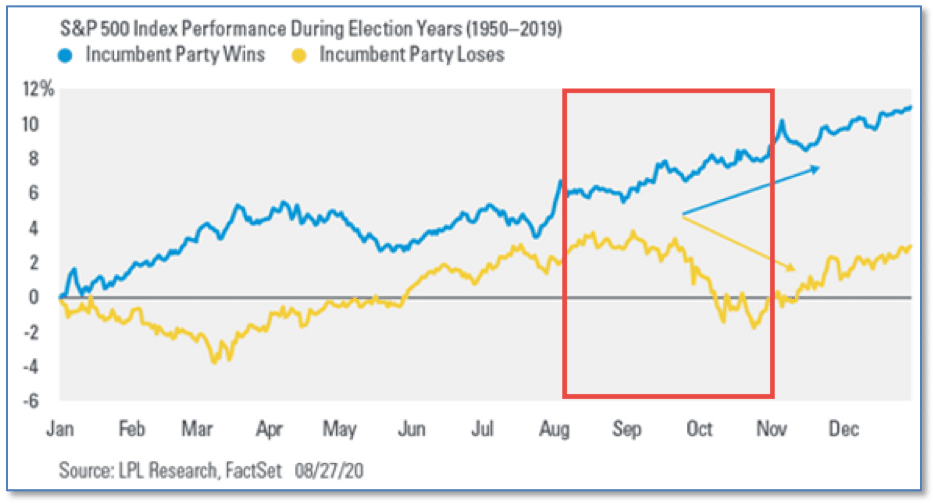
Ryan Detrick, chief market strategist at LPL Financial, published a study this week in which he said a simple equity-market chart has been the best predictor of U.S. presidential elections since 1984, proving 100% accurate—and is 87% accurate since 1928.
The LPL analyst says that a chart of the S&P 500’s performance in the three-month period ahead of Election Day, which is Nov. 3 this year, has proven accurate over the past nearly four decades.
If the S&P 500 declines during this 3-month stretch, the incumbent party loses, but if the S&P 500 rises during this 3-month period, the incumbent party wins. (Chart from LPL Financial)
Riverbend Indicators Update:
Each week we post notable changes to the various market indicators we follow.
- As a reading of our Bull-Bear Indicator for U.S. Equities (comparative measurements over a rolling one-year timeframe), we remain in Cyclical Bull territory.
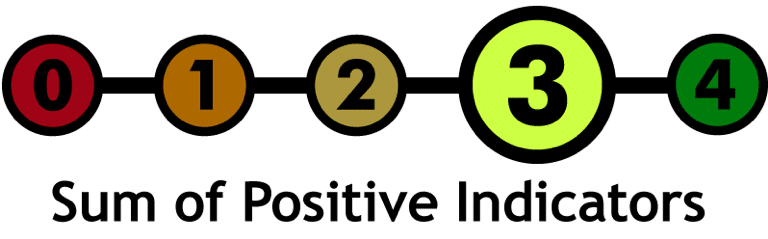
- Counting-up of the number of all our indicators that are ‘Up’ for U.S. Equities, the current tally is that three of four are Positive, representing a multitude of timeframes (two that can be solely days/weeks, or months+ at a time; another, a quarter at a time; and lastly, the {typically} years-long reading, that being the Cyclical Bull or Bear status).
Note: One of our short term indicators did reverse last week. This is a very short term and volatile indicator. Used alone, it is not very accurate however, used in combination with our indicators, it’s accuracy increases. We will be watching closely to see if any of our less volatile indicators confirm the short term signal this week.
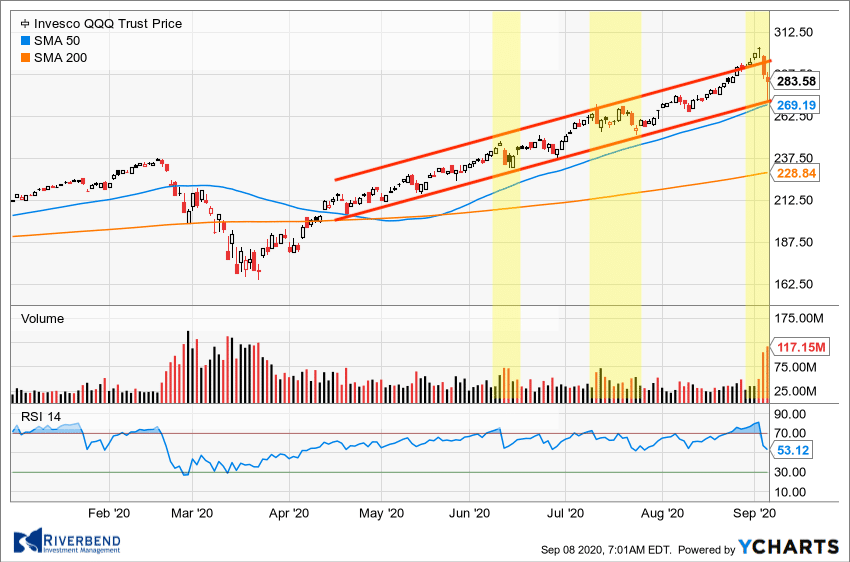
Despite the pullback in Nasdaq equities at the end of last week, the upward trend formed from the March lows still remains intact. As the large institutional traders come back from summer vacation this week, we will get a better idea of how they plan to allocate their equity exposure.
For now, the tech-heavy Nasdaq looks to be retreating from a short term overbought condition — retreating quickly to the bottom of its trend channel.
This week watch for either a test or violation of the trend.
The Week Ahead:
Tuesday:
- U.S. NFIB Small Business Index 99.0 exp, 98.8 prior
- U.S. IBD/TIPP Economic Optimism 47.3 exp, 46.8 prior
- U.S. Consumer Credit 12.9 bln exp, 8.9 bln prior
- China CPI y/y +2.4% exp, +2.7% prior
Wednesday:
- U.S. JOLTS Job Openings 6.05 mln exp, 5.89 mln prior
- U.S. 10-year Note Auction 0.68 WI, 2.4 b/c
Thursday:
- French Industrial Production m/m +5.1% exp, +12.7% prior
- ECB Monetary Policy Statement
- U.S. Core PPI m/m +0.2% exp, +0.5% prior
- U.S. Unemployment Claims 838k exp, 881k prior
Friday:
- UK Industrial Production m/m +4.2% exp, +9.3% prior
- U.S. Core CPI m/m N/A exp, +0.6% prior
(Sources: All index- and returns-data from Yahoo Finance; news from Reuters, Barron’s, Wall St. Journal, Bloomberg.com, ft.com, guggenheimpartners.com, zerohedge.com, ritholtz.com, markit.com, financialpost.com, Eurostat, Statistics Canada, Yahoo! Finance, stocksandnews.com, marketwatch.com, wantchinatimes.com, BBC, 361capital.com, pensionpartners.com, cnbc.com, FactSet.)


