[fusion_builder_container hundred_percent=”no” equal_height_columns=”no” menu_anchor=”” hide_on_mobile=”small-visibility,medium-visibility,large-visibility” class=”” id=”” background_color=”” background_image=”” background_position=”center center” background_repeat=”no-repeat” fade=”no” background_parallax=”none” parallax_speed=”0.3″ video_mp4=”” video_webm=”” video_ogv=”” video_url=”” video_aspect_ratio=”16:9″ video_loop=”yes” video_mute=”yes” overlay_color=”” video_preview_image=”” border_size=”” border_color=”” border_style=”solid” padding_top=”” padding_bottom=”” padding_left=”” padding_right=””][fusion_builder_row][fusion_builder_column type=”1_1″ layout=”1_1″ background_position=”left top” background_color=”” border_size=”” border_color=”” border_style=”solid” border_position=”all” spacing=”yes” background_image=”” background_repeat=”no-repeat” padding_top=”” padding_right=”” padding_bottom=”” padding_left=”” margin_top=”0px” margin_bottom=”0px” class=”” id=”” animation_type=”” animation_speed=”0.3″ animation_direction=”left” hide_on_mobile=”small-visibility,medium-visibility,large-visibility” center_content=”no” last=”no” min_height=”” hover_type=”none” link=””][fusion_text columns=”” column_min_width=”” column_spacing=”” rule_style=”default” rule_size=”” rule_color=”” hide_on_mobile=”small-visibility,medium-visibility,large-visibility” class=”” id=”” animation_type=”” animation_direction=”left” animation_speed=”0.3″ animation_offset=””]
U.S. Markets: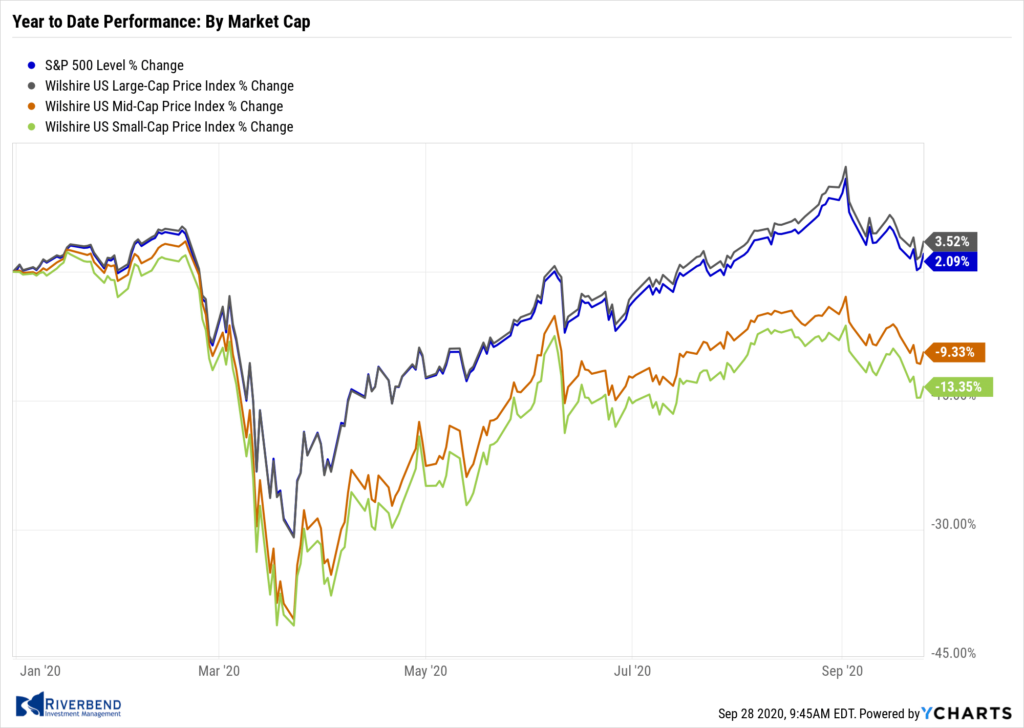
The large-cap benchmark S&P 500 suffered a fourth week of declines, sending the index briefly into correction territory (defined as down 10% or more from its recent peak).
The Dow Jones Industrial Average gave up 483 points to end the week at 27,174, a decline of -1.7%.
The technology-heavy NASDAQ Composite went the other way, finishing the week up 1.1%.
By market cap, the large cap S&P 500 gave up -0.6%, while the mid cap S&P 400 and small cap Russell 2000 declined -2.6% and -4.0%, respectively.
International Markets: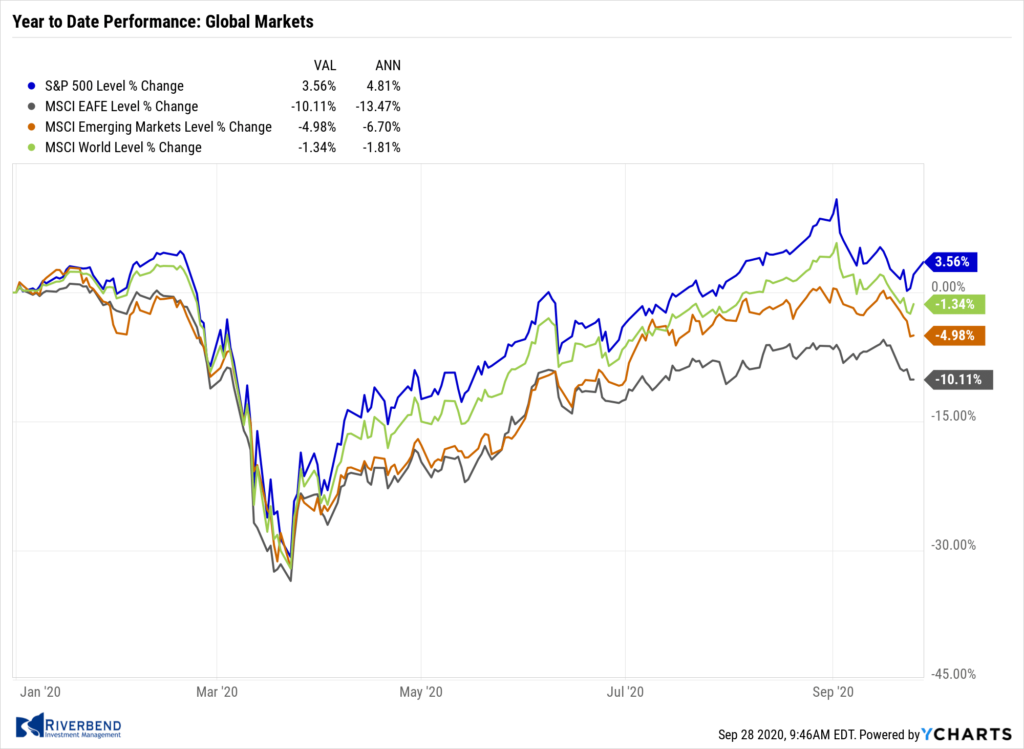
Major international markets were a sea of red this week. Canada’s TSX fell -0.8%, while the UK’s FTSE 100 retreated -2.7%. France’s CAC 40 plunged -5.0% along with Germany’s DAX which fell -4.9%.
In Asia, China’s Shanghai Composite ended down -3.6% while Japan’s Nikkei declined -0.7%.
As grouped by Morgan Stanley Capital International, developed markets retreated -3.1% while emerging markets gave up -3.5%.
Commodities: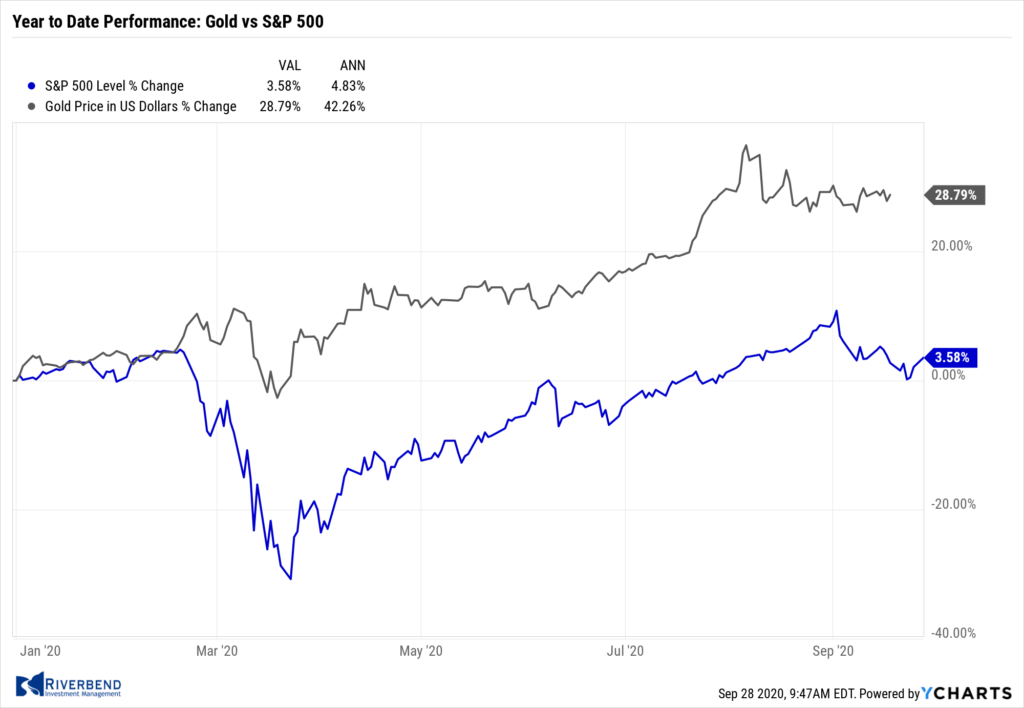
Commodities continued to sell off, with precious metals leading the way. Gold fell -$95.80 to $1866.30 an ounce, a decline of -4.9%. Silver plunged a much larger -14.9% to $23.09 per ounce.
Crude oil declined as well. West Texas Intermediate crude oil fell by -2.6% to $40.25 per barrel.
The industrial metal copper, viewed by some analysts as a barometer of world economic health due to its wide variety of uses, ended the week down -4.7%.
U.S. Economic News:
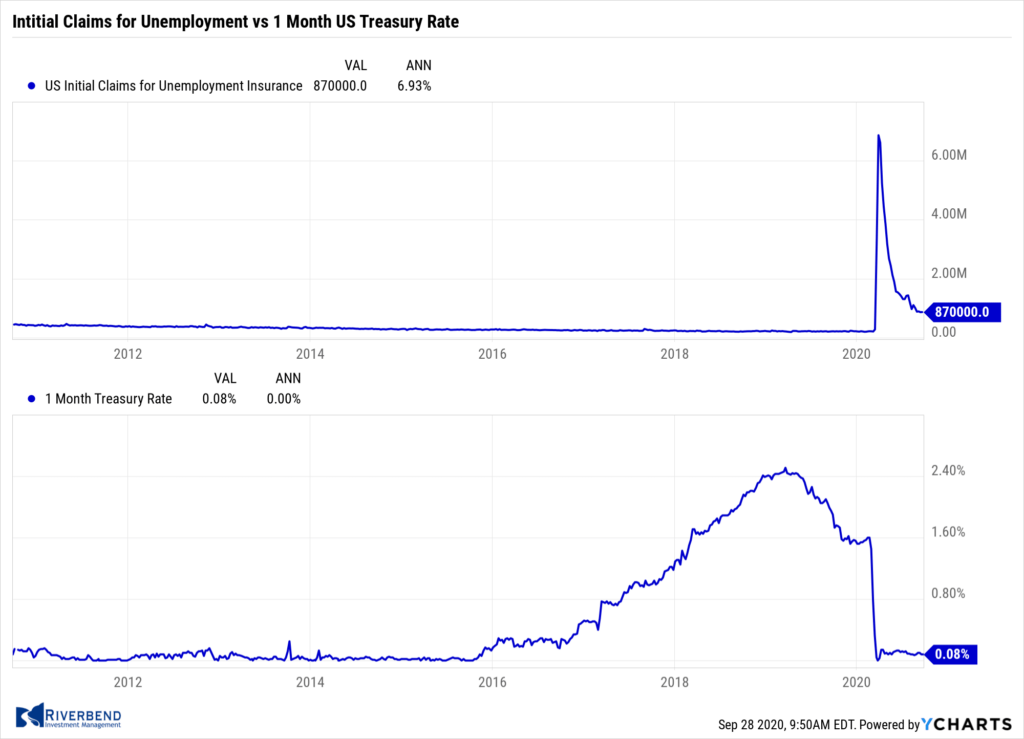 The Labor Department reported the number of Americans applying for first-time unemployment benefits rose by 4,000 to 870,000. Economists had estimated claims to decline to 850,000. The four-week moving average of initial claims, smoothed to iron-out the weekly volatility, fell 35,250 to 878,250 in the latest week. Continuing claims, which counts the number of people already receiving benefits, fell by 167,000 to 12.58 million. That is the lowest level of continued claims since mid-April. Overall, jobless claims have been drifting lower in recent weeks. Roughly half of the 22 million payroll jobs that were lost in March and April have been regained as Americans return to work.
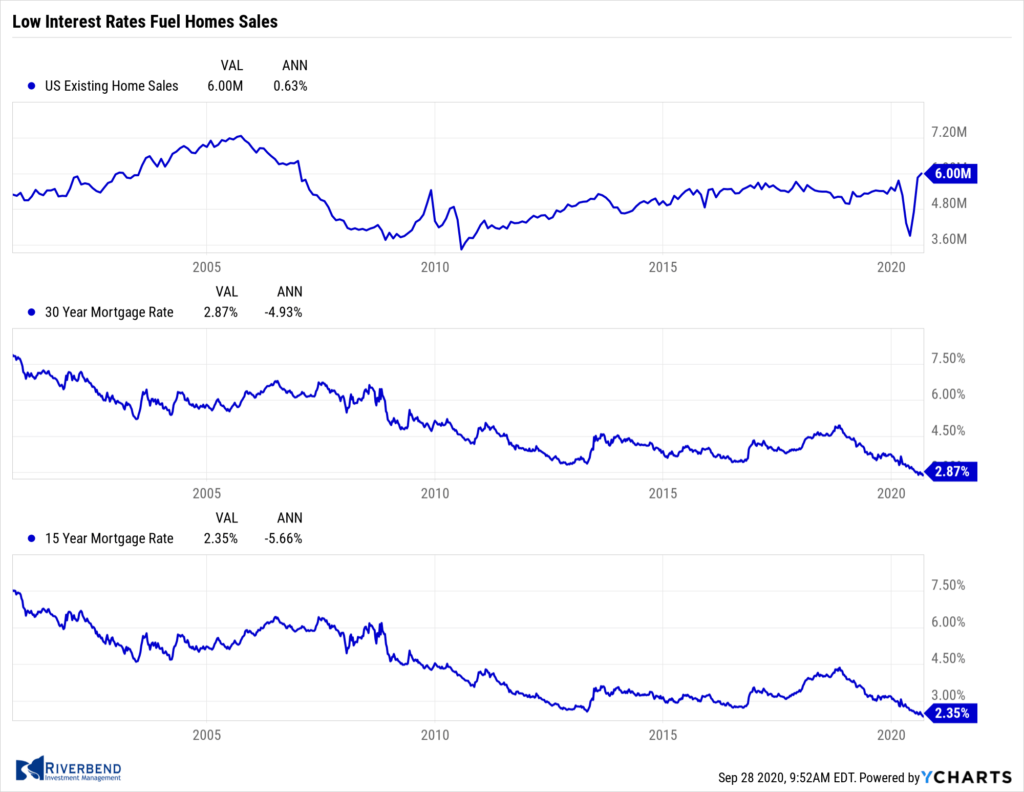 Sales of existing homes jumped last month at the fastest pace in more than a decade. The National Association of Realtors reported total existing home sales rose 2.4% from July to a seasonally-adjusted annual rate of 6 million. It was the third consecutive month of increases and its fastest pace since December 2006. Compared with the same time last year, home sales were up 10.5%. By region, the Northeast experienced the biggest jump in sales, up 13.8%, while the West and South were only up 0.8%. Economists noted that wildfires in the West and stormy weather in the South hampered activity in those regions.
As sales increased, so did prices. The median existing-home price was $310,600 in August, up 11.4% from a year ago. Tightening inventory contributed to the rise in prices. Unsold inventory sat at a 3-month supply in August, compared to the 6 months inventory that is generally considered to be a “balanced” housing market.
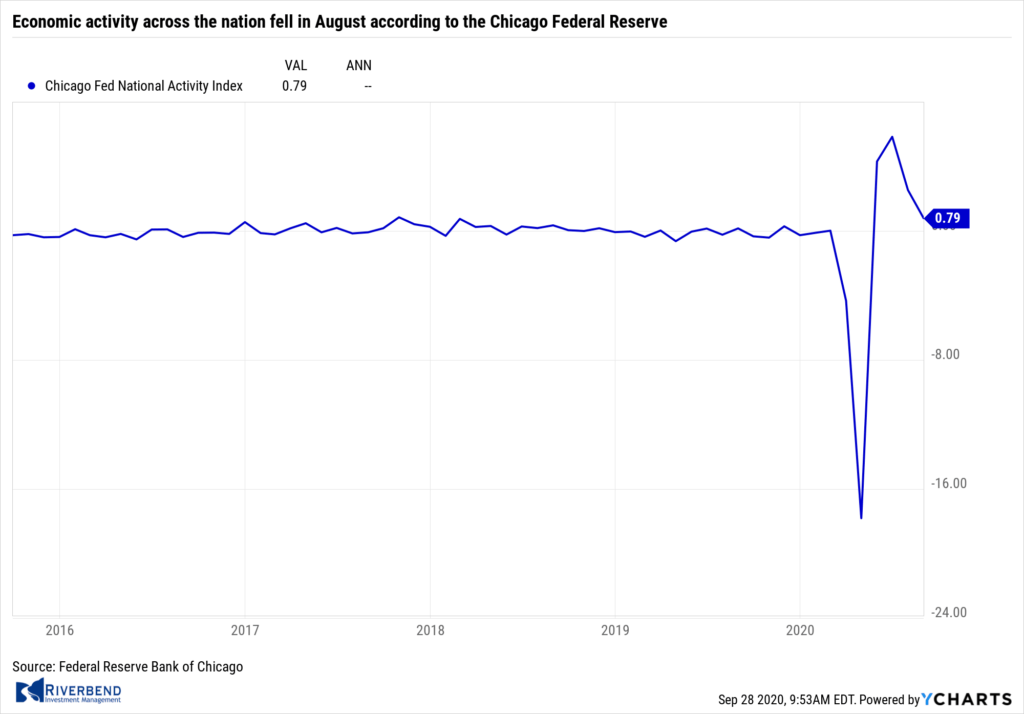 Overall economic activity across the nation fell in August according to the Chicago Federal Reserve. The Chicago Fed’s National Activity Index came in at 0.79 from a revised 2.54 the prior month. A zero value indicates the national economy is expanding at its historic trend rate of growth. The index’s three-month moving average, which tries to smooth out volatility, slipped to 3.05 from 4.23 in July.
The Chicago Fed index is a weighted average of 85 economic indicators. 45 component indicators made positive contributions in August. Still, 40 indicators deteriorated from July’s level. Production-related indicators contributed 0.23 to the overall index in August, down from 1.26 in the prior month. Employment-related indicators added 0.63, down from 0.65 in July.
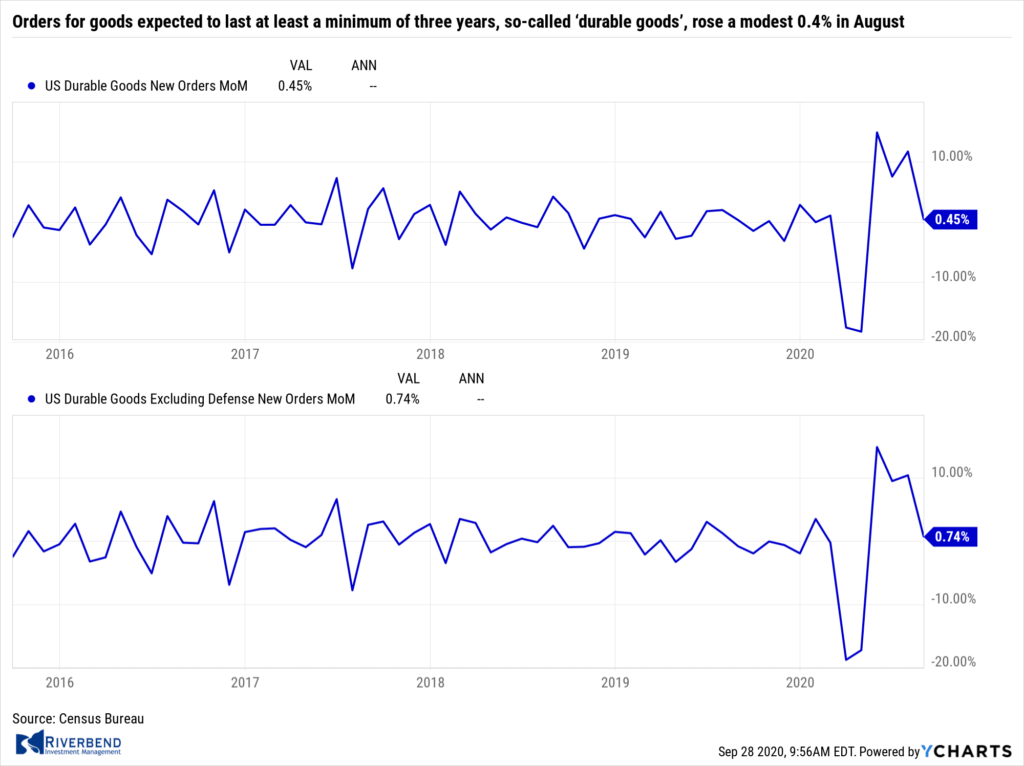 Orders for goods expected to last at least a minimum of three years, so-called ‘durable goods’, rose a modest 0.4% in August, the Census Bureau reported. The reading was its fourth consecutive monthly increase. Economists had expected a 1.5% rise. Stripping out transportation (planes and vehicles), orders were still up 0.4%.
Excluding defense goods, orders were up 0.7%. Core capital goods orders (ex-defense and aircraft) rose 1.8% in August. This category has now risen above its pre-COVID trend. Manufacturing has rebounded well from the shutdown due to the pandemic. Chicago Fed President Charles Evans said manufacturing firms have some advantages because they have an engineering environment and are better able to keep employees safe.
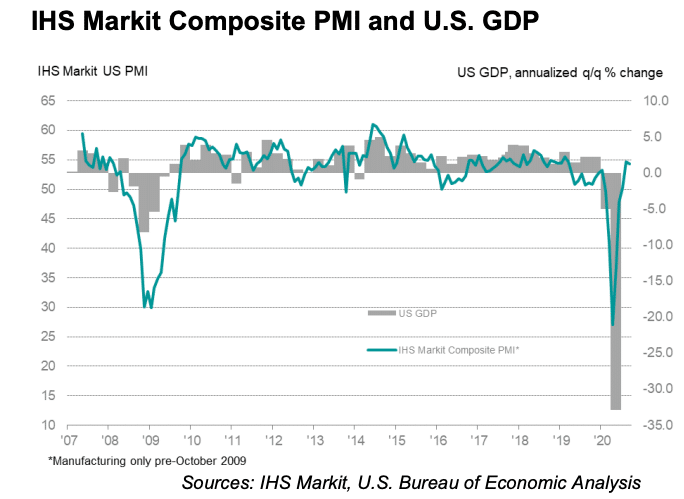 Market research firm IHS Markit reported business activity rose at a slightly weaker pace in September. Markit’s composite Purchasing Managers Index (PMI) retreated 2.2 points to 54.4 this month, but still in expansion territory. In the services sector, its flash PMI ticked down to 54.6 from 55 in August. Its flash manufacturing index rose 0.4 point to 53.5 – a 20-month high. Readings above 50 indicate improving conditions. The flash estimate is based on approximately 85-90% of total survey responses each month. Chris Williamson, chief business economist at IHS Markit, stated in the report, “The question now turns to whether the economy’s strong performance can be sustained in the fourth quarter. Risks…seem tilted to the downside for the coming months as businesses await clarity with respect to both the pandemic and the election.”
Chart of the Week: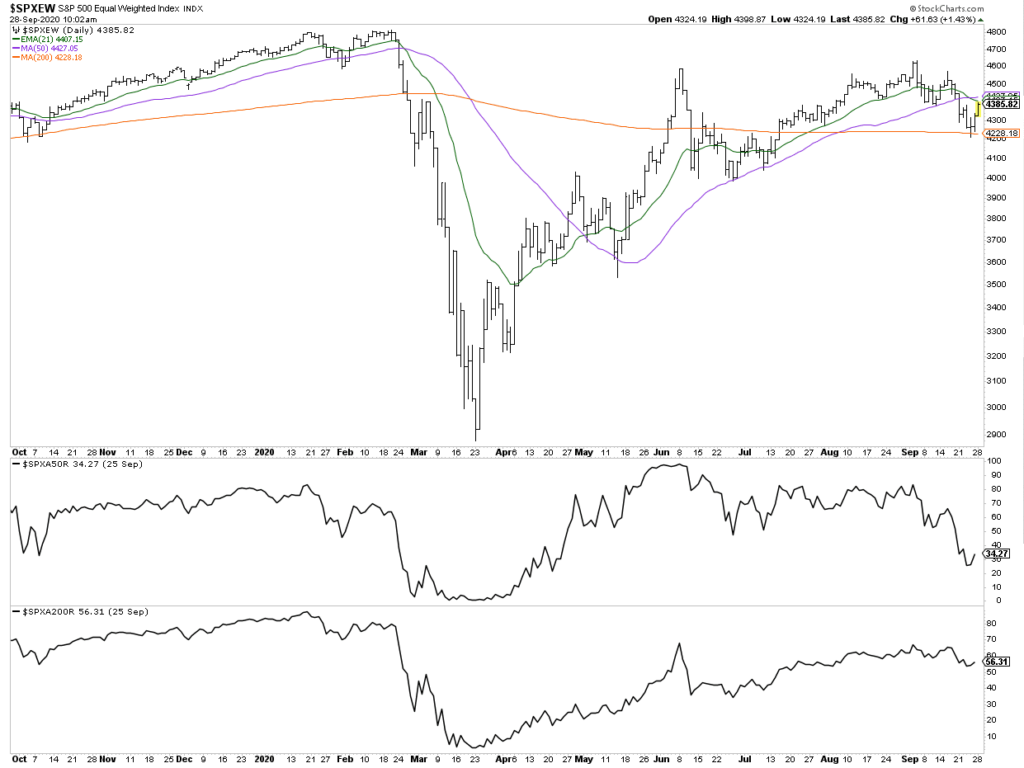
TD Ameritrade notes that waning breadth and momentum has weighed on the S&P500’s technical picture over the past few weeks, but the tide may be turning, at least in the interim. After last Thursday’s close, only 8.5% of the S&P500 was above its 20-day moving average, a lower level than during the July equity washout.
Markets endured two near 90%+ down volume or Major Distribution Days, which are generally considered contrarian.
Further, ~55% of the S&P 500 trades above its 200-day moving average, hinting longer-term breadth remains less pessimistic.
Finally, the equal-weight S&P500 held its 200-day moving average throughout the prior week, which may bode well for a squeeze higher across U.S. indices as risk-off partially unwinds.
Riverbend Indicators Update:

Each week we post notable changes to the various market indicators we follow.
- As a reading of our Bull-Bear Indicator for U.S. Equities (comparative measurements over a rolling one-year timeframe), we remain in Cyclical Bull territory.
- Counting-up of the number of all our indicators that are ‘Up’ for U.S. Equities, the current tally is that three of four are Positive, representing a multitude of timeframes (two that can be solely days/weeks, or months+ at a time; another, a quarter at a time; and lastly, the {typically} years-long reading, that being the Cyclical Bull or Bear status).
- Our short-term indicator is on the verge of turning positive, which will raise our total sum to 4 positive indicators. We are seeing confirmation in this buy signal in various charts I monitor on a daily basis. (see below observations)
Observations:
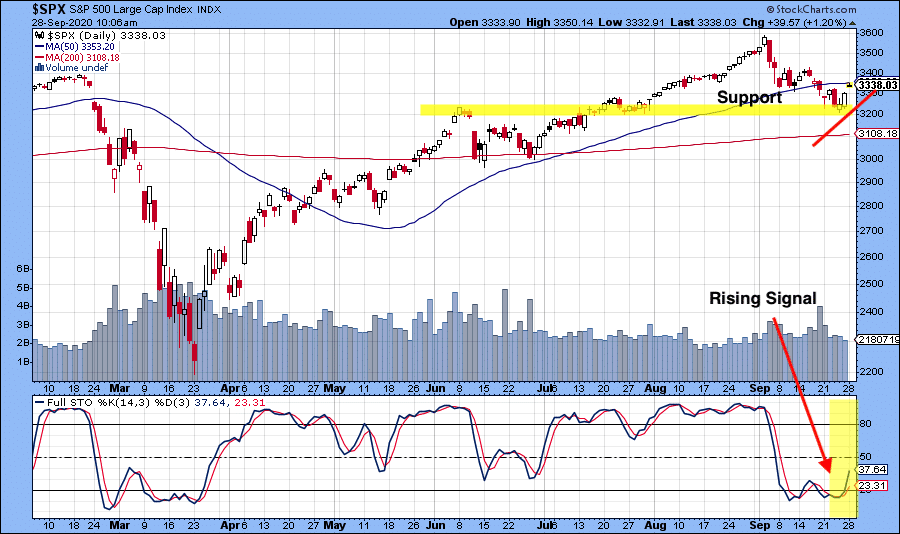
Last week, I mentioned that the US equities market was entering an area of technical support. Since then, the markets have “bounced” up from that level.
Additionally, we are seeing stochastic charts signaling a buy signal:
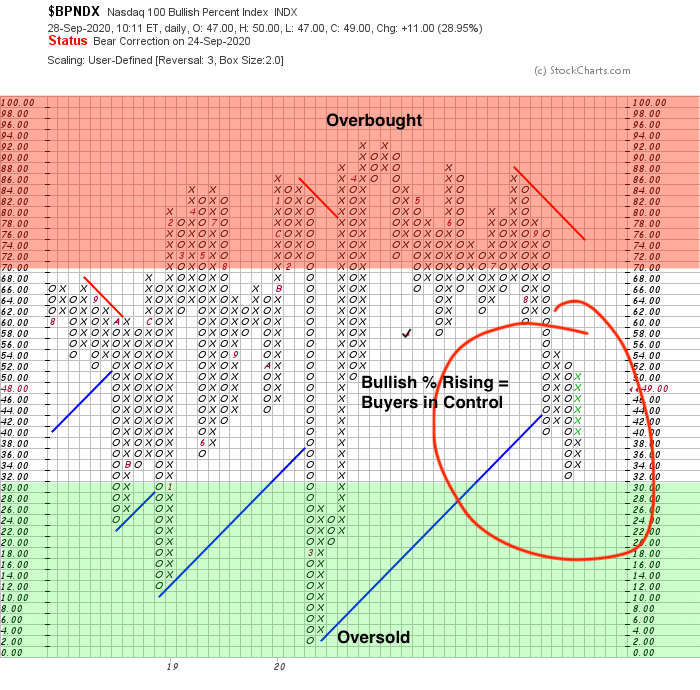
The tech-heavy Nasdaq 100 Bullish % Index has also turned positive and is rising again — an indication that interest in high beta names is back:
The Week Ahead:
Monday:
- ECB President Lagarde Speaks
Tuesday:
- U.S. Goods Trade Balance -81.8 bln exp, -79.3 bln prior
- Prelim Wholesale Inventories m/m N/A exp, -0.1% prior
- China Manufacturing PMI 51.3 exp, 51.0 prior
Wednesday:
- German Retail Sales m/m +0.4% exp, -0.9% prior
- U.S. ADP Non-Farm Employment Change 650k exp, 428k prior
- Chicago PMI 52.0 exp, 51.2 prior
- U.S. Pending Home Sales m/m +3.1% exp, +5.9% prior
Thursday:
- U.S. Core PCE Price Index m/m +0.3% exp, +0.3% prior
- U.S. Unemployment Claims 850k exp, 870k prior
- U.S. ISM Manufacturing PMI 56.0 exp, 56.0 prior
- U.S. ISM Manufacturing Prices 59.0 exp, 59.5 prior
Friday:
- U.S. Non-Farm Employment Change 900k exp, 1371k prior
- U.S. Unemployment Rate 8.2% exp, 8.4% prior
(Sources: All index- and returns-data from Yahoo Finance; news from Reuters, Barron’s, Wall St. Journal, Bloomberg.com, ft.com, guggenheimpartners.com, zerohedge.com, ritholtz.com, markit.com, financialpost.com, Eurostat, Statistics Canada, Yahoo! Finance, stocksandnews.com, marketwatch.com, wantchinatimes.com, BBC, 361capital.com, pensionpartners.com, cnbc.com, FactSet.)
[/fusion_text][/fusion_builder_column][/fusion_builder_row][/fusion_builder_container]


