[fusion_builder_container hundred_percent=”no” equal_height_columns=”no” menu_anchor=”” hide_on_mobile=”small-visibility,medium-visibility,large-visibility” class=”” id=”” background_color=”” background_image=”” background_position=”center center” background_repeat=”no-repeat” fade=”no” background_parallax=”none” parallax_speed=”0.3″ video_mp4=”” video_webm=”” video_ogv=”” video_url=”” video_aspect_ratio=”16:9″ video_loop=”yes” video_mute=”yes” overlay_color=”” video_preview_image=”” border_size=”” border_color=”” border_style=”solid” padding_top=”” padding_bottom=”” padding_left=”” padding_right=””][fusion_builder_row][fusion_builder_column type=”1_1″ layout=”1_1″ background_position=”left top” background_color=”” border_size=”” border_color=”” border_style=”solid” border_position=”all” spacing=”yes” background_image=”” background_repeat=”no-repeat” padding_top=”” padding_right=”” padding_bottom=”” padding_left=”” margin_top=”0px” margin_bottom=”0px” class=”” id=”” animation_type=”” animation_speed=”0.3″ animation_direction=”left” hide_on_mobile=”small-visibility,medium-visibility,large-visibility” center_content=”no” last=”no” min_height=”” hover_type=”none” link=””][fusion_text]
U.S. Markets:
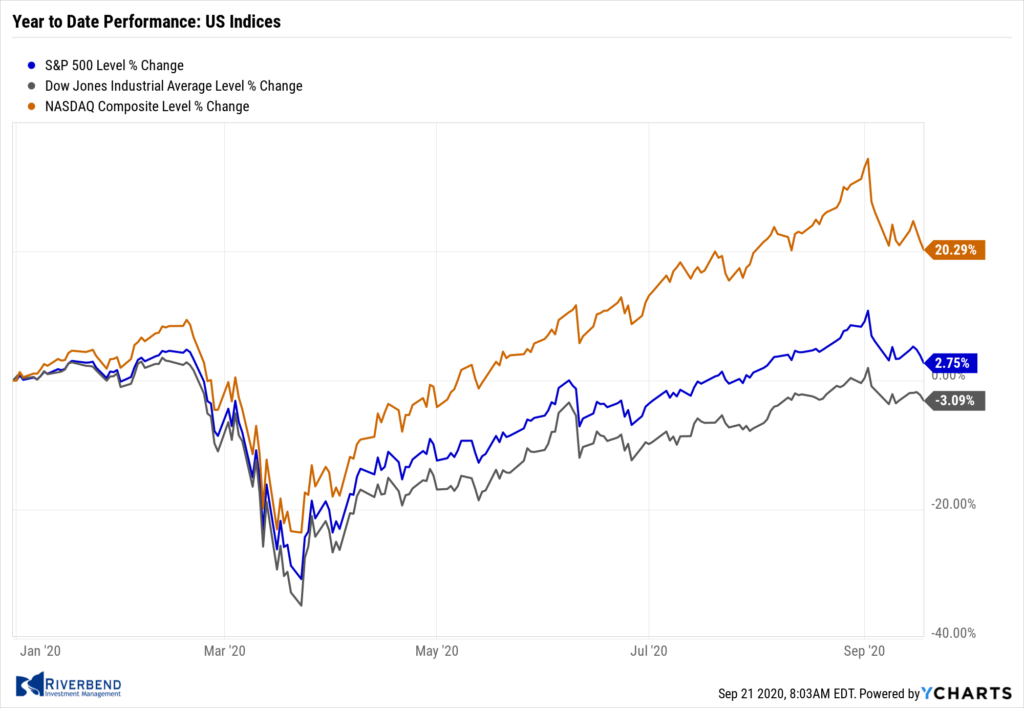
U.S. equities finished the week mixed with merger news and renewed COVID-19 vaccine optimism offsetting worries that the Federal Reserve’s monetary policy was becoming less effective in supporting the recovery.
The Dow Jones Industrial Average ended the week down just 8 points to 27,657. The technology-heavy NASDAQ Composite fell a steeper -0.6% to 10,793.
By market cap, the large cap S&P 500 declined -0.6%, while the mid cap S&P 400 and small cap Russell 2000 gained 0.6% and 2.6%, respectively.
International Markets: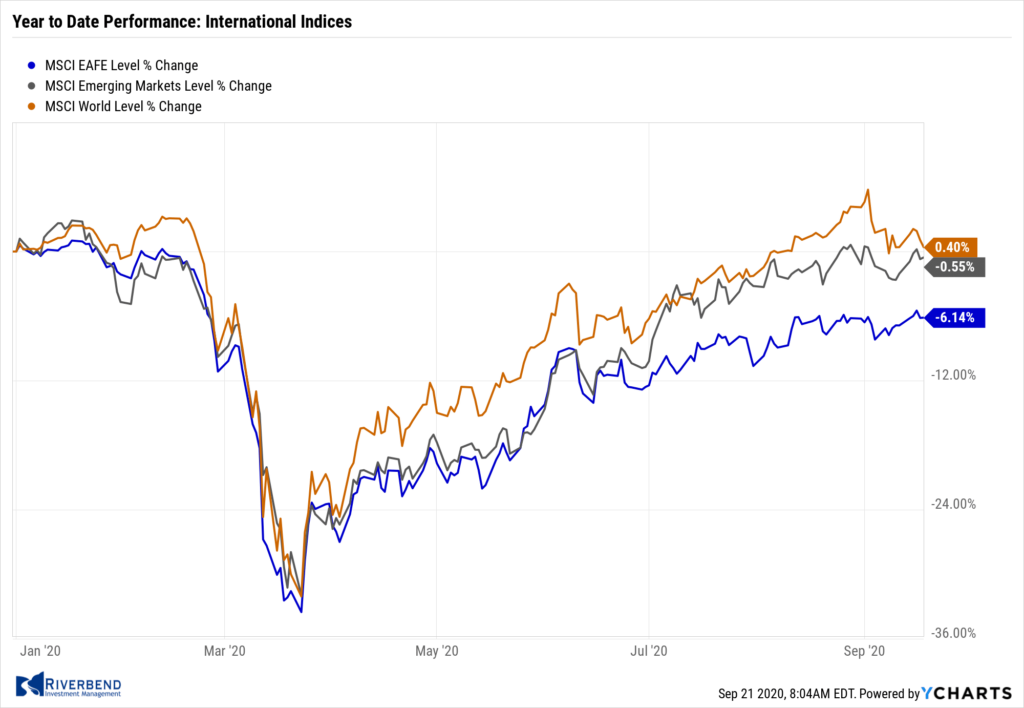
Most major international markets were also mixed. Canada’s TSX declined -0.1% along with the UK’s FTSE 100 which gave up -0.4%. France’s CAC 40 and Germany’s DAX finished down -1.1% and ‑0.7%, respectively.
Japan’s Nikkei ticked down -0.2%, while China rose 2.4%.
As grouped by Morgan Stanley Capital International, developed markets rose 0.5% while emerging markets added 1.3%.
Commodities: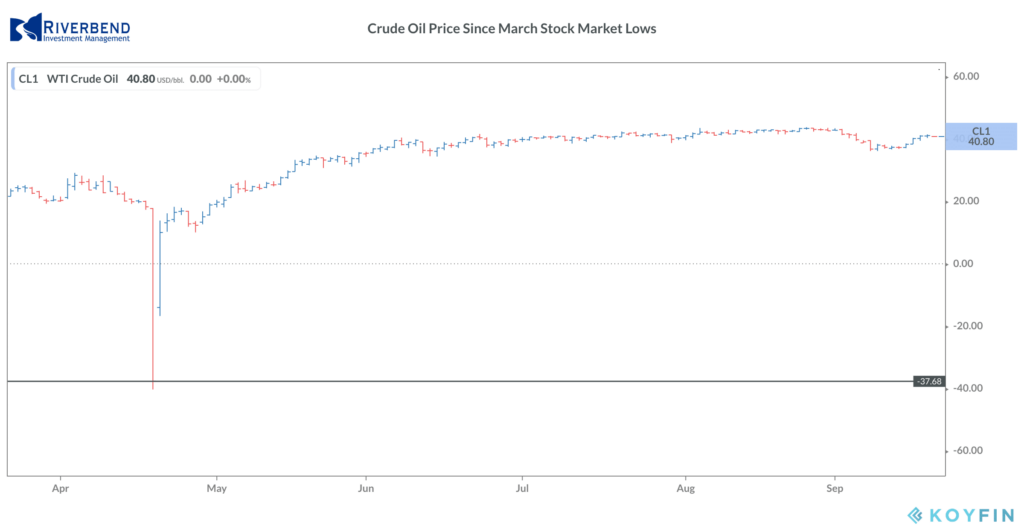
Major commodities finished the week to the upside. Oil was the clear winner with West Texas Intermediate crude surging 10.7% and finishing the week at $41.32 per barrel.
Precious metals also rose with Gold rising 0.7% to $1962.10 an ounce and Silver gaining 1% to $27.13 per ounce.
The industrial metal copper, viewed by some analysts as an indicator of global economic health due to its wide variety of uses, gained 2.5%.
U.S. Economic News: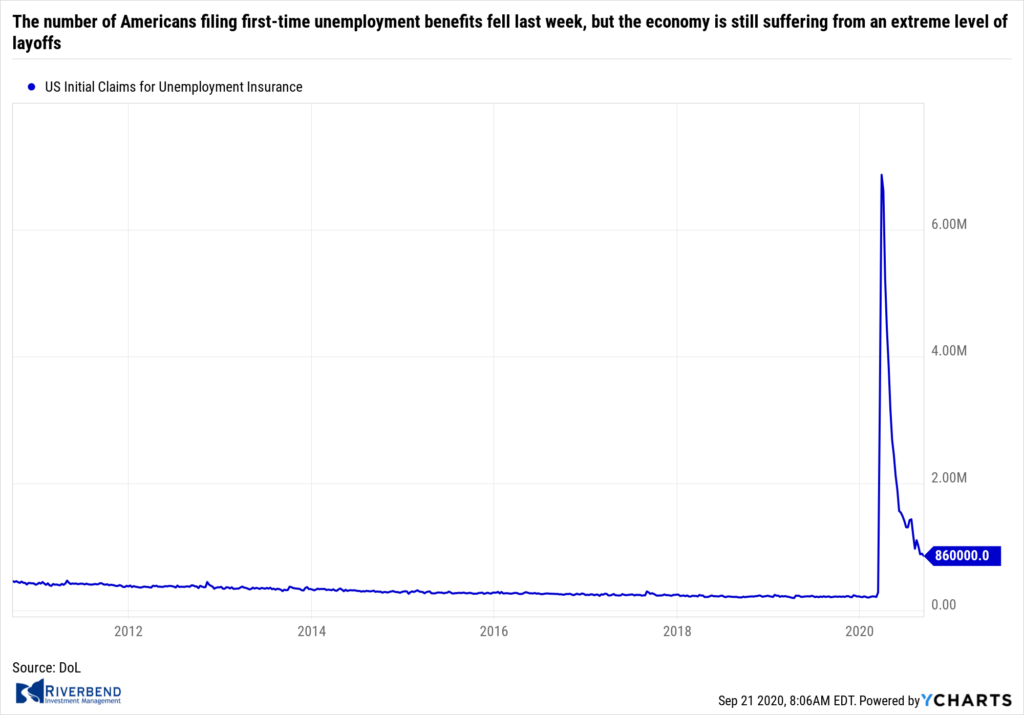
The number of Americans filing first-time unemployment benefits fell last week, but the economy is still suffering from an extreme level of layoffs. The Labor Department reported initial jobless claims fell to 860,000. Economists had expected 870,000 new claims. The decline was the first in five weeks.
As a reference, initial claims had been averaging around 200,000 in the weeks leading up to the coronavirus outbreak. Continuing jobless claims, which counts the number of people already receiving benefits, fell by 916,000 to a seasonally-adjusted 12.63 million. That’s the lowest level since April 4th when most of the U.S. economy was shut down.
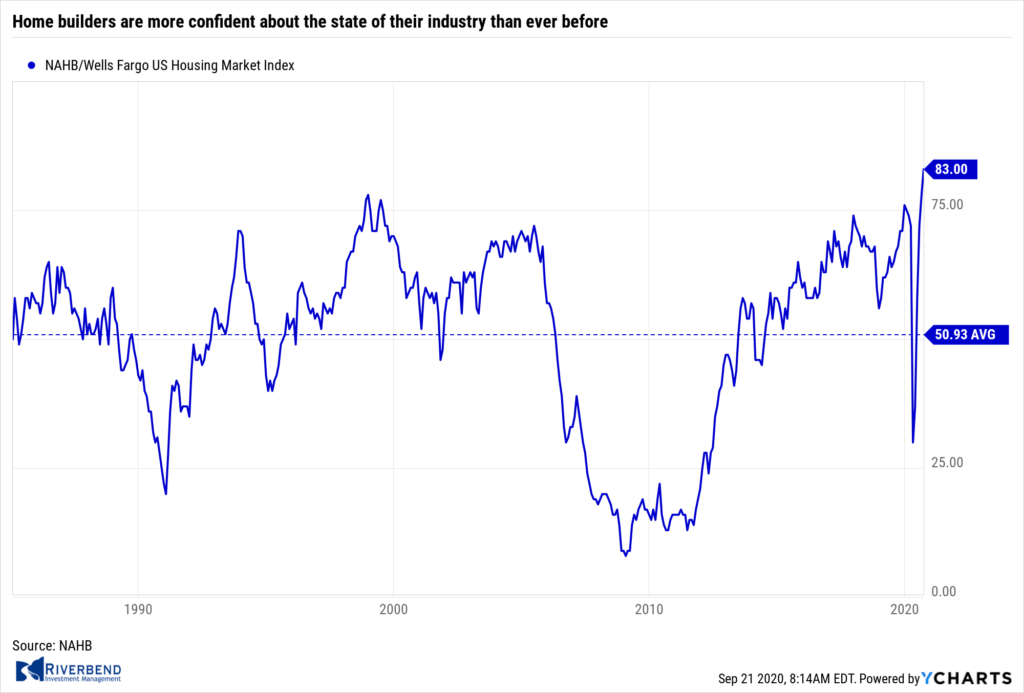 Home builders are more confident about the state of their industry than ever before, according to research from a builder trade group. The National Association of Home Builders (NAHB) reported its monthly confidence index rose 5 points to 83 this month. The reading was the highest on record in the 35-year history of the data.
Robert Dietz, chief economist for the NAHB stated, “The suburban shift for home building is keeping builders busy, supported on the demand side by low interest rates.” Regionally, the Midwest index signaled the biggest increase, rising nine points to 78, followed by the South’s six-point increase to 85. The regional index for the West dropped one point to 87.
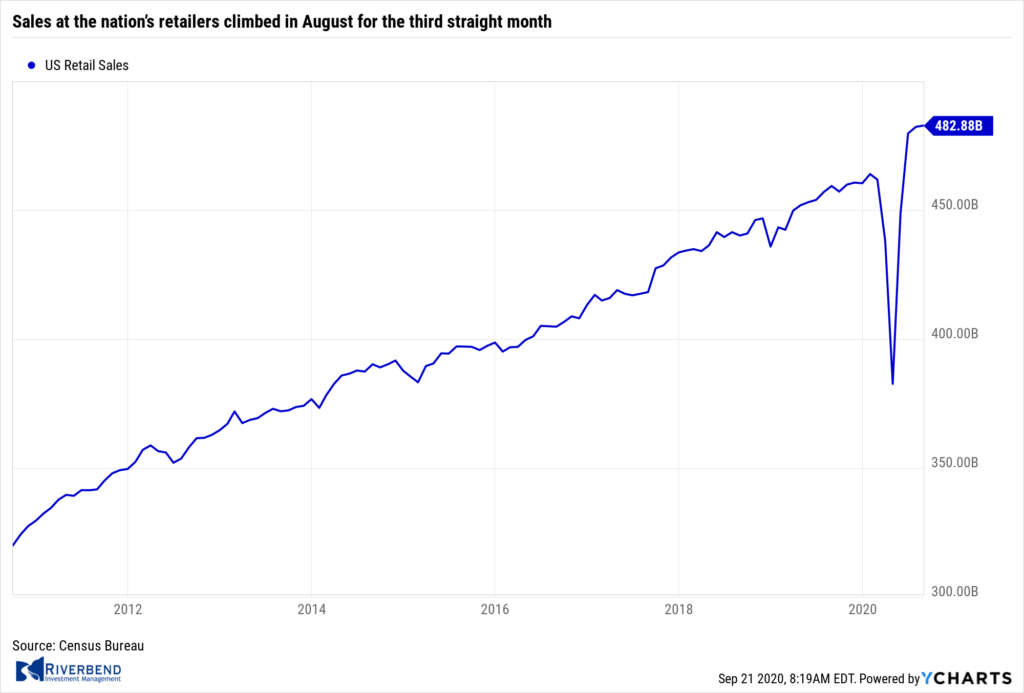 Sales at the nation’s retailers climbed in August for the third straight month, the Commerce Department reported. Despite the end of federal aid, U.S. retail sales rose 0.6% last month. Economists were expecting a 0.7% rise. Analysts note the pace of sales has slowed from earlier in the summer, when the economy reopened and many retailers experienced a sharp rebound in customer traffic. Sales gains are likely to be harder to come by in the months ahead, especially after the end of generous federal aid for the unemployed and businesses. Overall retail sales are about 2% higher now compared to pre-pandemic levels in February.
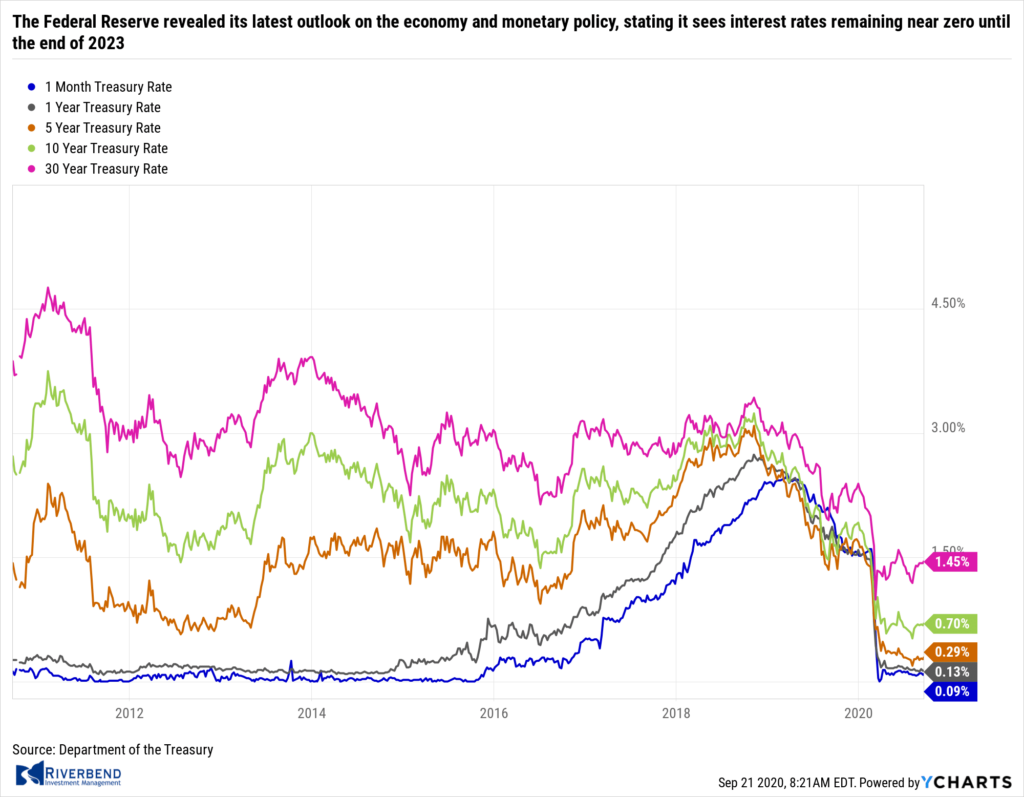 The Federal Reserve revealed its latest outlook on the economy and monetary policy, stating it sees interest rates remaining near zero until the end of 2023. It also reiterated that it intends to keep rates at zero until inflation is on track to exceed 2% for some time and will continue its purchases of Treasuries and mortgage-backed securities. While analysts like Seth Carpenter, economist at UBS, said the Fed guidance was “vague”, Fed Chair Jerome Powell defended the guidance as “powerful” and “durable”.
There were two dissents to the Fed forward guidance. Dallas Fed President Rob Kaplan seemed to favor the prior guidance and wanted the Fed to retain greater flexibility once the economy was on track to meet its two goals. Minneapolis Fed President Neel Kashkari proposed a much more streamlined guidance that the Fed would maintain rates close to zero until core inflation has reached 2% on a sustained basis.
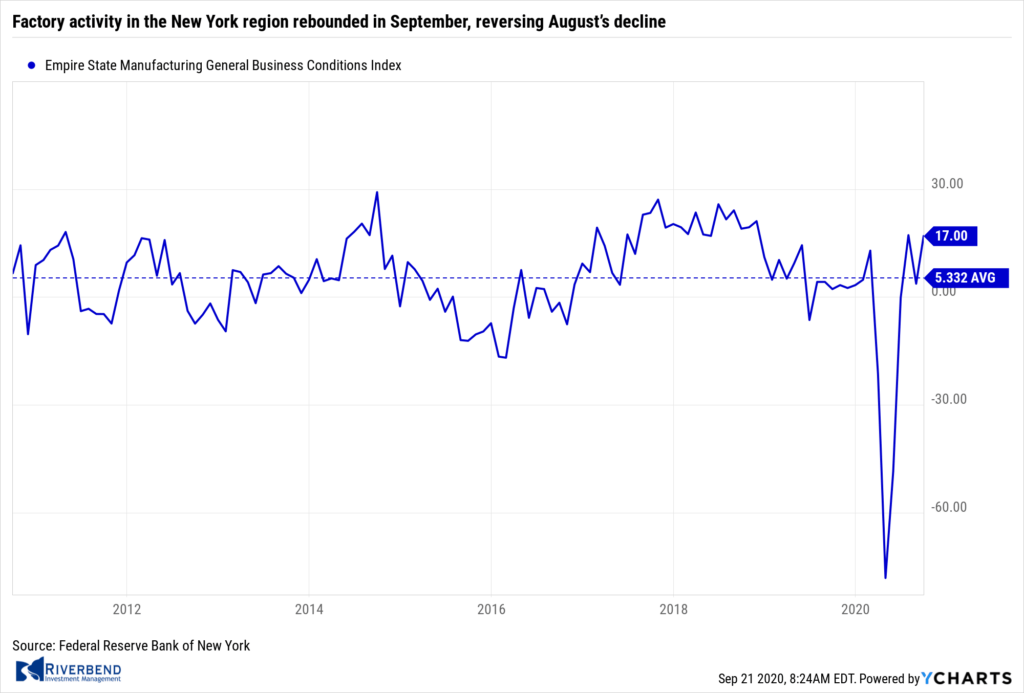 Factory activity in the New York region rebounded in September, reversing August’s decline. The New York Federal Reserve reported its Empire State business conditions index rose 13.3 to points to 17. Economists had expected a reading of only 6. This is the third consecutive positive reading in the index. In the details, the new orders index climbed 8.8 points to 7.1, while shipments rose 14.1. Optimism about the six-month outlook rose 6 points to 40.3. The New York index is the first look at manufacturing conditions in September.
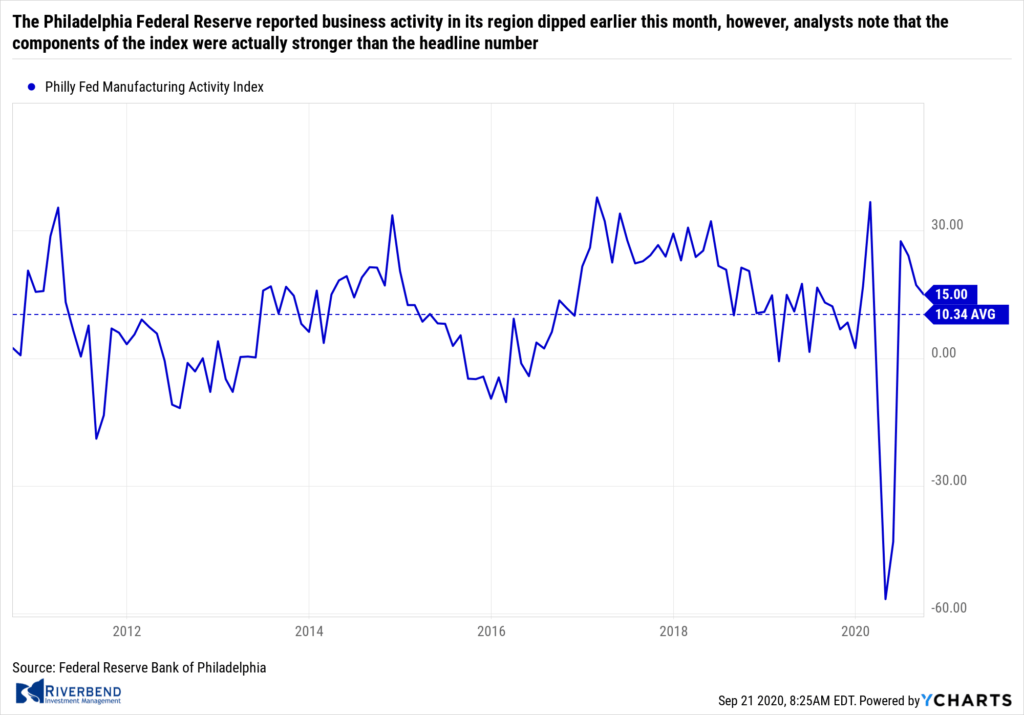 The Philadelphia Federal Reserve reported business activity in its region dipped earlier this month. The regional Fed bank’s index fell to 15 from 17.2 in August. This is the index’s fourth consecutive positive reading. Economists had expected a reading of 13. However, analysts note that the components of the index were actually stronger than the headline number. The barometer on new orders rose to 25.5 in September from 19. The shipments index surged to 36.6 in September from 9.4 and the measure of the business outlook for the next six months rose 18 points to 56.6.
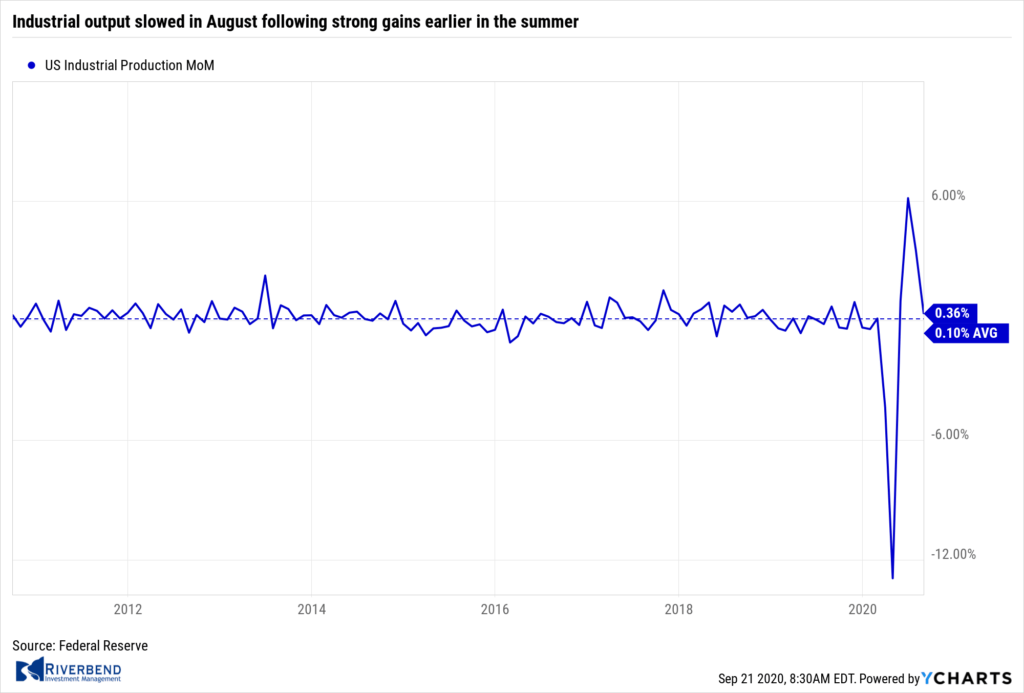 Industrial output slowed in August following strong gains earlier in the summer. The Federal Reserve reported U.S. industrial production rose 0.4% last month. The increase followed a 3.5% gain in July and a 6.1% gain in June. Wall Street had expected a 0.5% gain. The index is still 7.3% below its pre-pandemic level in February. Capacity utilization, which measures the percentage of full manufacturing limits of the nation’s factories, mines and utilities, rose to 71.4% in August. Given that the initial rebound following widespread shutdowns appears to be waning some analysts believe growth will be slower through the rest of 2020 and into 2021. Gus Faucher, chief economist of The PNC Financial Group stated, “There were big increases in output in the spring and early summer as factories reopened, but with demand throughout the U.S. and global economies still down substantially from early 2020, it will be more difficult to eke out near-term gains.”
Chart of the Week: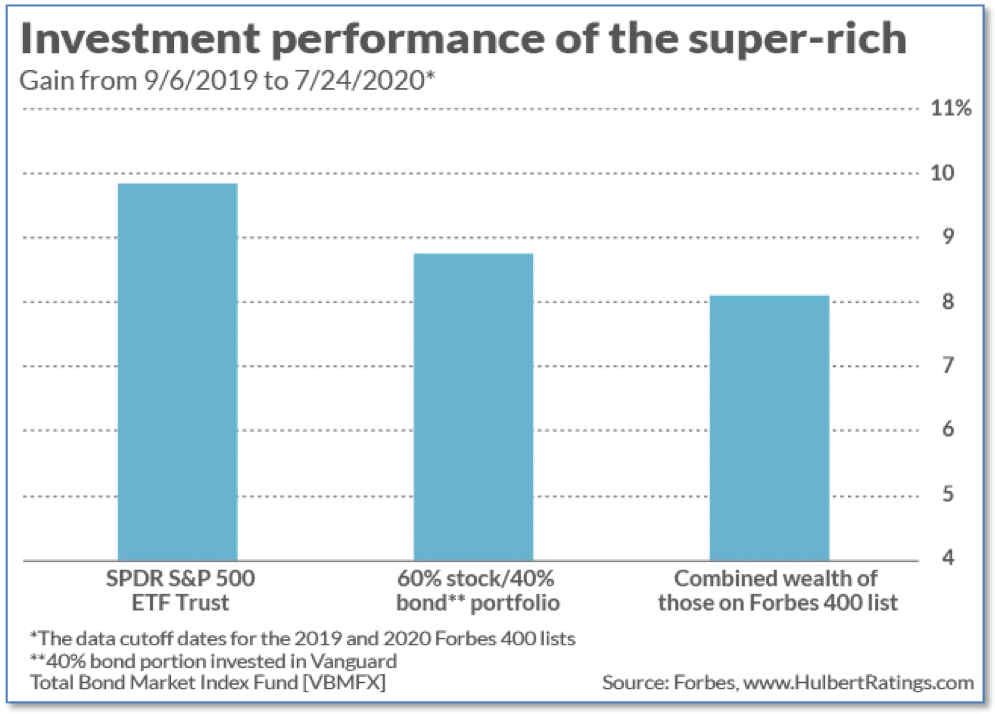
When thinking of the Forbes 400 list of wealthiest Americans, many would assume that most of the 400 are titans of Wall Street who make money hand over fist through astute investing. But research shows that’s not the case.
Mark Hulbert (marketwatch.com) analyzed the investment performance of the super-rich and found that not only did they not beat the benchmark S&P 500, they failed to match the common diversified 60/40 stock and bond portfolio as well. The truth is, almost all the 400 made their money elsewhere and then treat their rather low-risk investing as a way to conserve and keep, rather than grow, their fortunes.
Riverbend Indicators Update:

Each week we post notable changes to the various market indicators we follow.
- As a reading of our Bull-Bear Indicator for U.S. Equities (comparative measurements over a rolling one-year timeframe), we remain in Cyclical Bull territory.
- Counting-up of the number of all our indicators that are ‘Up’ for U.S. Equities, the current tally is that three of four are Positive, representing a multitude of timeframes (two that can be solely days/weeks, or months+ at a time; another, a quarter at a time; and lastly, the {typically} years-long reading, that being the Cyclical Bull or Bear status).
Observations:
The market looks to be in a consolidation phase, similar to what we saw in June:
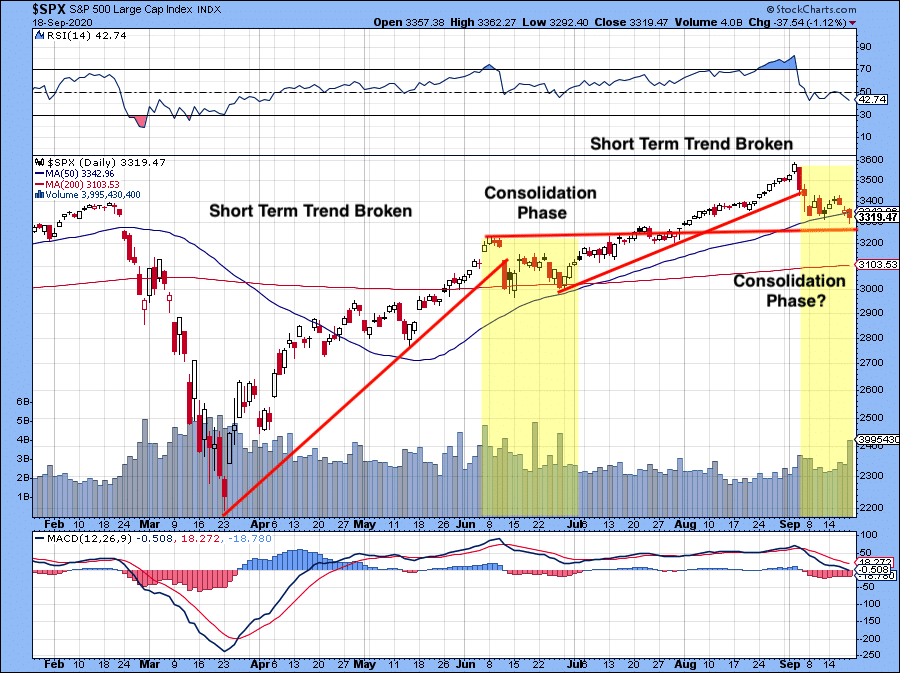
While our short term indicator remains on a “sell” signal, our longer-term indicators are still flashing “buy” signals. As of now, the current pullback in the market looks like a typical profit-taking/consolidation phase.
This week’s market action will give us a better insight into whether buyers are returning to the market – or want to sit on the sidelines until after the election.
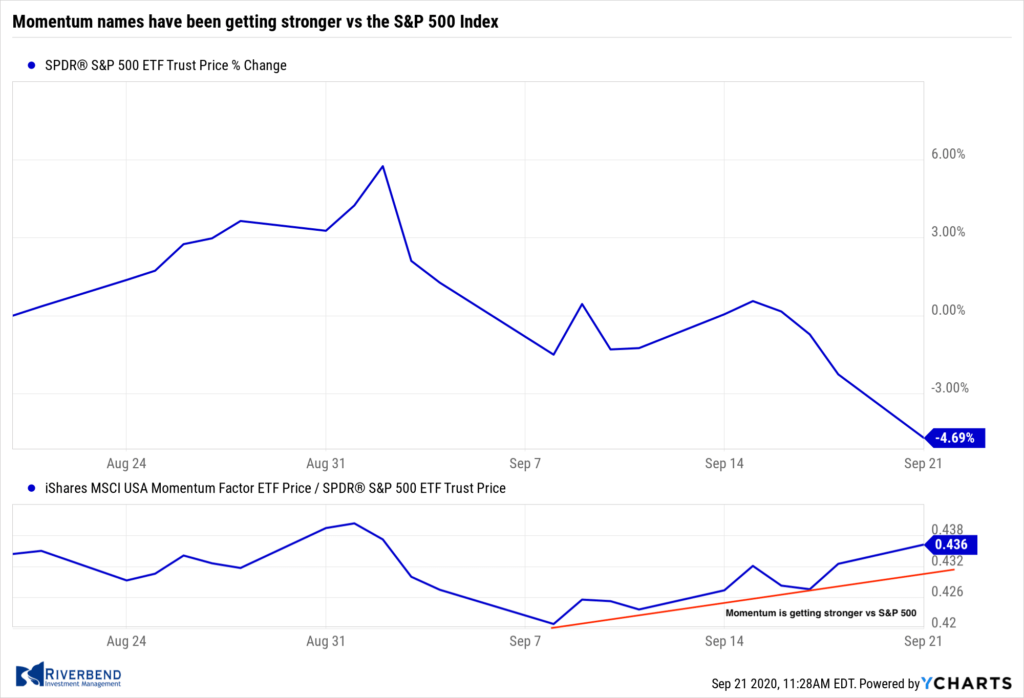
One additional area to pay attention to is the relationship of momentum names vs the S&P 500 index. Typically, momentum names will underperform the overall market during times of major market distress. However, we have been seeing just the opposite. Momentum names have been getting stronger during this recent decline — an indication that investors are “buying the dips” in leadership names.
The Week Ahead:
Monday:
- FOMC Board Virtual Meeting on CRA
Tuesday:
- Fed Chair Powell Testimony
- U.S. Existing Home Sales 6.05 mln exp, 5.86 mln prior
- Richmond Fed Manufacturing Index 12 exp, 18 prior
Wednesday:
- French Flash Services PMI 50.6 exp, 49.8 prior
- German Flash Manufacturing PMI 52.0 exp, 52.2 prior
- Eurozone Flash Manufacturing PMI 51.5 exp, 51.7 prior
- U.S. Flash Manufacturing PMI 52.5 exp, 53.1 prior
- U.S. Flash Services PMI 54.5 exp, 55.0 prior
Thursday: German ifo Business Climate 93.9 exp, 92.6 prior
- U.S. Unemployment Claims 860k prior
- U.S. New Home Sales 890k exp, 901k prior
- U.S. Treasury Secretary Mnuchin Testimony
Friday:
- U.S. Core Durable Goods Orders m/m +1.0% exp, +2.6% prior
(Sources: All index- and returns-data from Yahoo Finance; news from Reuters, Barron’s, Wall St. Journal, Bloomberg.com, ft.com, guggenheimpartners.com, zerohedge.com, ritholtz.com, markit.com, financialpost.com, Eurostat, Statistics Canada, Yahoo! Finance, stocksandnews.com, marketwatch.com, wantchinatimes.com, BBC, 361capital.com, pensionpartners.com, cnbc.com, FactSet.)
[/fusion_text][/fusion_builder_column][/fusion_builder_row][/fusion_builder_container]


