[fusion_builder_container hundred_percent=”no” equal_height_columns=”no” menu_anchor=”” hide_on_mobile=”small-visibility,medium-visibility,large-visibility” class=”” id=”” background_color=”” background_image=”” background_position=”center center” background_repeat=”no-repeat” fade=”no” background_parallax=”none” parallax_speed=”0.3″ video_mp4=”” video_webm=”” video_ogv=”” video_url=”” video_aspect_ratio=”16:9″ video_loop=”yes” video_mute=”yes” overlay_color=”” video_preview_image=”” border_size=”” border_color=”” border_style=”solid” padding_top=”” padding_bottom=”” padding_left=”” padding_right=””][fusion_builder_row][fusion_builder_column type=”1_1″ layout=”1_1″ background_position=”left top” background_color=”” border_size=”” border_color=”” border_style=”solid” border_position=”all” spacing=”yes” background_image=”” background_repeat=”no-repeat” padding_top=”” padding_right=”” padding_bottom=”” padding_left=”” margin_top=”0px” margin_bottom=”0px” class=”” id=”” animation_type=”” animation_speed=”0.3″ animation_direction=”left” hide_on_mobile=”small-visibility,medium-visibility,large-visibility” center_content=”no” last=”no” min_height=”” hover_type=”none” link=””][fusion_text]
U.S. Markets: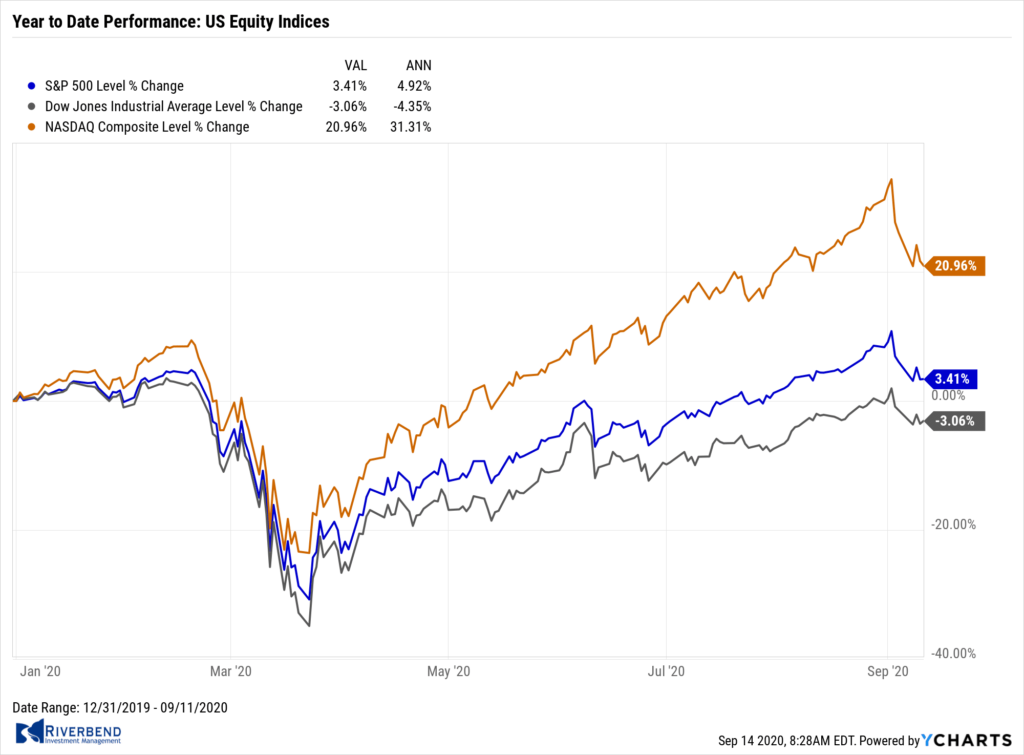
U.S. stocks pulled back further from recent highs in a shortened but highly volatile trading week. The technology-heavy NASDAQ Composite index fared the worst, declining -4.1% and ending the week in correction territory—down 10% or more from the all-time high it reached on September 2nd. The Dow Jones Industrial Average shed 467 points finishing the week at 27,665, a decline of -1.7%.
By market cap, the large cap S&P 500 retreated -2.5%, while the mid cap S&P 400 index and small cap Russell 2000 indexes declined -2.3% and -2.5%, respectively.
International Markets: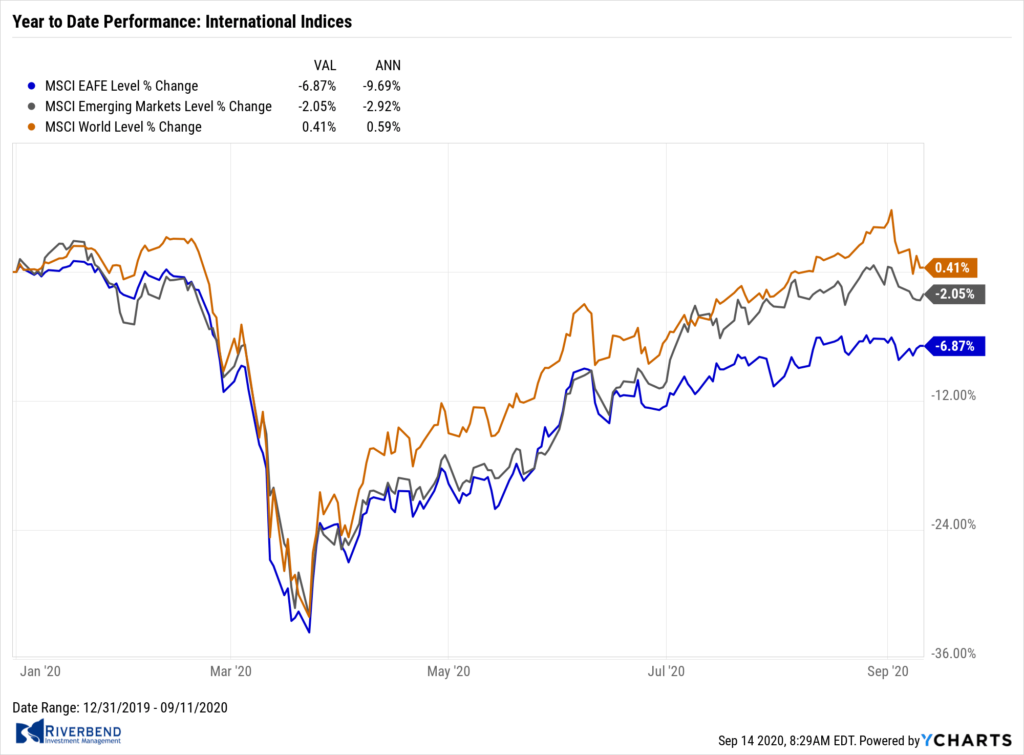
Canada’s TSX ticked up 0.03%, while the United Kingdom’s FTSE 100 rallied 4.0%. On Europe’s mainland, France’s CAC 40 rose 1.4%, Germany’s DAX added 2.8%, and Italy’s Milan FTSE tacked on 2.2%.
In Asia, China’s Shanghai Composite retreated -2.8%. Japan’s Nikkei finished the week up 0.9%.
As grouped by Morgan Stanley Capital International, developed markets rose 0.4% while emerging markets declined -0.9%.
Commodities: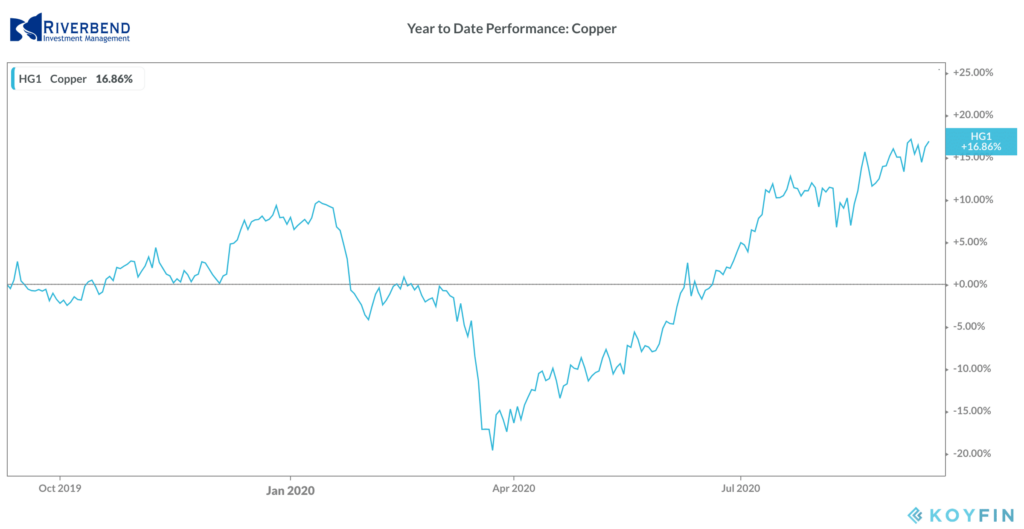
Precious metals rose in response to the weakness in the equities markets. Gold added $13.60 to finish the week at $1947.90 per ounce, a gain of 0.7%. Silver added 0.5% and finished at $26.86 per ounce.
Oil sold off for a second consecutive week. West Texas Intermediate crude oil declined -6.1% to $37.33 per barrel.
The industrial metal copper, viewed by some analysts as a barometer of world economic health, finished the week down -0.7%.
U.S. Economic News: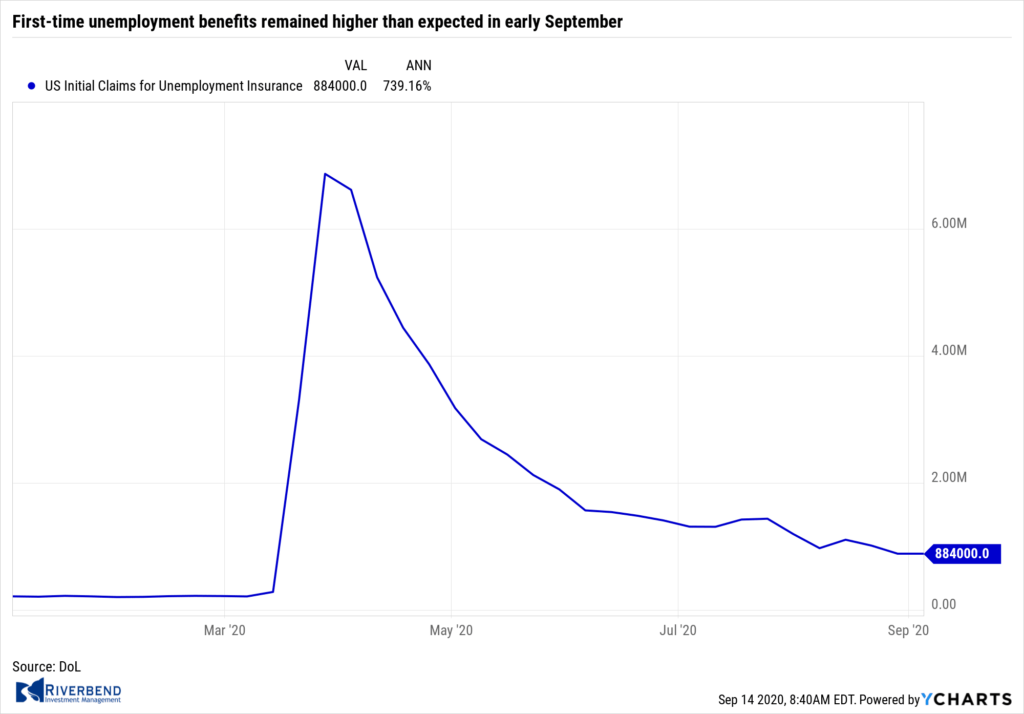
The number of Americans filing first-time unemployment benefits remained higher than expected in early September for the fourth consecutive week, signaling that the gradual improvement in the labor market over the summer has stalled. The Labor Department reported initial jobless claims remained unchanged at an upwardly revised 884,000 last week, above the consensus of 850,000. While it was the lowest number of initial claims in nearly six months, it was still higher than in any recession since 1967, highlighting the devastation the pandemic has inflicted on the economy. Continuing claims, which counts the number of Americans already receiving benefits, rose 93,000 to 13.385 million. That was its first increase in five weeks.
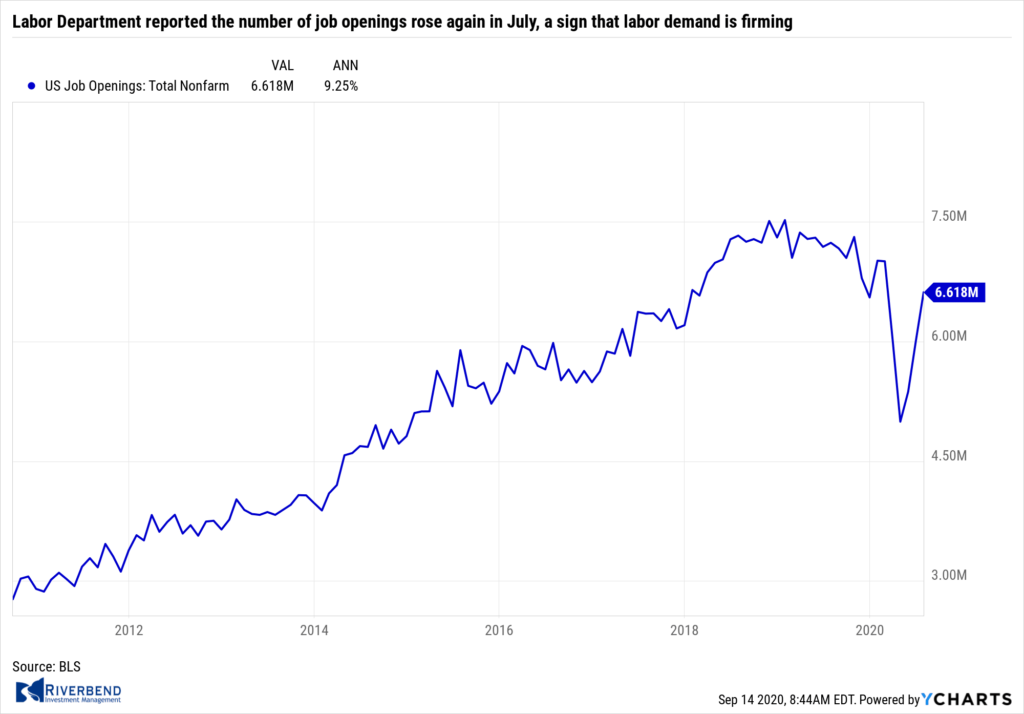 The Labor Department reported the number of job openings rose again in July, a sign that labor demand is firming. The Labor Department reported job openings rose by 617,000 to 6.6 million in July. For comparison, the number of jobs available were running around 7 million a month before the pandemic hit. There were notable gains in retail trade, health care, social assistance, and construction jobs. Hires, however, sank by 17.0% to 5.787 million, led by a significant decline in accommodation and food service jobs as that industry remains under severe pressure from COVID-19. On the positive side, layoffs fell to 1.721 million—its lowest level since March of last year.
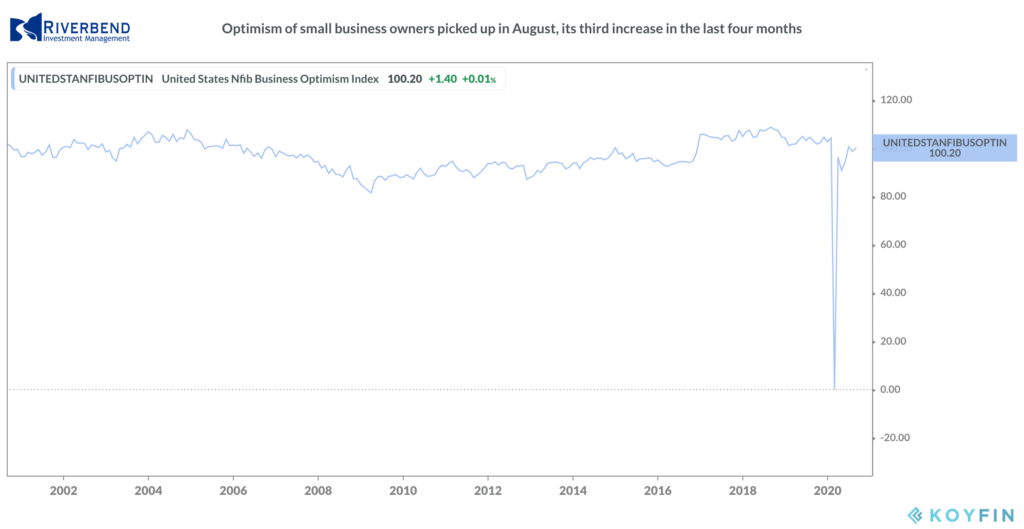 Optimism of small business owners picked up in August, its third increase in the last four months. The National Federation of Independent Business (NFIB) survey rose 1.4 points to 100.2. The reading is a marked improvement from the pandemic low in April, boosted by Paycheck Protection Program loans and other fiscal help. Still, the reading remains 4.3 points below its level in February. Seven of the ten NFIB components improved last month, led by the earnings trend. Current inventory satisfaction was at its highest level since February 1997, while current job openings and hiring plans for the next three months both picked up.
 For the second consecutive month, consumers increased their borrowing for big ticket items like vehicles and college tuition. In the latest report from the Federal Reserve, the use of credit rose in July after slumping from March through May. Outstanding consumer debt rose by $12.3 billion in July from the prior month, marking a 3.6% increase. Credit rose at a revised 3.3% annual clip in June. The use of credit had sunk nearly 20% in April during the worst of the pandemic. Revolving credit, such as credit cards, fell in July at a 0.4% annual rate—its fifth straight decline. Non-revolving credit, typically auto and student loans, climbed by 4.8% and rose for a third month in a row. Non-revolving credit is more stable and less prone to sharp swings like the use of credit cards.
Source BLS
Prices at the wholesale level ticked up a seasonally-adjusted 0.3% in August. The rise follows a 0.6% increase in July. Economists had expected a 0.2% increase. Ex-food and energy, so-called “core PPI” increased 0.4%–also above expectations. The increase in producer prices was led by services, which advanced 0.5%, the same as in the previous month, resulting in the biggest back-to-back jump since data began in 2009. Year-over-year, PPI for final demand was off -0.2%, its fifth consecutive decline, while core PPI edged up 0.6%. Neither measure is indicating any significant inflationary momentum.
At the consumer level, prices firmed slightly rising 0.4% in August, its third consecutive gain. Analysts had expected an increase of 0.3%. Core CPI, which excludes food and energy, also rose 0.4%. The increase was primarily attributed to a surge in the price of used cars and trucks, which jumped 5.4%, their biggest increase since March of 1969. The increase in used vehicle prices was responsible for 40% of the rise in core CPI. There were also notable price gains in recreation, apparel, car insurance, and airline fares. Year-over-year, the CPI increased 1.3%, while core rose 1.7%. Both have firmed over the past four months from near-deflation territory, but continue to show subdued price pressures and remain well-below the Federal Reserve’s inflation target of 2.0%. Both producer and core CPI reports suggest that Fed policy will continue to remain accommodative for the foreseeable future.
Chart of the Week: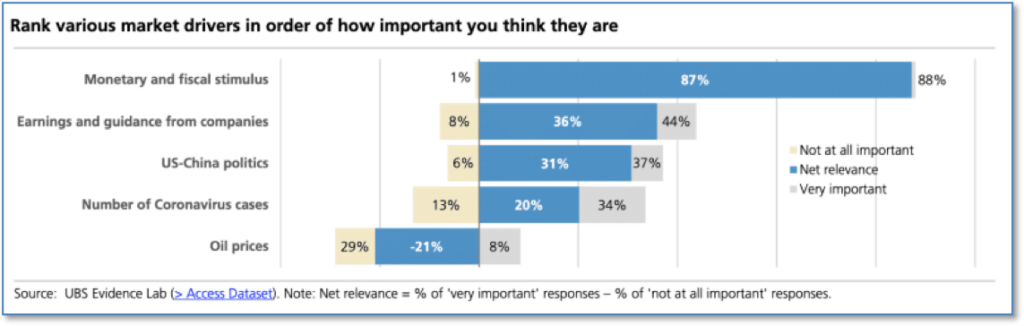
What would have been labeled as a “conspiracy theory” just a few short years ago is now a generally accepted fact, a recent study by UBS shows.
A survey by the firm showed that when it comes to belief in what drives financial markets, respondents overwhelmingly believe that nothing matters more than the Fed.
UBS strategists led by Bhanu Baweja stated that in the present market environment, “There was an overwhelming consensus that monetary and fiscal stimulus was the most important driver for markets.” Nothing else was even close. Coronavirus ranked fourth.
Riverbend Indicators Update:

Each week we post notable changes to the various market indicators we follow.
- As a reading of our Bull-Bear Indicator for U.S. Equities (comparative measurements over a rolling one-year timeframe), we remain in Cyclical Bull territory.
- Counting-up of the number of all our indicators that are ‘Up’ for U.S. Equities, the current tally is that three of four are Positive, representing a multitude of timeframes (two that can be solely days/weeks, or months+ at a time; another, a quarter at a time; and lastly, the {typically} years-long reading, that being the Cyclical Bull or Bear status).
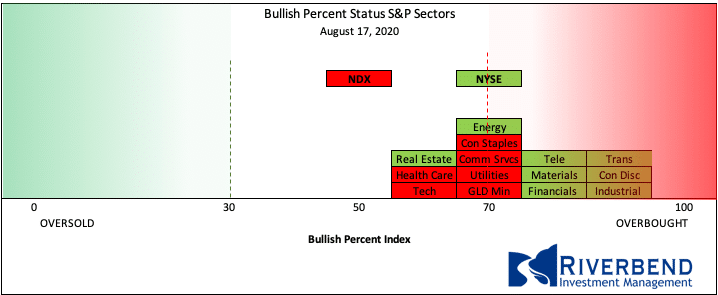
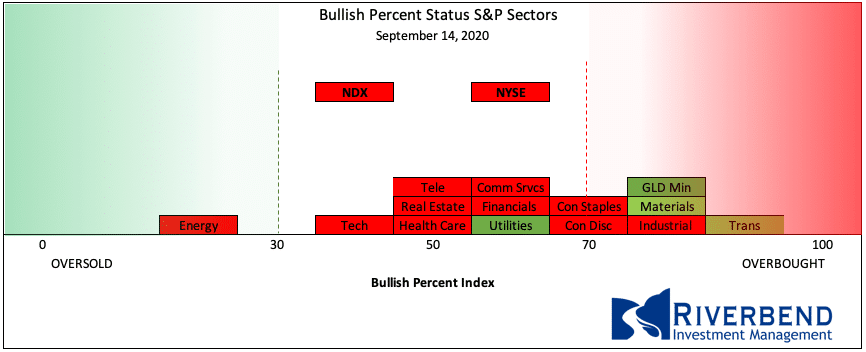
A deeper look into the S&P 500 sectors, shows the impact of the profit-taking in various overbought sectors of the market.
Year to date leaders, like technology, have since returned to levels where we may see investors begin to look for opportunities.
Bullish Percent Sector Bellcurve – Last Month:
Current:
The Week Ahead:
Monday:
- China Industrial Production y/y +5.1% exp, +4.8% prior
- China Retail Sales y/y +0.0% exp, -1.1% prior
Tuesday:
- German ZEW Economic Sentiment 70.0 exp, 71.5 prior
- U.S. Empire State Manufacturing Index 6.2 exp, 3.7 prior
- U.S. Industrial Production m/m +1.2% exp, +3.0% prior
Wednesday:
- U.S. Retail Sales m/m +1.0% exp, +1.9% prior
- U.S. NAHB Housing Market Index 78 exp, 78 prior
- FOMC Statement and Economic Projections
Thursday:
- U.S. Philly Fed Manufacturing Index 15.0 exp, 17.2 prior
- U.S. Unemployment Claims 825k exp, 884k prior
- U.S. Building Permits 1.51 mln exp, 1.50 mln prior
- U.S. Housing Starts 1.47 mln exp, 1.50 mln prior
Friday:
- U.S. Prelim UoM Consumer Sentiment 75.0 exp, 74.1 prior
(Sources: All index- and returns-data from Yahoo Finance; news from Reuters, Barron’s, Wall St. Journal,
Bloomberg.com, ft.com, guggenheimpartners.com, zerohedge.com, ritholtz.com, markit.com, financialpost.com, Eurostat,
Statistics Canada, Yahoo! Finance, stocksandnews.com, marketwatch.com, wantchinatimes.com, BBC, 361capital.com,
pensionpartners.com, cnbc.com, FactSet.)
[/fusion_text][/fusion_builder_column][/fusion_builder_row][/fusion_builder_container]


