U.S. Markets: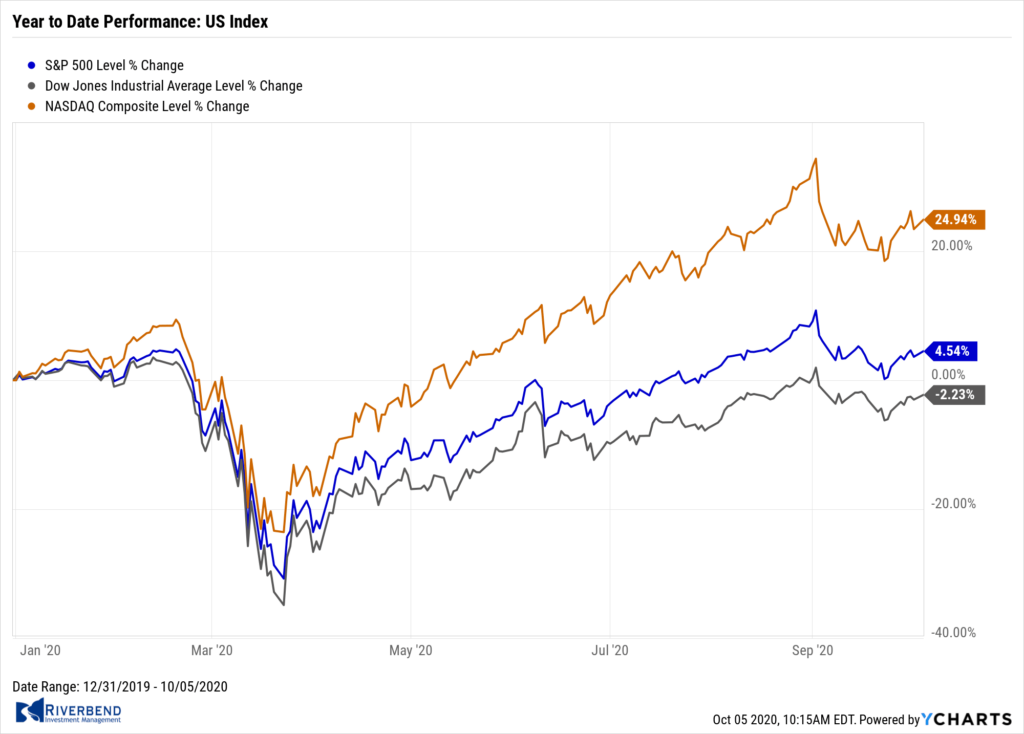
The large cap benchmarks managed to break a string of four consecutive weekly losses and moved higher, although gains were more robust in small and mid-caps. Most sectors within the S&P 500 index recorded modest positive returns, with the exception of energy stocks, which continued their declines.
For the week, the Dow Jones Industrial Average added 509 points to close at 27,683, a gain of 1.9%. The technology-heavy NASDAQ Composite rose for a second week, adding 1.5%.
By market cap, the large cap S&P 500 gained 1.5%, while the mid cap S&P 400 and small cap Russell 2000 surged 4.7% and 4.4%, respectively.
International Markets: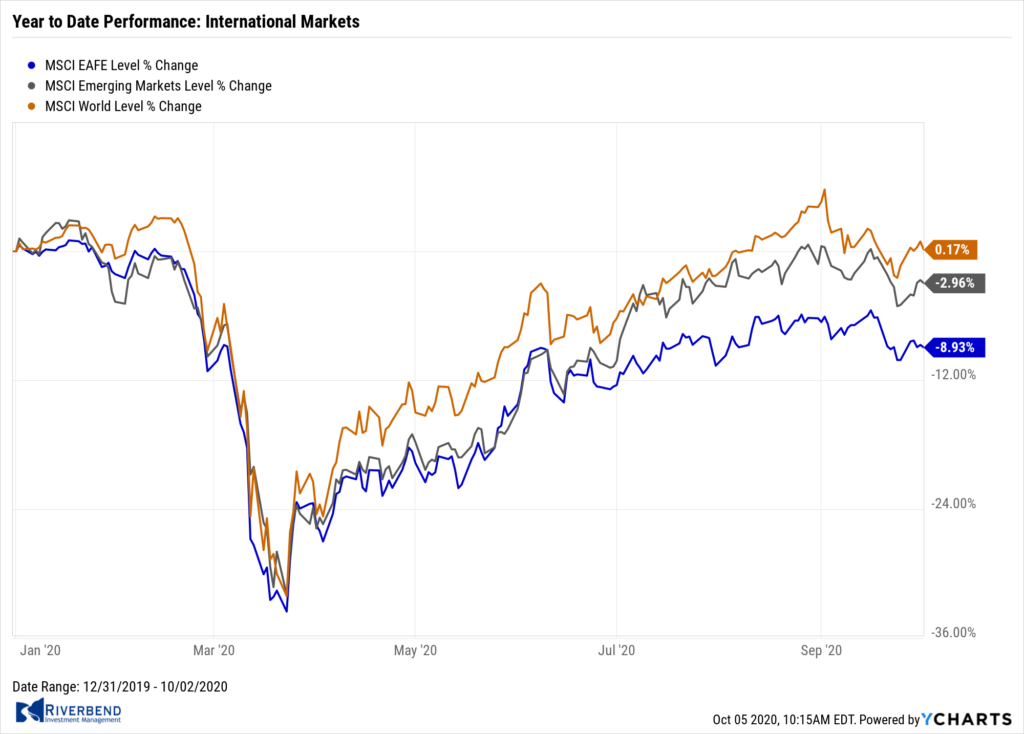
International markets in the West finished the week predominantly to the upside. Canada’s TSX rebounded 0.8%, while the United Kingdom’s FTSE added 1%.
On Europe’s mainland, France’s CAC 40 rose 2% along with Germany’s DAX which gained 1.8%.
In Asia, China’s Shanghai Composite finished the week flat, while Japan’s Nikkei declined -0.8%.
As grouped by Morgan Stanley Capital International, developed markets finished the week up 1.3%, while emerging markets added 2.4%.
Commodities:
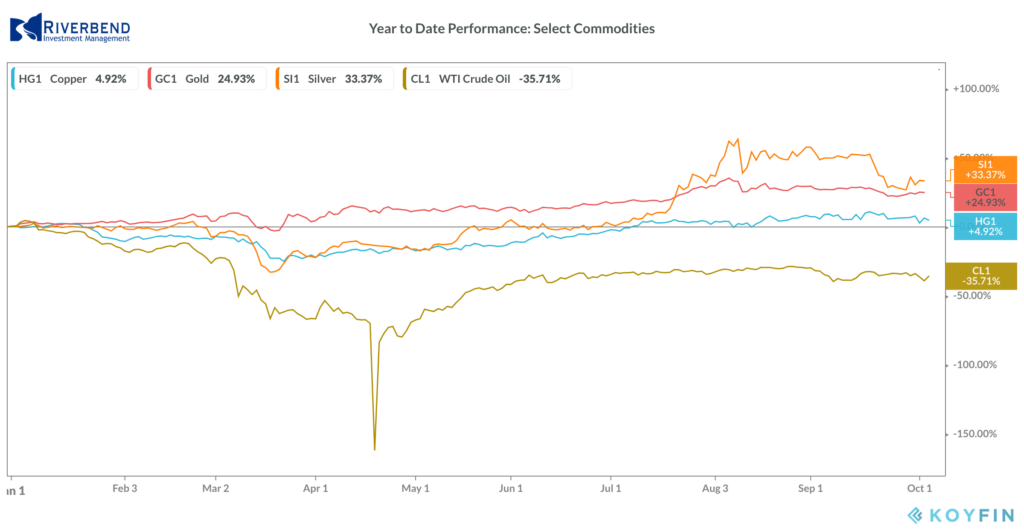
Precious metals retraced most of last week’s decline with Gold rebounding 2.2% to $1907.60 per ounce, and Silver rising 4.1% to $24.03.
Crude oil fell for a second week, plunging -8% to $37.05 per barrel of West Texas Intermediate crude.
The industrial metal copper, viewed by some analysts as a barometer of world economic health due to its wide variety of uses, finished the week up 0.2%.
U.S. Economic News: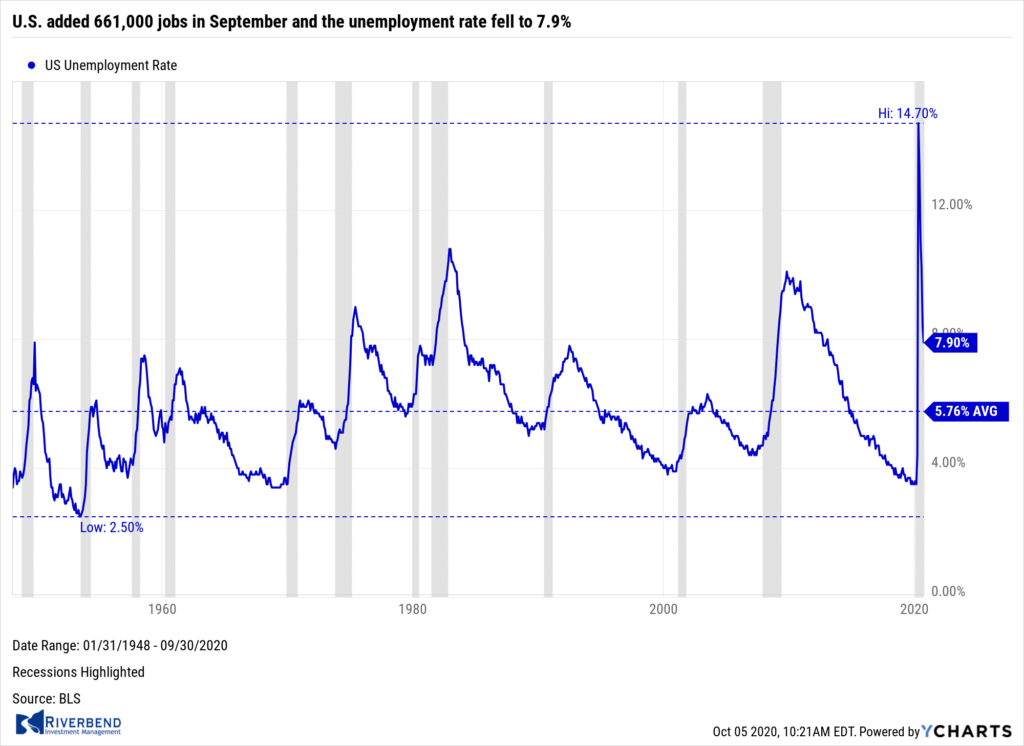
The U.S. added 661,000 jobs in September and the unemployment rate fell to 7.9%, the Bureau of Labor Statistics reported. The increase in employment fell short of the consensus forecast of 800,000 jobs added. Furthermore, the gain in hiring was the smallest since the economy reopened, pointing to a potential deceleration in the recovery.
Private-sector hiring was somewhat stronger with the creation of 877,000 new jobs. A decline in public-education jobs at local schools and state colleges appeared to be the main reason for the shortfall.
The unemployment rate, meanwhile, fell for the fifth month in a row to 7.9% from 8.4%, a new pandemic low. The official jobless rate had peaked at 14.7% in April before subsiding.
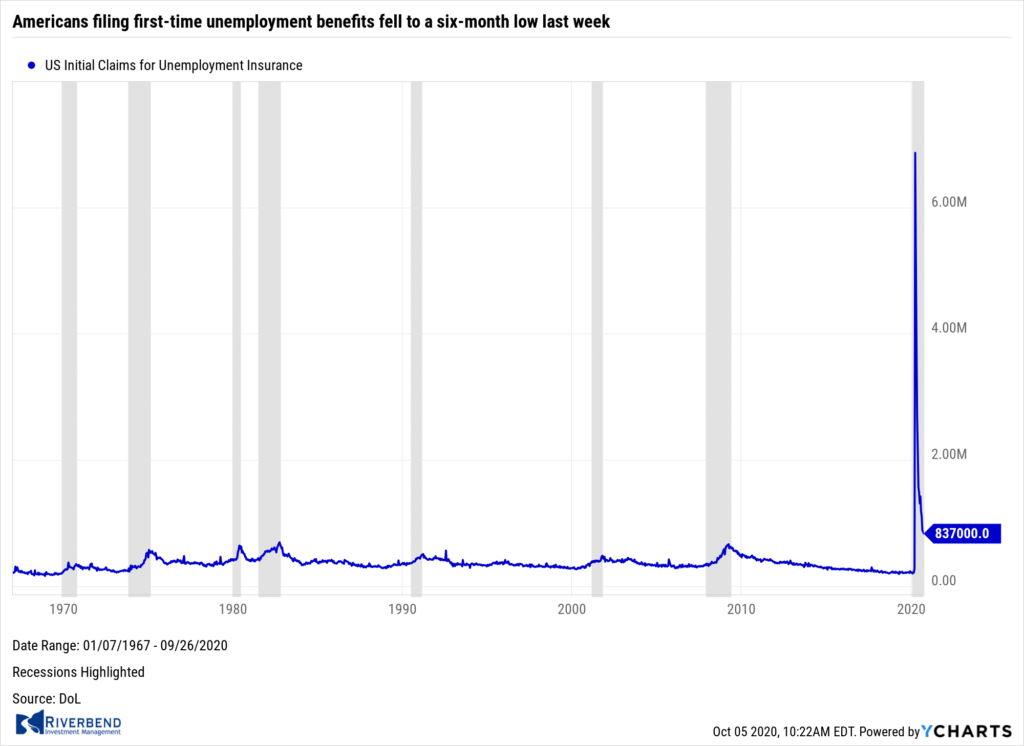
The number of Americans filing first-time unemployment benefits fell to a six-month low last week, hitting their lowest level since the outbreak of the coronavirus pandemic. The Labor Department reported initial jobless claims dropped to 837,000 in the week ended September 26. Economists had expected new claims to fall to 840,000.
However, the report had one big caveat—California. The state is not accepting new applications until early October while it processes a large backlog and investigates reports of widespread fraud. As a result, the U.S. Labor Department is using the most recent California numbers before the pause as part of its national total.
Continuing claims, which counts the number of people already receiving benefits, declined by 980,000 to a seasonally-adjusted 11.8 million. That’s also the lowest level since late March, when most of the U.S. economy was shut down.
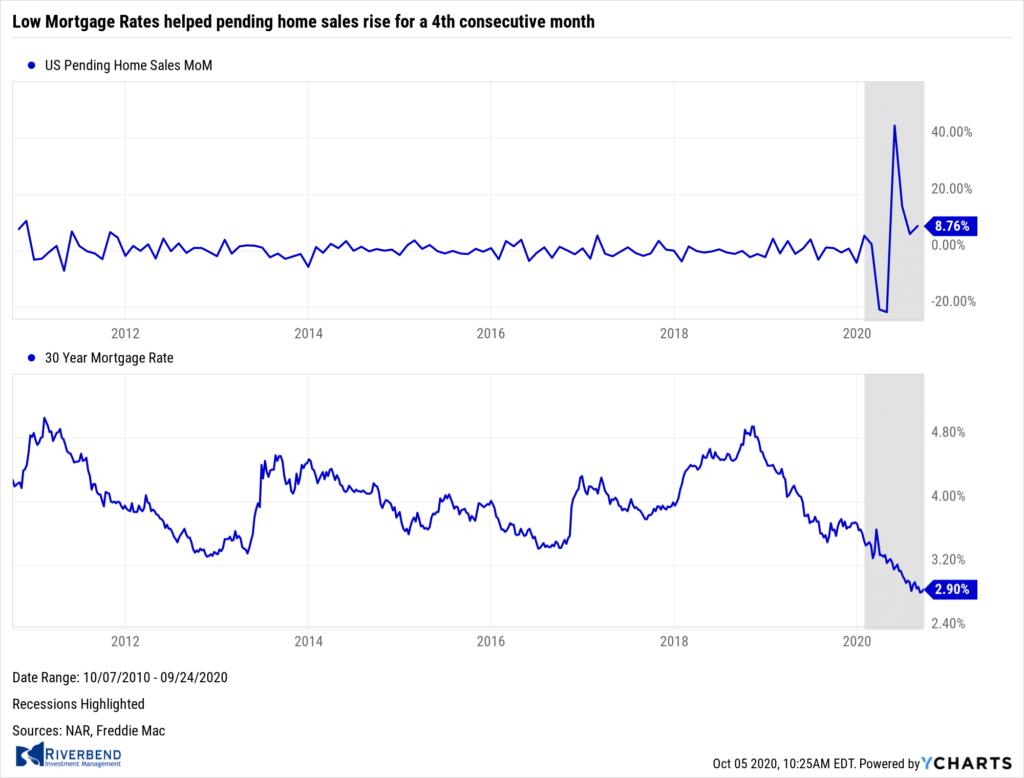 The National Association of Realtors (NAR) reported pending home sales, which counts the number of real-estate transactions in which a contract has been signed but not yet closed, rose for a fourth consecutive month in August to a new record high. The NAR reported pending home sales rose 8.8% in its latest reading.
Compared with the same time last year, contract signings were up 24%. “Tremendously low mortgage rates — below 3% — have again helped pending home sales climb in August,” Lawrence Yun, the National Association of Realtors’ chief economist, said in the report. All regions of the country rose, but the West led the way with a 13% gain.
 Home-price appreciation maintained its upward trajectory in July as buyers flooded the market only to find fewer homes for sale, according to S&P/CoreLogic. S&P’s Case-Shiller 20-city home price index posted a 3.9% year-over-year gain in July. On a monthly basis, the index increased 0.6% between June and July.
Phoenix led all other markets once again with a 9.2% annual price gain. That was followed by Seattle with a 7% increase and Charlotte, N.C. with 6% growth. By region, Craig Lazzara, managing director and global head of index investment strategy at S&P stated, “Prices were particularly strong in the Southeast and West regions, and comparatively weak in the Midwest and Northeast.” Overall, the pace of price growth increased in 16 of the 19 cities Case-Shiller analyzed — the 20-city list did not include Detroit once again this month because transaction records for Wayne County, Mich. were unavailable.
 Confidence among the nation’s consumers rose in September to its highest level since the coronavirus pandemic began a closely followed survey showed. The Conference Board reported its index of consumer confidence jumped 15.5 points to 101.8 this month—its biggest one-month increase in 17 years. Economists had expected just a 3.3 gain.
Lynn Franco, senior director of economic indicators at the board noted in the release, “A more favorable view of current business and labor market conditions, coupled with renewed optimism about the short-term outlook, helped spur this month’s rebound in confidence.” In the details of the report, the sub-index that tracks how consumers feel about the economy right now jumped to 98.5 in September from 85.8 in the prior month, and the sub-index that tracks how Americans view the next 6 months – the so-called “future expectations index” – surged to 104 from 86.6.
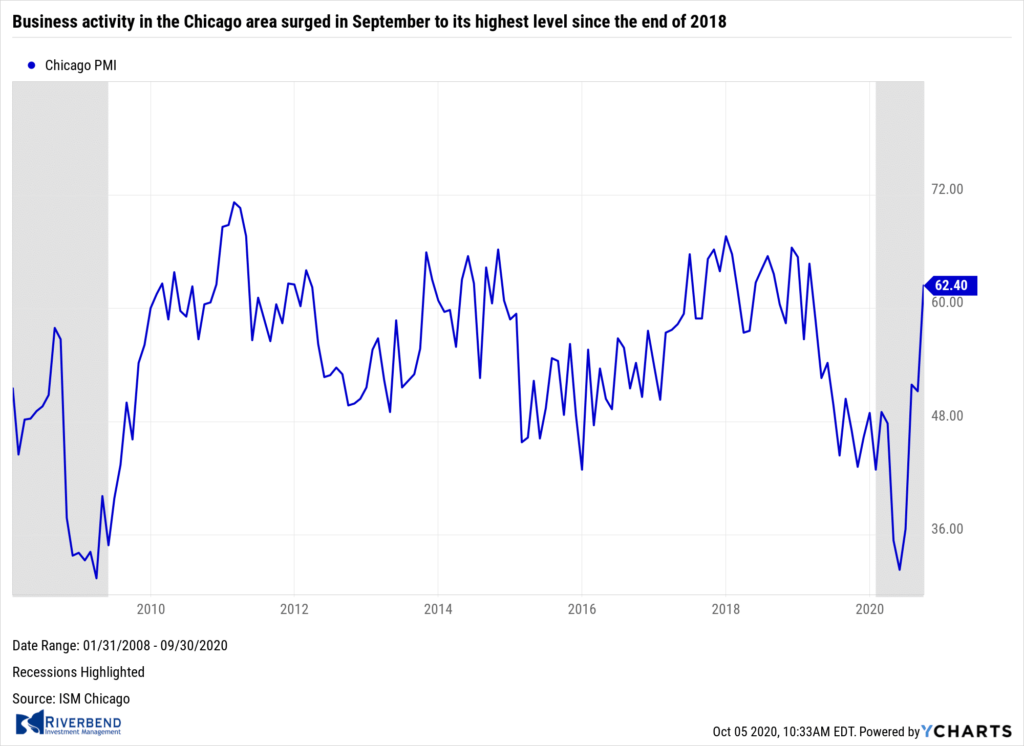 Business activity in the Chicago area surged in September to its highest level since the end of 2018 according to analytics firm MNI Indicators. MNI reported its Chicago PMI business barometer jumped 11.2 points to 62.4 in September. Economists had expected a reading of 52. All five main components of the index rose in September, especially new orders and production. Both advanced to an almost two-year high in a region with a heavy concentration of auto and parts manufacturing. Car sales have been surprisingly strong as of late on the heels of record low interest rates. However, analysts were quick to point out that diffusion indexes such as the Chicago PMI only ask executives if conditions are getting better or worse—not by how much. Rubella Farooqi, Chief U.S. economist at High Frequency Economics stated in a note, “Manufacturing is still rising from low levels, but momentum has slowed in recent months.”
Chart of the Week:
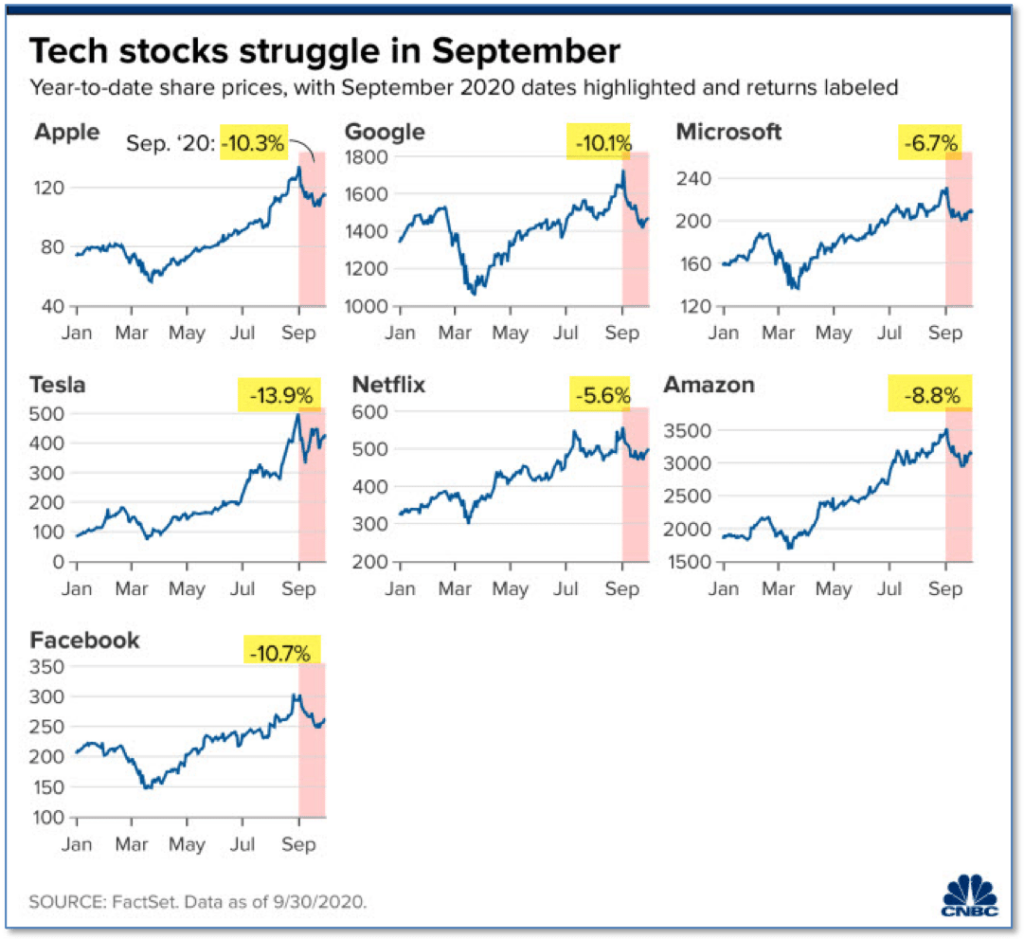
As September came to a close analysts described the NASDAQ’s performance as a “perfect storm” and “a ‘Nightmare on Elm Street’ month”. The NASDAQ, which gets about 40% of its value from just a handful of technology stocks, lost more than 5% in September.
Apple, which had managed to weather the Covid-19 pandemic relatively unscathed, closed down -10.25% from the closing price on Aug. 31. Prudential Financial chief market strategist Quincy Krosby stated, “There were many elements in the market this September that aligned themselves to basically go from an overbought situation for the mega cap tech names to now become oversold.”
Riverbend Indicators Update:

Each week we post notable changes to the various market indicators we follow.
- As a reading of our Bull-Bear Indicator for U.S. Equities (comparative measurements over a rolling one-year timeframe), we remain in Cyclical Bull territory.
- Counting-up of the number of all our indicators that are ‘Up’ for U.S. Equities, the current tally is that four of four are Positive, representing a multitude of timeframes (two that can be solely days/weeks, or months+ at a time; another, a quarter at a time; and lastly, the {typically} years-long reading, that being the Cyclical Bull or Bear status).
Observations:
Last week, our short term indicator turned positive. While this is a volatile indicator, it does give us some insight into how much risk short term investors are willing to take.
After last month’s decline – which I view as investors rebalancing before the election and the strong possibility of a Biden win – the market looks like it is about to continue its upward trajectory.
(However – I wouldn’t be surprised to see some short-term, news-driven volatility after President Trump’s COVID diagnosis.)
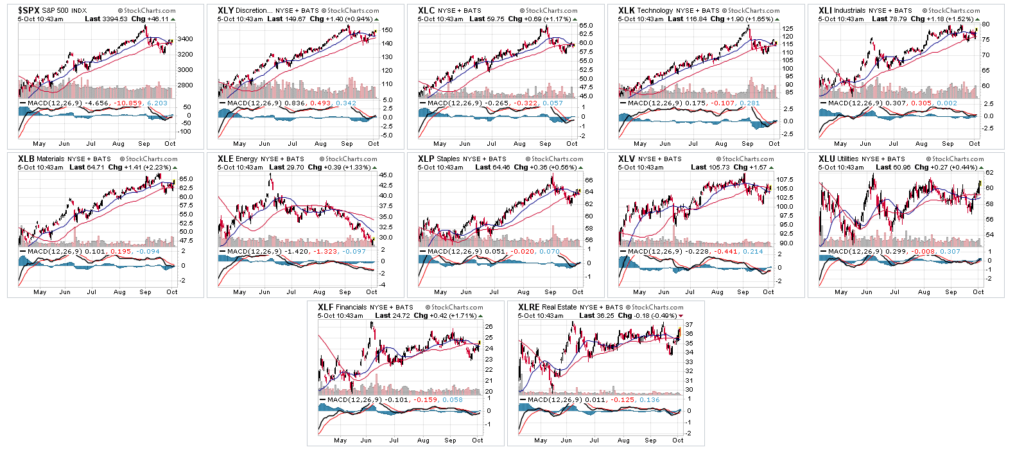
Leadership sectors are showing strength again, which is a good sign as it indicates investors are not seeing any changes to this year’s investment themes:
The Week Ahead:
Monday:
- Eurozone Retail Sales m/m +2.4% exp, -1.3% prior
- U.S. ISM Non-Manufacturing PMI 56.3 exp, 56.9 prior
Tuesday:
- German Factory Orders m/m +3.0% exp, +2.8% prior
- Fed Chair Powell Speaks
- U.S. JOLTs Job Openings 6.50 mln exp, 6.62 mln prior
Wednesday:
- German Industrial Production m/m +1.5% exp, +1.2% prior
- U.S. 10-year Note Auction 0.70% WI, 2.3 b/c
- U.S. Consumer Credit m/m 14.9 bln exp, 12.2 bln prior
- Chinese Caixin Services PMI 54.5 exp, 54.0 prior
Thursday:
- German Trade Balance 17.1 bln exp, 18.0 bln prior
- U.S. Unemployment Claims 820k exp, 837k prior
- U.S. 30-year Bond Auction 1.47% WI, 2.3 b/c
Friday:
- UK GDP m/m +4.6% exp, +6.6% prior
- Canada Employment Change N/A exp, 245.8k prior


