[fusion_builder_container hundred_percent=”no” equal_height_columns=”no” menu_anchor=”” hide_on_mobile=”small-visibility,medium-visibility,large-visibility” class=”” id=”” background_color=”” background_image=”” background_position=”center center” background_repeat=”no-repeat” fade=”no” background_parallax=”none” parallax_speed=”0.3″ video_mp4=”” video_webm=”” video_ogv=”” video_url=”” video_aspect_ratio=”16:9″ video_loop=”yes” video_mute=”yes” overlay_color=”” video_preview_image=”” border_size=”” border_color=”” border_style=”solid” padding_top=”” padding_bottom=”” padding_left=”” padding_right=””][fusion_builder_row][fusion_builder_column type=”1_1″ layout=”1_1″ background_position=”left top” background_color=”” border_size=”” border_color=”” border_style=”solid” border_position=”all” spacing=”yes” background_image=”” background_repeat=”no-repeat” padding_top=”” padding_right=”” padding_bottom=”” padding_left=”” margin_top=”0px” margin_bottom=”0px” class=”” id=”” animation_type=”” animation_speed=”0.3″ animation_direction=”left” hide_on_mobile=”small-visibility,medium-visibility,large-visibility” center_content=”no” last=”no” min_height=”” hover_type=”none” link=””][fusion_text columns=”” column_min_width=”” column_spacing=”” rule_style=”default” rule_size=”” rule_color=”” hide_on_mobile=”small-visibility,medium-visibility,large-visibility” class=”” id=”” animation_type=”” animation_direction=”left” animation_speed=”0.3″ animation_offset=””]
U.S. Markets: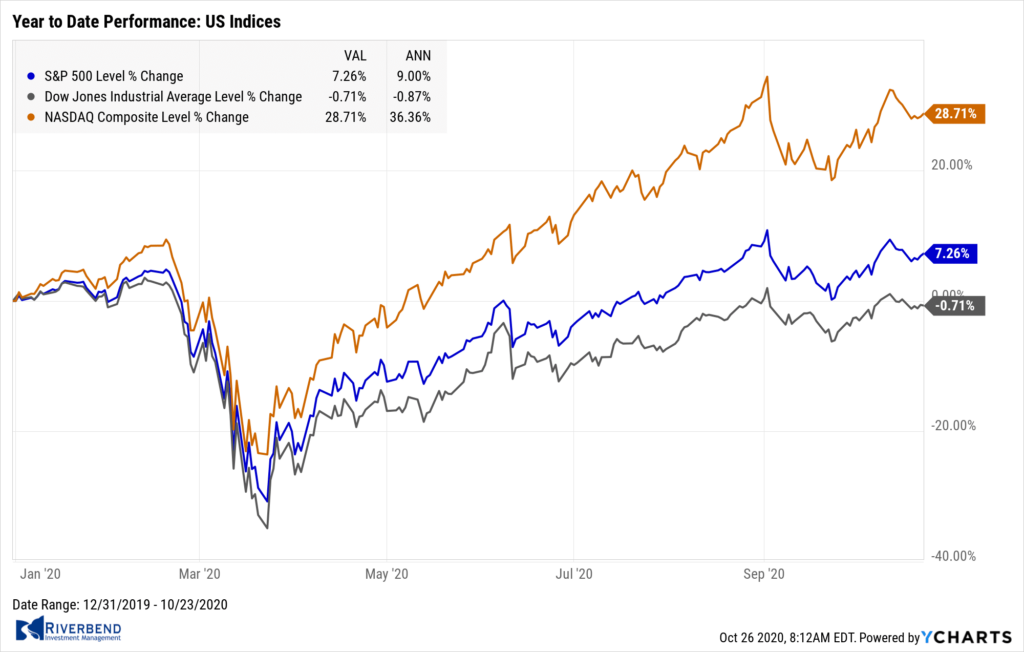
The major U.S. benchmarks ended the week mixed as investors reacted to stimulus negotiations and third-quarter corporate earnings reports.
The technology-heavy NASDAQ Composite performed the worst, dragged lower by weakness in bellwether Apple, while the mid cap S&P 400 and small cap Russell 2000 paced the field with modest gains.
The Dow Jones Industrial Average finished the week down 271 points to 28,336—a decline of -0.9%. The NASDAQ Composite, the worst of the lot, finished down -1.1%.
By market cap, the S&P 500 gave up -0.5%, while the S&P 400 and Russell 2000 rose 0.9% and 0.4%, respectively.
International Markets: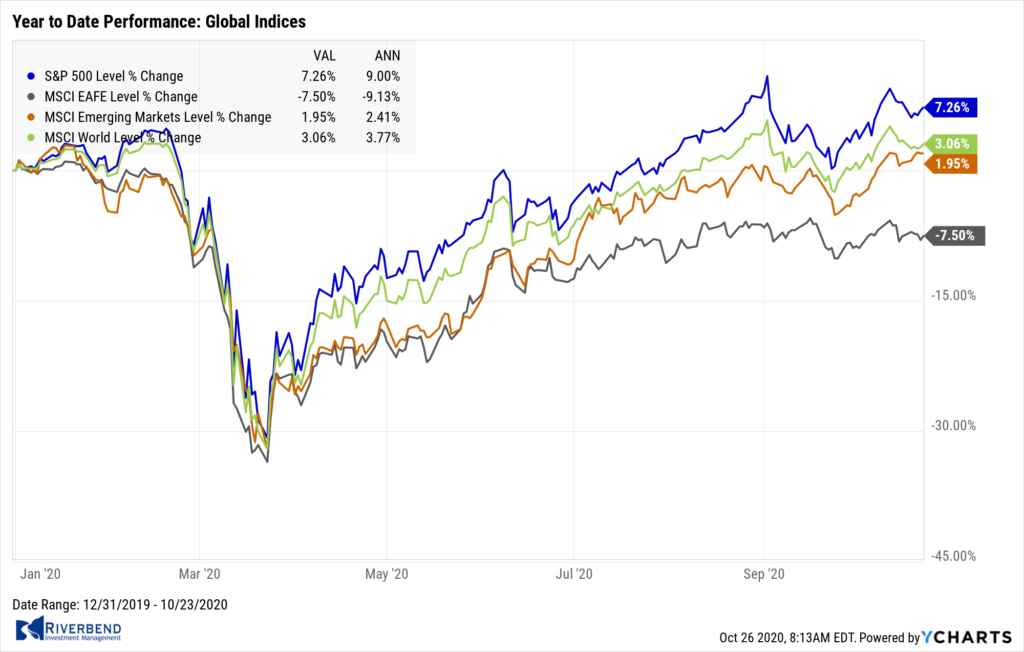
Canada’s TSX fell for a second week, down -0.8%, as was the United Kingdom’s FTSE 100, down -1%.
On Europe’s mainland, France’s CAC 40 declined -0.5% and Germany’s DAX fell -2%.
In Asia, China’s Shanghai Composite gave up -1.7%, while Japan’s Nikkei rose 0.5%.
Despite these headline losses, international markets as a whole gained: as grouped by Morgan Stanley Capital International, developed markets gained 0.4% and emerging markets added 1.7%.
Commodities: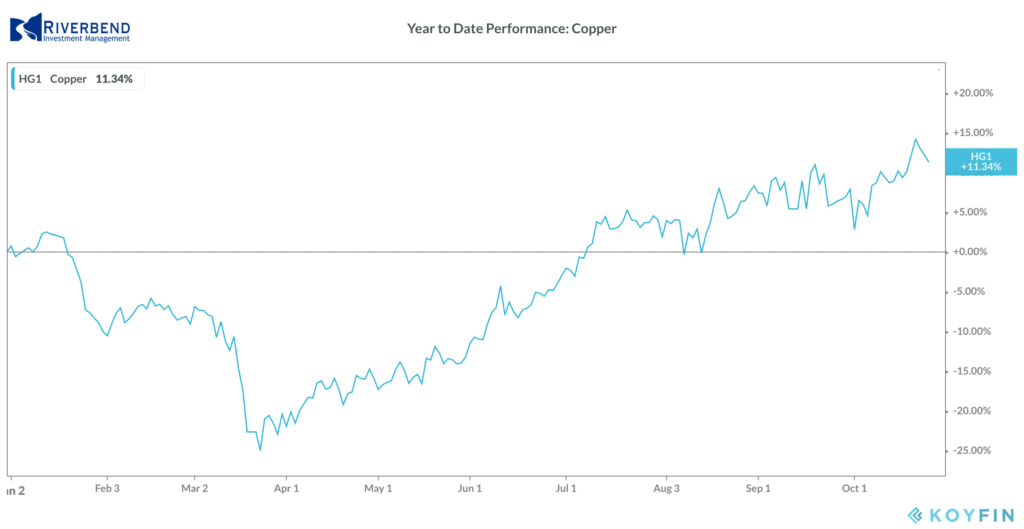
Precious metals finished the week mixed, with Gold declining -$1.20 to $1905.20 per ounce and silver rising 1.1% to $24.67.
Oil declined -3.1% after two weeks of gains finishing the week at $39.85 per barrel of West Texas Intermediate crude.
The industrial metal copper, viewed by some analysts as a barometer of world economic health due to its wide variety of uses, finished the week up 2%.
U.S. Economic News: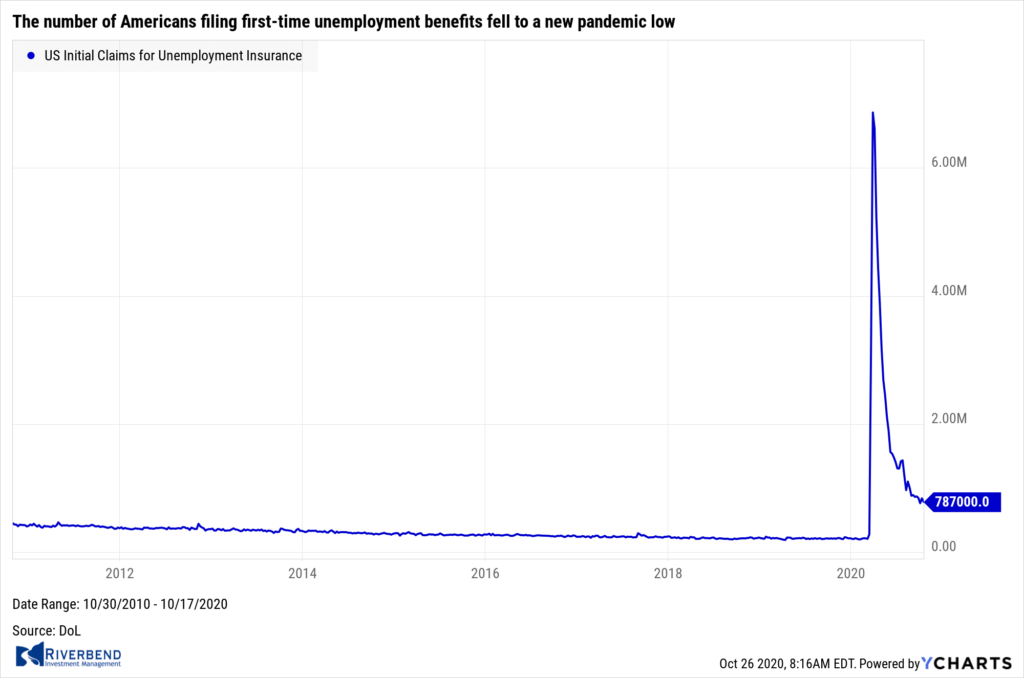
The number of Americans filing first-time unemployment benefits fell to a new pandemic low, a welcome sign for the economy. The Labor Department reported initial jobless claims fell by 55,000 to 787,000, marking the first time they’ve dropped below the 800,000-level since the coronavirus pandemic hit in March. Economists had forecast new claims would fall to 860,000.
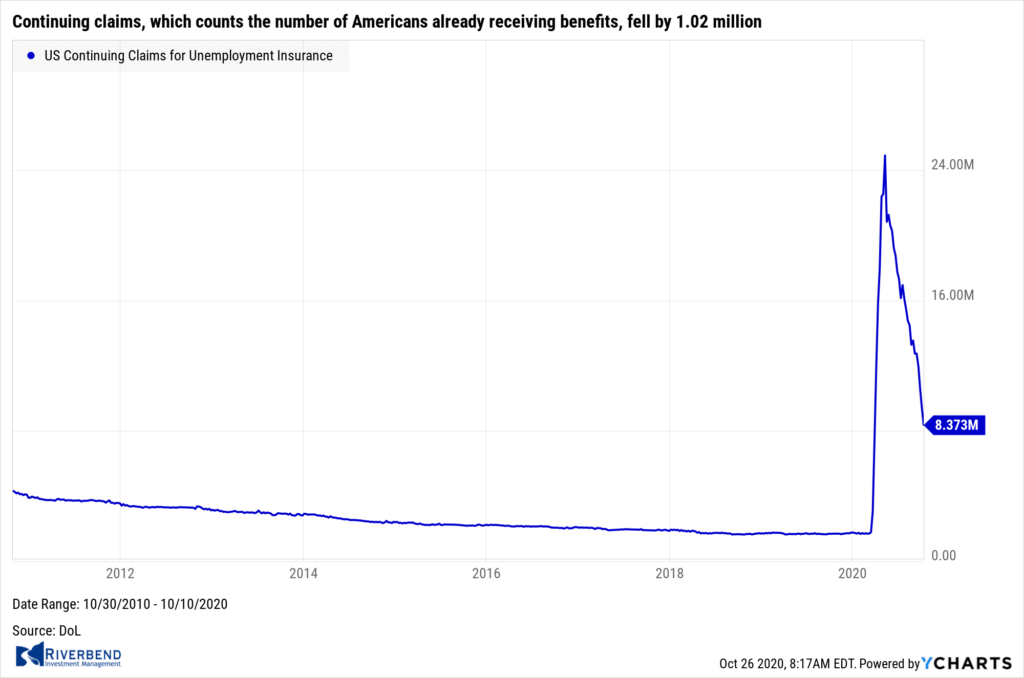 Continuing claims, which counts the number of Americans already receiving benefits, fell by 1.02 million to a seasonally-adjusted 8.37 million. That reading is also a new pandemic low.
Despite the good news, analysts were quick to note that the number of claims remained more than three times higher than before the coronavirus outbreak. Raymond James Chief Economist Scott Brown stated, “The downtrend in claims is good news, but the level is still extremely high by historical standards.”
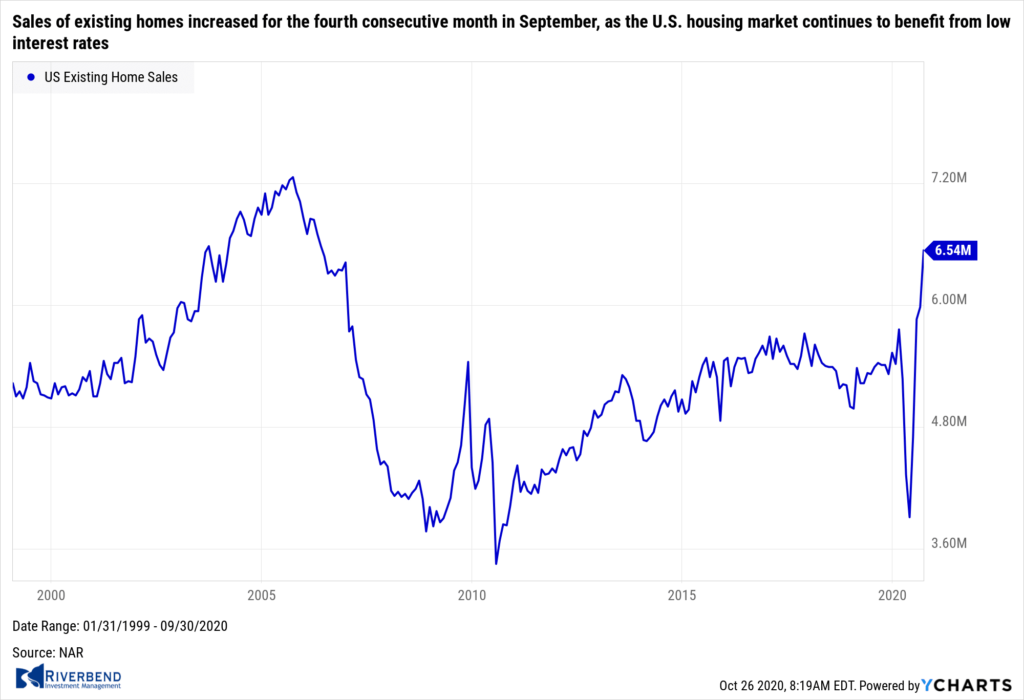 Sales of existing homes increased for the fourth consecutive month in September, as the U.S. housing market continues to benefit from low interest rates. The National Association of Realtors (NAR) reported total existing-home sales rose 9.4% from August to a seasonally-adjusted 6.54 million annual rate. Home sales were up a whopping 21% compared with the same time last year. As a result, the total inventory of homes for sale dropped to just a 2.7 months’ supply.
A 6-month supply of homes is generally considered to be a “balanced” housing market. Lawrence Yun, the NAR’s chief economist wrote in the release that record-low interest rates and an abundance of buyers in the marketplace continued to lift the housing market well into its “non-peak” season. “Home sales traditionally taper off toward the end of the year, but in September they surged beyond what we normally see during this season,” Yun wrote.
 Confidence among the nation’s home builders reached a record high for the third consecutive month as buyers continue to flood into the market. The National Association of Home Builders reported its monthly confidence index rose two points to 85 this month. This was the third month in a row in which the index hit a record high, and only the second time that the confidence measure was at or above 80.
In the details of the report, the index that measures current sales conditions increased two points to 90, while the index of expectations for future sales over the next six points rose three points to 88. By region, the Northeast and West both increased seven points to readings of 88 and 95, respectively. In the Midwest, the index dropped one point to 77, and it fell two points in the South to 83.
The Census Bureau reported construction of new homes rose modestly in September, driven by high demand in the Northeast. Home builders started construction on new homes at a seasonally-adjusted annual rate of 1.42 million last month—a 1.9% increase from the previous month’s downwardly-revised figure. Compared with the same time last year, housing starts were up 11%. The number of home building permits, used by analysts to get a read on future housing activity, occurred at a seasonally-adjusted annual rate of 1.55 million—up more than 5% from August and 8% from a year ago suggesting that new-home construction should continue at a steady clip. Economists had expected starts to occur at just a 1.45 million pace and permits to come in at 1.52 million.
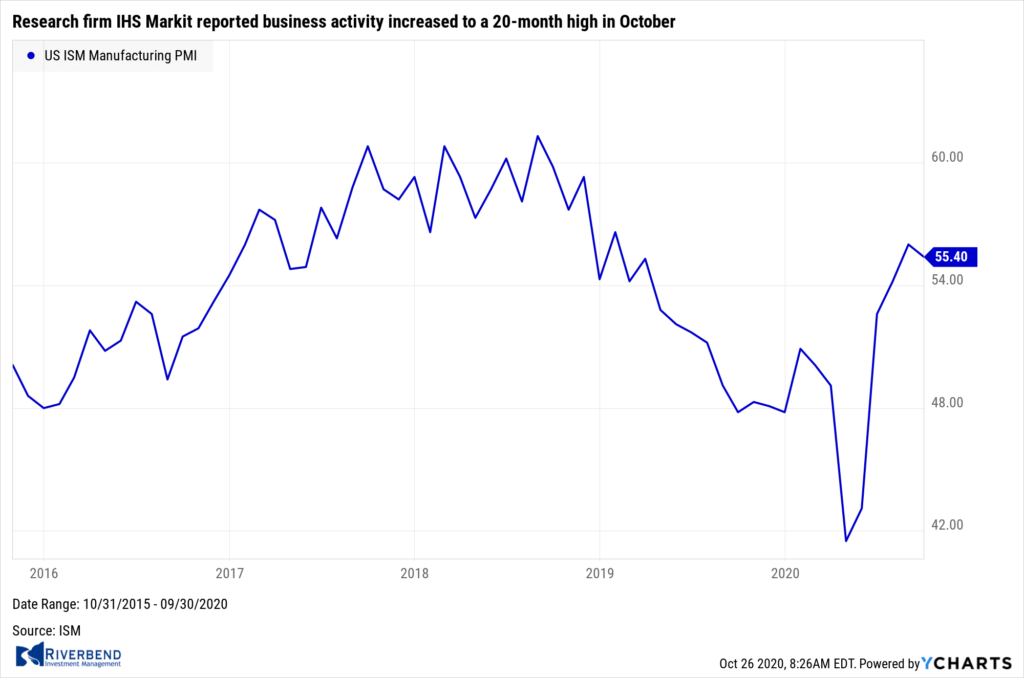 Research firm IHS Markit reported business activity increased to a 20-month high in October; however the pace of new business growth and new orders eased slightly. Markit’s flash U.S. Composite Purchasing Managers Index (PMI) Output Index, which tracks both the manufacturing and services sectors, rose to 55.5 this month. That reading is the highest since February 2019 and up 1.2 points from September.
Despite the reported pick-up in business activity, economists are predicting slower economic growth in the fourth quarter as the effects of the $3 trillion coronavirus stimulus package wane. In the details, Markit reported its services sector index climbed to 56.0 from 54.6, while the index for the smaller manufacturing sector ticked up 0.1 point to 53.3.
The Federal Reserve’s Beige Book—a collection of anecdotes from each of the Fed’s member banks, reported improvements in economic activity in most parts of the country were “slight to modest”. Furthermore, “changes in activity varied greatly by sector,” the central bank said. Restaurants were worried about the looming cooler weather slowing sales (many of which have been able to stay afloat by offering outdoor dining), while banks voiced concerns about the prospect of rising delinquency rates.
The U.S. economy’s rebound has shown some signs of slowing in recent weeks as fiscal stimulus passed in early spring has expired and it appears the nation may experience a resurgence in COVID-19 cases. The most recent economic data has been mixed, with consumer spending rising while jobs gains have slowed.
Chart of the Week: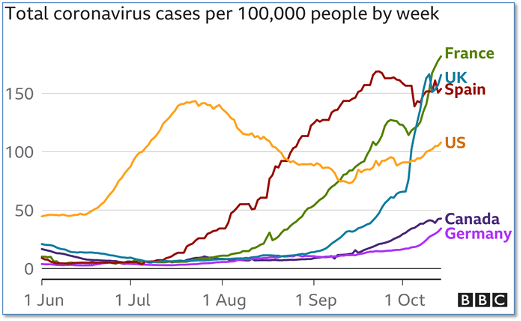
An unfortunate new milestone occurred this week as the number of confirmed coronavirus cases around the world topped 40 million, according to data from Johns Hopkins University.
The recent political rhetoric in the United States might lead one to believe the situation in the U.S. is the worst in the world, but the data shows otherwise. New daily cases per 100,000 population in many major European nations are actually far higher than in the U.S.
As the chart above shows, France, the UK and Spain have all rocketed much higher than the U.S. since late summer.
Riverbend Indicators Update:

Each week we post notable changes to the various market indicators we follow.
- As a reading of our Bull-Bear Indicator for U.S. Equities (comparative measurements over a rolling one-year timeframe), we remain in Cyclical Bull territory.
- Counting-up of the number of all our indicators that are ‘Up’ for U.S. Equities, the current tally is that four of four are Positive, representing a multitude of timeframes (two that can be solely days/weeks, or months+ at a time; another, a quarter at a time; and lastly, the {typically} years-long reading, that being the Cyclical Bull or Bear status).
Observations:
As we enter the week before the US elections, our indicators remain positive. The markets have now entered a “wait and see” period.
From my vantage point — while the markets believe a Biden win is inevitable, a decisive win by either candidate will be viewed as a positive by the market.
Historically, investors do not like the unknown. A contested election will be viewed as a negative outcome. IF this occurs, I would expect to see higher levels of volatility in the market until resolved.
Post-election (assuming a winner is declared in short-term) investors will revert back to their focus on stimulus talks again, which will most likely continue to drive the market higher into year-end.
The Week Ahead:
Monday:
- U.S. New Home Sales 1025k exp, 1011k prior
Tuesday:
- U.S. Durable Goods Orders m/m +1.1% exp, +0.5% prior
- U.S. Core Durable Goods Orders m/m +0.4% exp, +0.6% prior
- U.S. CB Consumer Confidence 101.9 exp, 101.8 prior
Wednesday:
- U.S. Goods Trade Balance -85.0 bln exp, -82.9 bln prior
- U.S. Crude Oil Inventories
Thursday:
- U.S. Advance GDP q/q +32.0% exp, -31.4% prior
- U.S. Unemployment Claims N/A exp, 787k prior
- U.S. Pending Home Sales +3.6% exp, +8.8% prior
Friday:
- U.S. Core PCE Price Index m/m +0.2% exp, +0.3% prior
- U.S. Chicago PMI 58.7 exp, 62.4 prior
- U.S. Revised UoM Consumer Sentiment 81.2 exp, 81.2 prior
(Sources: All index- and returns-data from Yahoo Finance; news from Reuters, Barron’s, Wall St. Journal, Bloomberg.com, ft.com, guggenheimpartners.com, zerohedge.com, ritholtz.com, markit.com, financialpost.com, Eurostat, Statistics Canada, Yahoo! Finance, stocksandnews.com, marketwatch.com, wantchinatimes.com, BBC, 361capital.com, pensionpartners.com, cnbc.com, CNBC, FactSet.)
[/fusion_text][/fusion_builder_column][/fusion_builder_row][/fusion_builder_container]


