[fusion_builder_container hundred_percent=”no” equal_height_columns=”no” menu_anchor=”” hide_on_mobile=”small-visibility,medium-visibility,large-visibility” class=”” id=”” background_color=”” background_image=”” background_position=”center center” background_repeat=”no-repeat” fade=”no” background_parallax=”none” parallax_speed=”0.3″ video_mp4=”” video_webm=”” video_ogv=”” video_url=”” video_aspect_ratio=”16:9″ video_loop=”yes” video_mute=”yes” overlay_color=”” video_preview_image=”” border_size=”” border_color=”” border_style=”solid” padding_top=”” padding_bottom=”” padding_left=”” padding_right=””][fusion_builder_row][fusion_builder_column type=”1_1″ layout=”1_1″ background_position=”left top” background_color=”” border_size=”” border_color=”” border_style=”solid” border_position=”all” spacing=”yes” background_image=”” background_repeat=”no-repeat” padding_top=”” padding_right=”” padding_bottom=”” padding_left=”” margin_top=”0px” margin_bottom=”0px” class=”” id=”” animation_type=”” animation_speed=”0.3″ animation_direction=”left” hide_on_mobile=”small-visibility,medium-visibility,large-visibility” center_content=”no” last=”no” min_height=”” hover_type=”none” link=””][fusion_text]
U.S. Markets: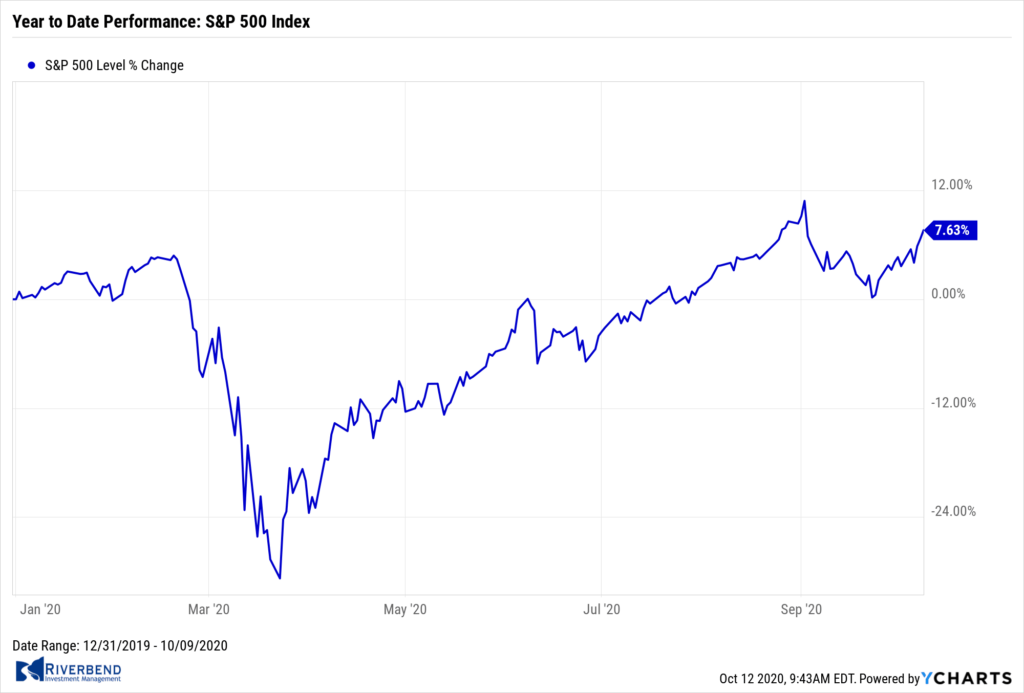
The benchmark S&P 500 index had its best weekly gain in three months, as investors seemed to grow more optimistic about a new round of fiscal stimulus as well as treatment options for the coronavirus.
The small-cap Russell 2000 surged over 6%, pulling it back out of correction territory and now within 10% of its 2018 peak. All of the major U.S. benchmarks finished to the upside last week.
The Dow Jones Industrial Average added 904 points finishing at 28,587, a gain of 3.3%. The technology-heavy NASDAQ Composite had its third consecutive week of gains, rising 4.6%.
The large cap S&P 500 added 3.8%, while the mid cap S&P 400 and small cap Russell 2000 rose 4.9% and 6.4%, respectively.
International Markets: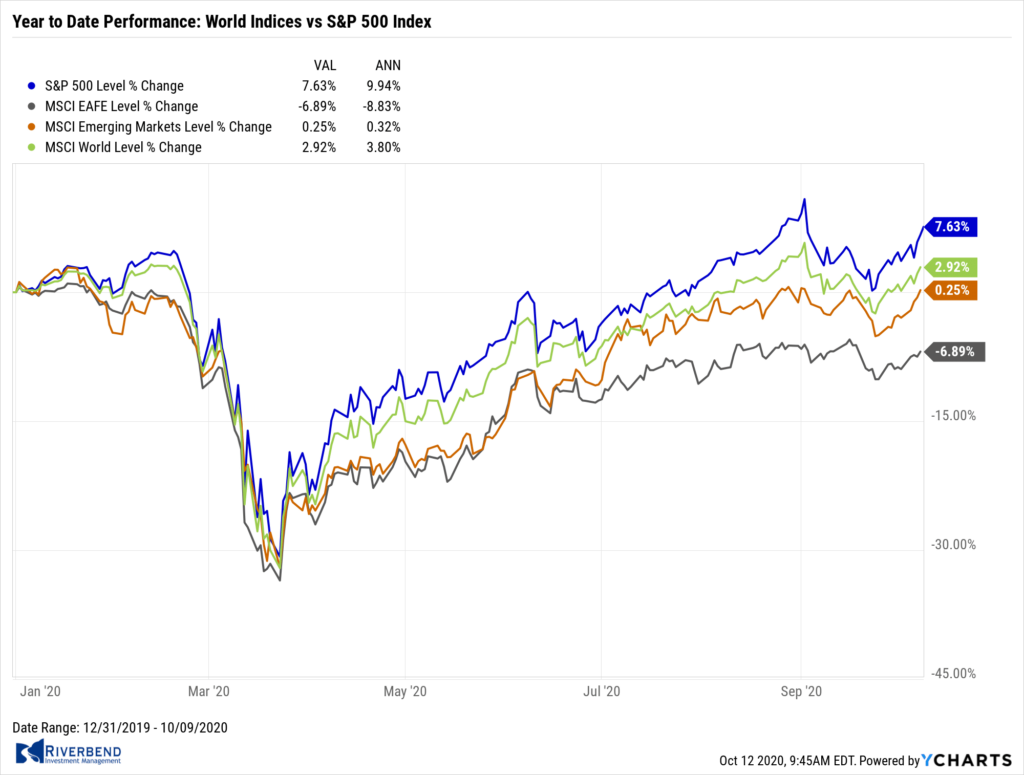
Major international markets finished the week in the green. Canada’s TSX added 2.2%, while the United Kingdom’s FTSE added 1.9%.
On Europe’s mainland France’s CAC 40 rose 2.5%, Germany’s DAX gained 2.9% and Italy’s Milan FTSE added 2.8%.
In Asia, China’s Shanghai Composite rose 1.7% and Japan’s Nikkei added 2.6%.
As grouped by Morgan Stanley Capital International, developed markets rose 2.8%, while emerging markets surged 4.2%.
Commodities: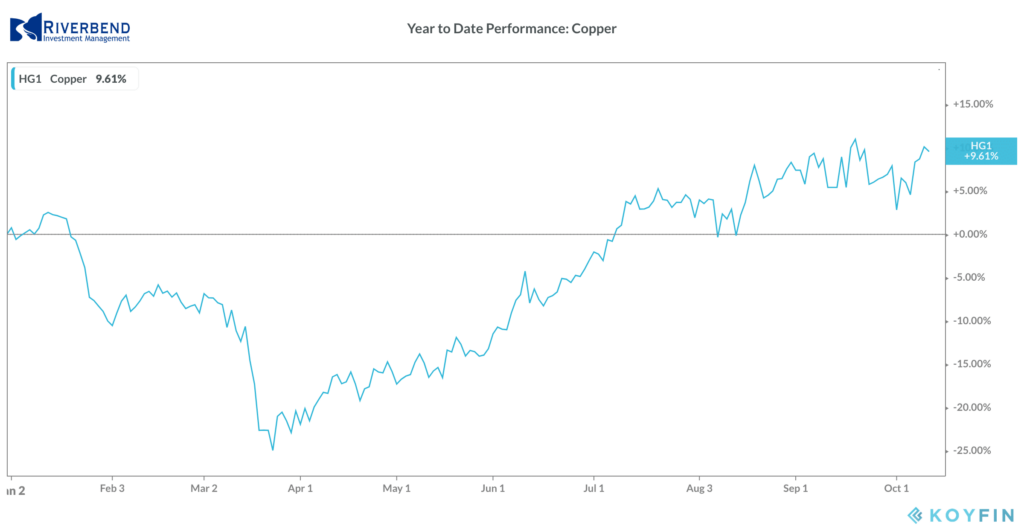
Gold rose for a second week, rising 1% to $1926.20 per ounce. Silver rose for a second week as well finishing the week at $25.11 per ounce, a gain of 4.5%.
Oil retraced last week’s entire decline and then some. West Texas Intermediate crude oil finished the week up 9.6% to $40.60 per barrel.
Copper, viewed by some analysts as a barometer of global economic health due to its wide variety of industrial uses, rose for a second week by adding 3.5%.
U.S. Economic News: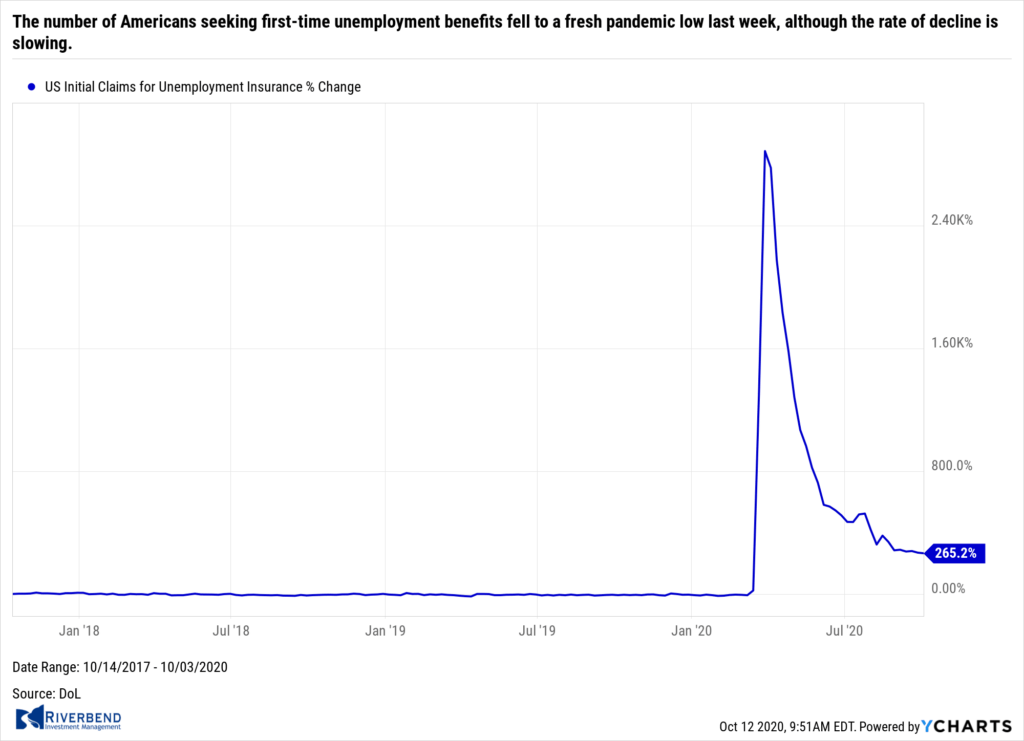
The number of Americans seeking first-time unemployment benefits fell to a fresh pandemic low last week, although the rate of decline is slowing. The Labor Department reported initial jobless claims declined by 9,000 to 840,000 last week. Economists had expected new claims to fall to 820,000. The slowing rate of decline led some analysts to suggest the labor market could be experiencing a setback amid another wave of corporate layoffs.
While new applications for unemployment benefits have gradually receded from a pandemic peak of 6.9 million in late March, the weekly total has fallen by less than 100,000 over the past month. New jobless claims still remain about four times the pre-crisis average and are higher than any point during the financial crisis in 2007-2009.
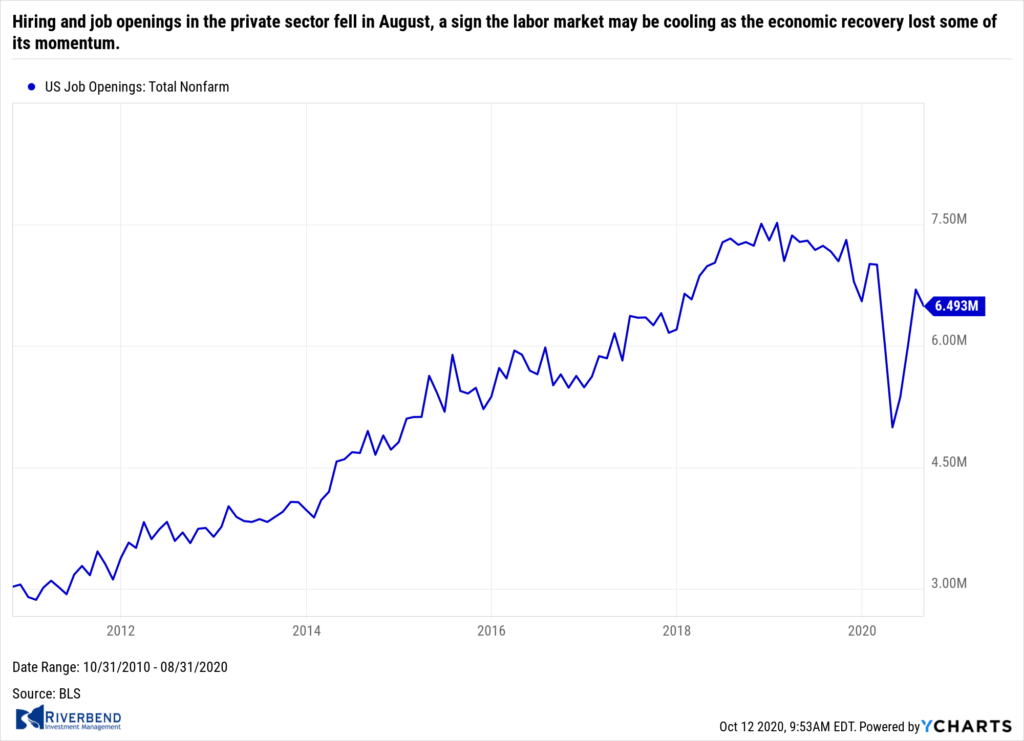 Hiring and job openings in the private sector fell in August, a sign the labor market may be cooling as the economic recovery lost some of its momentum. The Labor Department reported 5.9 million people were hired in August. The number was basically unchanged from July, however analysts noted that number was inflated by the addition of nearly 250,000 temporary workers hired by the U.S. Census for its once-in-a-decade national survey. Hiring in the private sector declined.
Furthermore, job openings slipped to 6.49 million from 6.7 million. The number of jobs available had been running around 7 million a month before the coronavirus struck in March. At the peak of the pandemic in March and April, the U.S. lost more than 24 million jobs. So far it’s only recovered about half of them back.
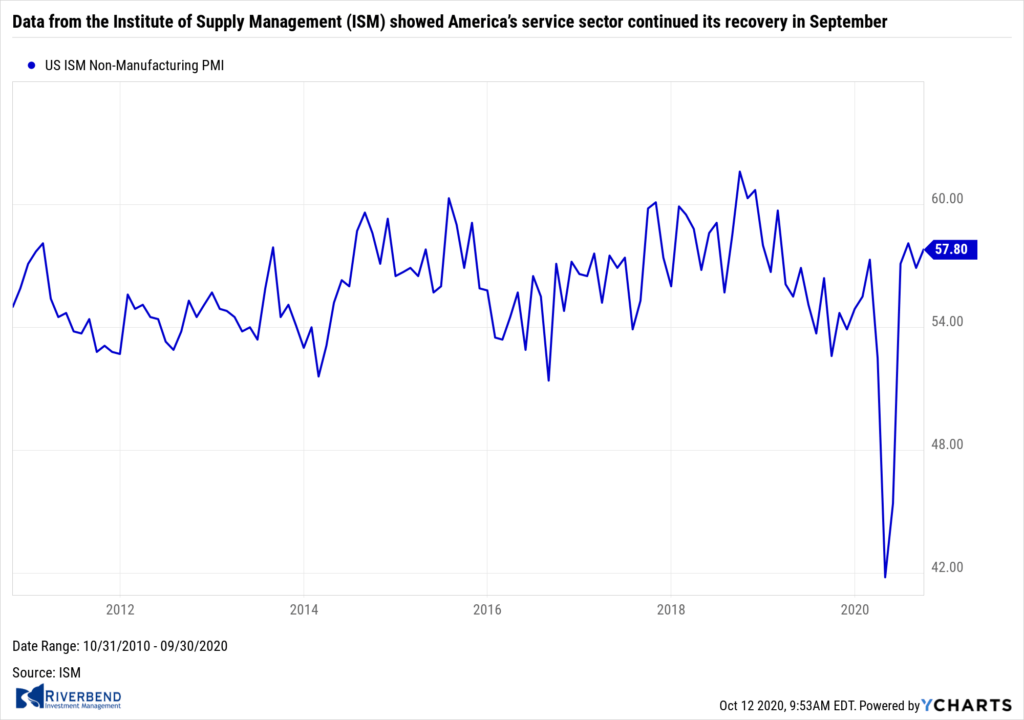 Data from the Institute of Supply Management (ISM) showed America’s service sector continued its recovery in September. ISM reported its services index rose 0.9 point to 57.8, the fourth consecutive month of improvement. Employment also grew for the first time since the pandemic began. The employment gauge climbed to 51.8% from 47.9%, suggesting service sector companies are adding more workers than they are letting go.
Strong gains in both the ISM service and manufacturing indexes suggest the economy continued to rebound following the economic shutdowns due to the coronavirus pandemic. Overall, the improvement in the service side of the economy that employs eight in 10 Americans is good news. Sixteen of the 17 industries tracked by the ISM services index expanded in September.
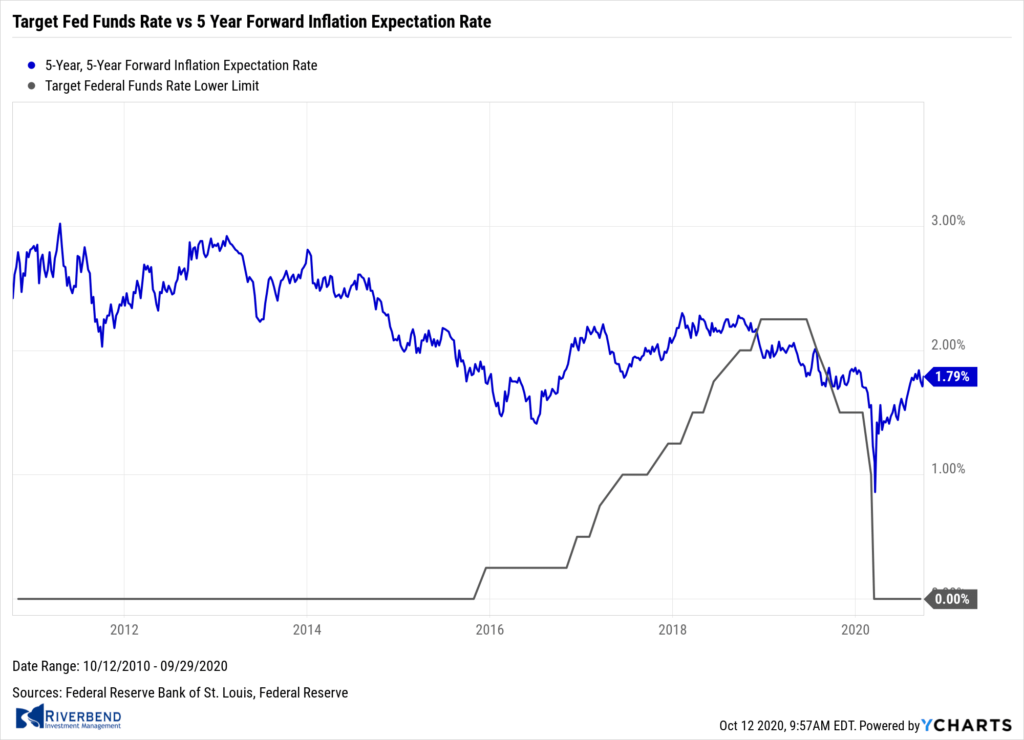 Federal Reserve Chairman Jerome Powell faced skepticism and opposition from other Fed board members regarding his guidance of markets about the future path of interest rates, minutes of September’s meeting released this week showed. After their meeting, the Federal Open Market Committee released a statement vowing to keep interest rate near zero until inflation is on track to moderately exceed the central bank’s 2% target for some time. Fed officials also released projections showing they expected rates would stay near zero until the end of 2023 at least.
There were two dissents from the new forward guidance from the ten voting members of the committee. However, what wasn’t known until the minutes were published was that unease about the new policy was fairly broad among the remaining seven officials who didn’t vote. According to the minutes, “several” of these Fed officials balked at the strategy, in part because the guidance could limit the central bank’s flexibility. They also argued that by influencing the market’s view about the future path of short-term interest rates, “such guidance could contribute to a buildup of financial imbalances that would make it more difficult for the FOMC to achieve its objectives in the future.”
Chart of the Week: 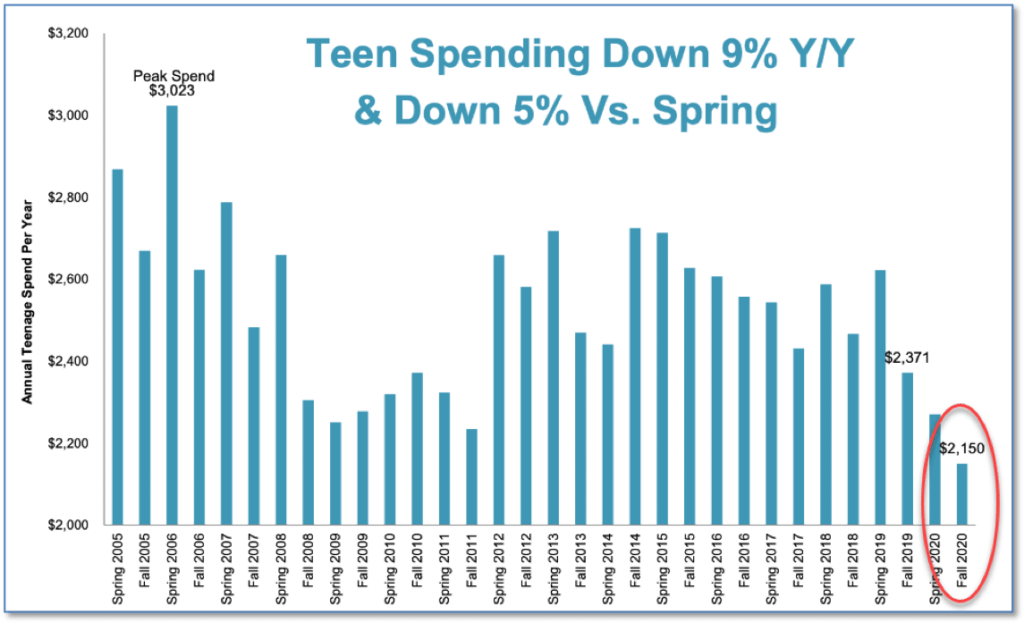
In perhaps one of the most unexpected consequences of the coronavirus pandemic, spending among America’s teens has plummeted to a record low, according to analysts at Piper Sandler.
In its latest semi-annual survey of U.S. teens they found that teen spending fell to a record low, down 5% from the spring and 9% from last year.
In retrospect, the result shouldn’t be a total surprise given that malls (and their retailers), movie theaters, and coffee shops – the main benefactors of teen dollars – have been closed much of the year. The latest reading eclipses the previous survey low recorded in the fall of 2011. (Chart: Piper Sandler)
Riverbend Indicators Update:

Each week we post notable changes to the various market indicators we follow.
- As a reading of our Bull-Bear Indicator for U.S. Equities (comparative measurements over a rolling one-year timeframe), we remain in Cyclical Bull territory.
- Counting-up of the number of all our indicators that are ‘Up’ for U.S. Equities, the current tally is that four of four are Positive, representing a multitude of timeframes (two that can be solely days/weeks, or months+ at a time; another, a quarter at a time; and lastly, the {typically} years-long reading, that being the Cyclical Bull or Bear status).
Observations:
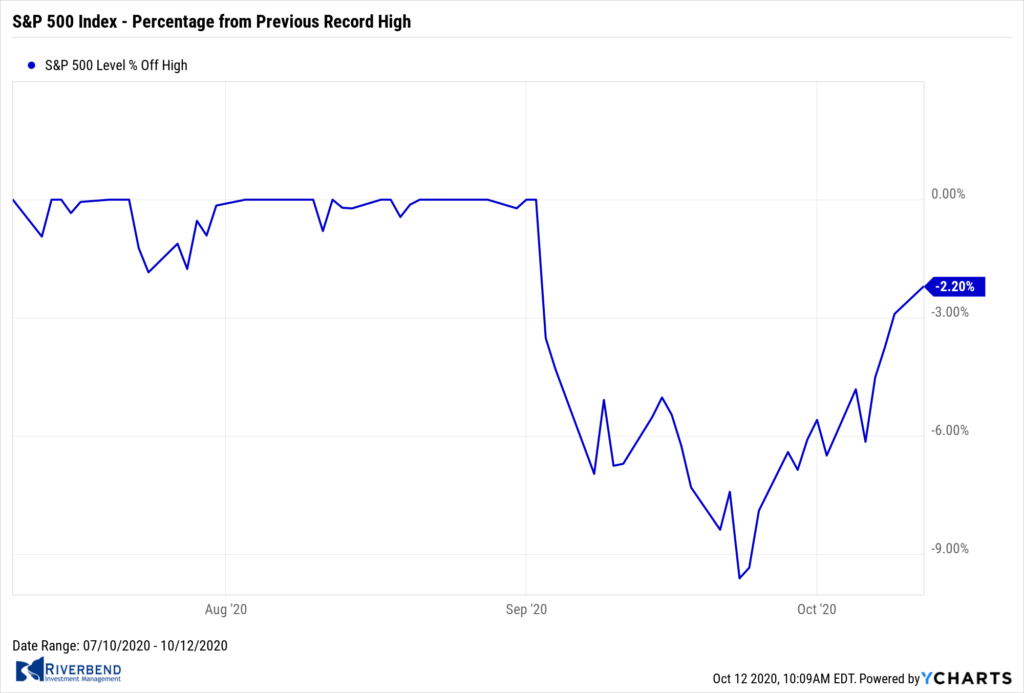
Last week, US equities markets rallied on hopes of a larger than expected stimulus package. Investors are noticing that Trump is unable to use one of his key arguments about the strength of the economy — a record-high stock market.
The S&P 500 Index is still 2-3% below its previous record high and some market watchers are beginning to wonder if we are about to get a major push for a larger than expected stimulus package, as well as a lot more pro-market speak from the White House leading into the election.
The Week Ahead:
Monday:
- USD-Denominated China Trade Balance 59.3 bln exp, 58.9 bln prior
Tuesday:
- German ZEW Economic Sentiment 74.1 exp, 77.4 prior
- U.S. NFIB Small Business Index 100.9 exp, 100.2 prior
- U.S CPI m/m +0.2% exp, +0.4% prior
Wednesday:
- Eurozone Industrial Production m/m +0.8% ep, +4.1% prior
- U.S. PPI m/m +0.2% exp, +0.3% prior
- Australia Employment Change -35k exp, +111k prior
- China CPI y/y +1.9% exp, +2.4% prior
Thursday:
- U.S Philly Fed Manufacturing Index 14.4 exp, 15.0 prior
- U.S. Unemployment Claims 810k exp, 840k prior
Friday:
- U.S. Retail Sales m/m +0.7% exp, +0.6% prior
- U.S. Industrial Production m/m +0.6% exp, +0.4% prior
- U.S. Prelim Consumer Sentiment 80.2 exp, 80.4 prior
[/fusion_text][/fusion_builder_column][/fusion_builder_row][/fusion_builder_container]


