[fusion_builder_container hundred_percent=”no” equal_height_columns=”no” menu_anchor=”” hide_on_mobile=”small-visibility,medium-visibility,large-visibility” class=”” id=”” background_color=”” background_image=”” background_position=”center center” background_repeat=”no-repeat” fade=”no” background_parallax=”none” parallax_speed=”0.3″ video_mp4=”” video_webm=”” video_ogv=”” video_url=”” video_aspect_ratio=”16:9″ video_loop=”yes” video_mute=”yes” overlay_color=”” video_preview_image=”” border_size=”” border_color=”” border_style=”solid” padding_top=”” padding_bottom=”” padding_left=”” padding_right=””][fusion_builder_row][fusion_builder_column type=”1_1″ layout=”1_1″ background_position=”left top” background_color=”” border_size=”” border_color=”” border_style=”solid” border_position=”all” spacing=”yes” background_image=”” background_repeat=”no-repeat” padding_top=”” padding_right=”” padding_bottom=”” padding_left=”” margin_top=”0px” margin_bottom=”0px” class=”” id=”” animation_type=”” animation_speed=”0.3″ animation_direction=”left” hide_on_mobile=”small-visibility,medium-visibility,large-visibility” center_content=”no” last=”no” min_height=”” hover_type=”none” link=””][fusion_text]
U.S. Markets: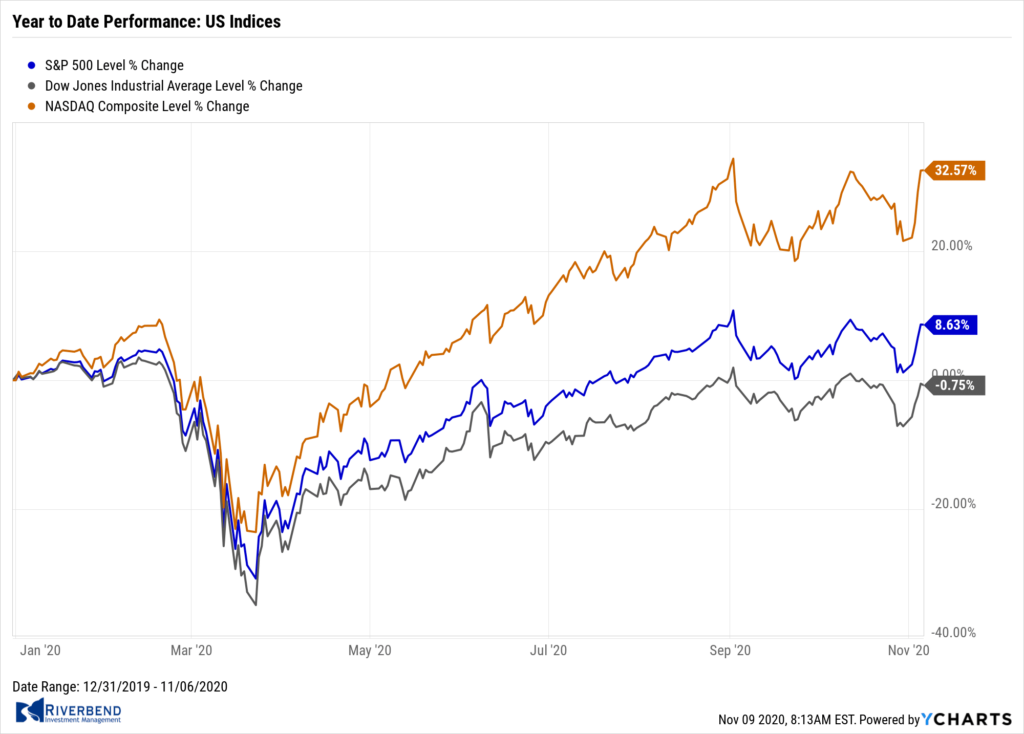
Stocks posted their largest weekly gain since April, despite the lack of a clear winner – during the week – from the presidential election. With Democrat front-runner Joe Biden appearing to have the clearest path to victory and Republicans likely to retain control of the Senate, investors began to anticipate a possible “Goldilocks” scenario of additional fiscal stimulus but more limited tax increases than under the “blue wave” Democratic sweep that didn’t happen despite the predictions of many pollsters.
The Dow Jones Industrial Average surged over 1,800 points to 28,323 – a gain of 6.9%. The technology-heavy NASDAQ Composite jumped 9.0%, retracing all of the last two week’s declines and then some.
By market cap, the large cap S&P 500 rose 7.3%, while the mid cap S&P 400 and small cap Russell 2000 gained 6.7% and 7.1%, respectively.
International Markets: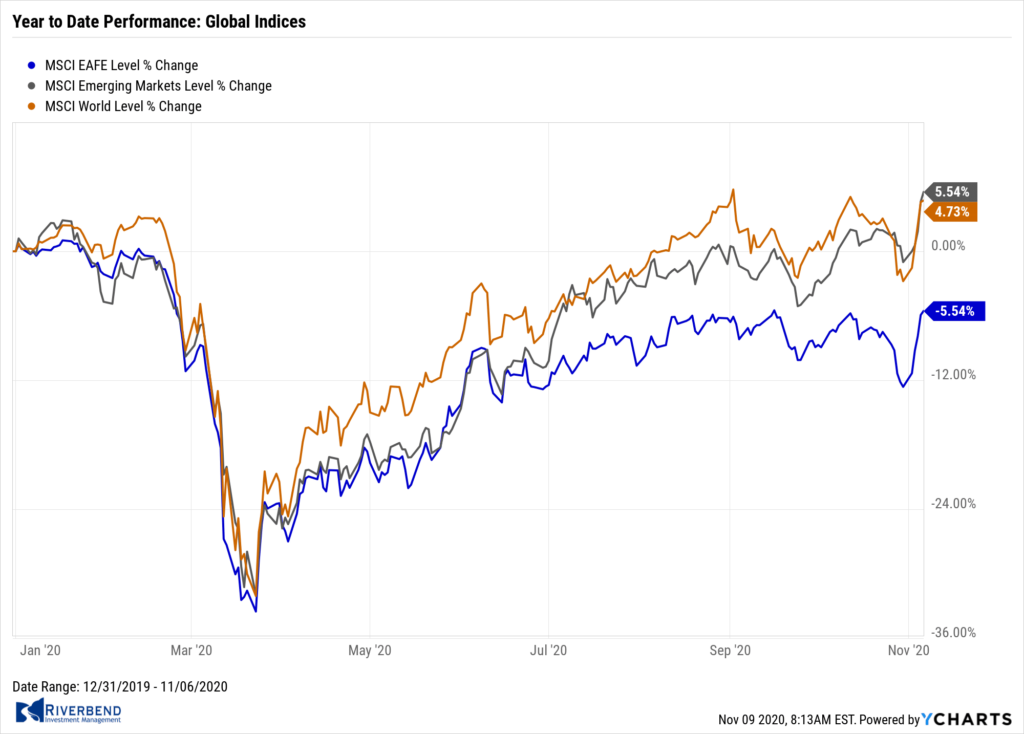
Like the U.S. markets, international markets were also a sea of green this past week. Canada’s TSX rose 4.5%, while the United Kingdom’s FTSE 100 added 6.0%.
On Europe’s mainland France’s CAC 40 and Germany’s DAX each rose 8.0%. In Asia, China’s Shanghai Composite rose 2.7% and Japan’s Nikkei added 5.9%.
As grouped by Morgan Stanley Capital International, emerging markets finished the week up 7.2% and developed markets rose 7.9%.
Commodities: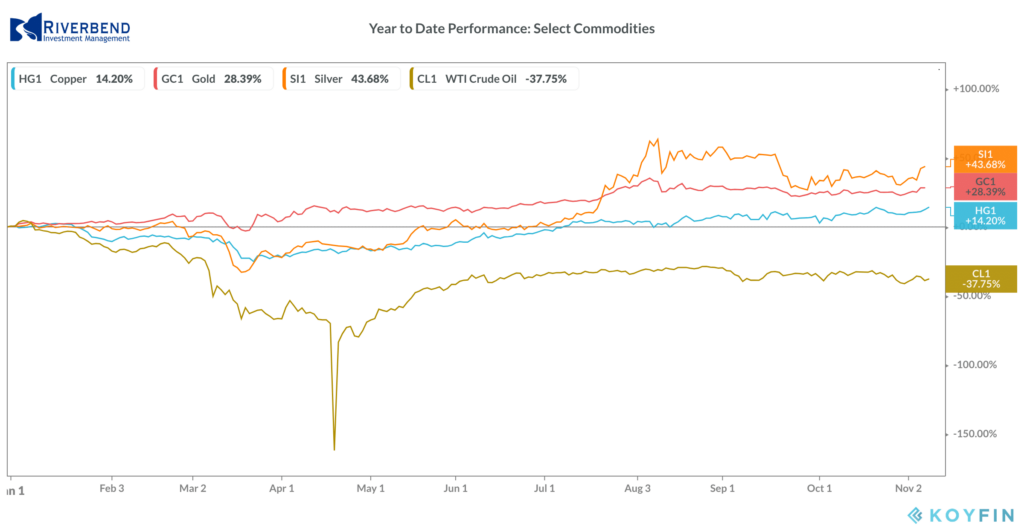
Precious metals joined the rally in the equities markets. Gold rose 3.8% to $1951.70 per ounce, while Silver surged over 8.5% to $25.66.
Oil, likewise, finished the week to the upside. West Texas Intermediate crude oil rose 3.8% to $37.14 per barrel.
The industrial metal copper, viewed by some analysts as a barometer of global economic health due to its wide variety of uses, finished the week up 3.5%.
U.S. Economic News: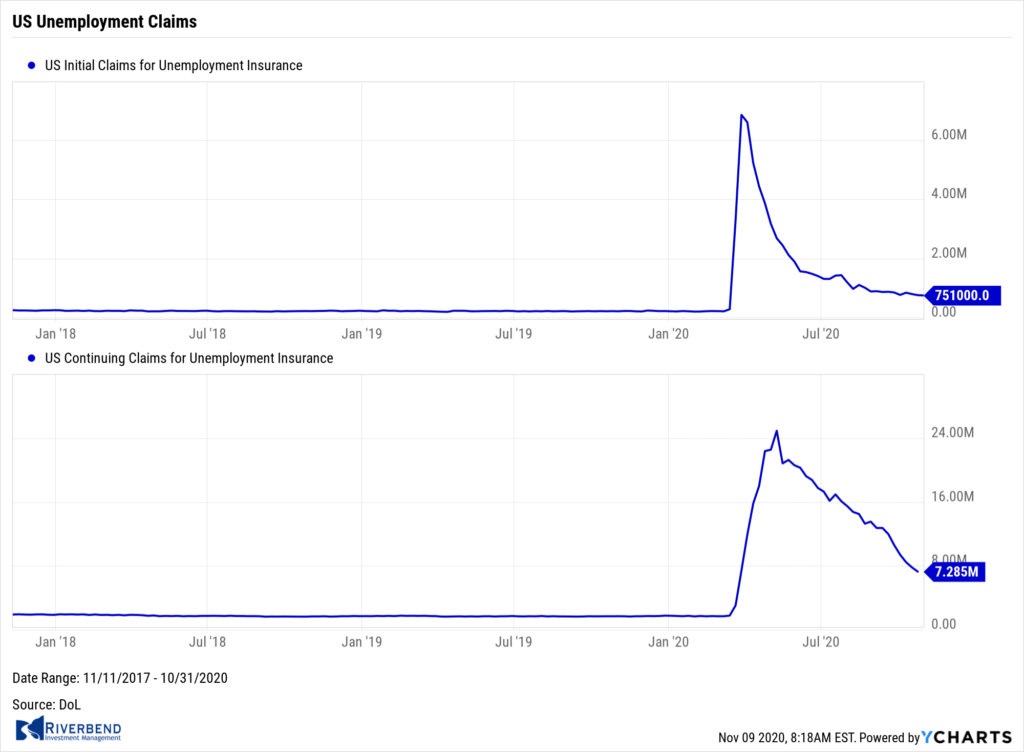
The number of Americans seeking first-time unemployment benefits fell slightly last week but remained near historic highs. The Labor Department reported initial jobless claims fell by 7,000 to 751,000. Economists had expected a more significant decline to 728,000. After a steep drop off in new claims last summer, the rate of decline has slowed markedly.
Chief economist Ian Shepherdson of Pantheon Economics wrote in a note, “The trend in initial claims probably is now about flat — and still well above the 665,000 peak seen after the crash of 2008.” The trend in continuing claims is improving, however. The number of people already collecting state-provided benefits, known as continuing claims, dropped by 538,000 to a seasonally adjusted 7.29 million in the week ended Oct 24. That’s a fresh pandemic low.
The U.S. added 638,000 jobs in October and the unemployment rate fell sharply, reflecting a surprising show of strength for the economy. The Bureau of Labor Statistics reported the unemployment rate fell to a fresh pandemic low of 6.9% from 7.9% in September. In the report, private-employment rose by 906,000, however a sharp decline in government employment pulled down the overall total. The increase in hiring last month was largely concentrated in professional businesses, leisure and hospitality, and retail.
Hiring in October was strongest among white-collar companies in technology and other professional fields. They added 208,000 jobs. Bars and restaurants also created 192,000 jobs while hotels hired 34,000 workers. Analysts warned clients not to get too optimistic following the report. Economist Thomas Simons of Jefferies LLC wrote, “We should not expect to see anything nearly this strong in the months ahead, but it is encouraging nonetheless.”
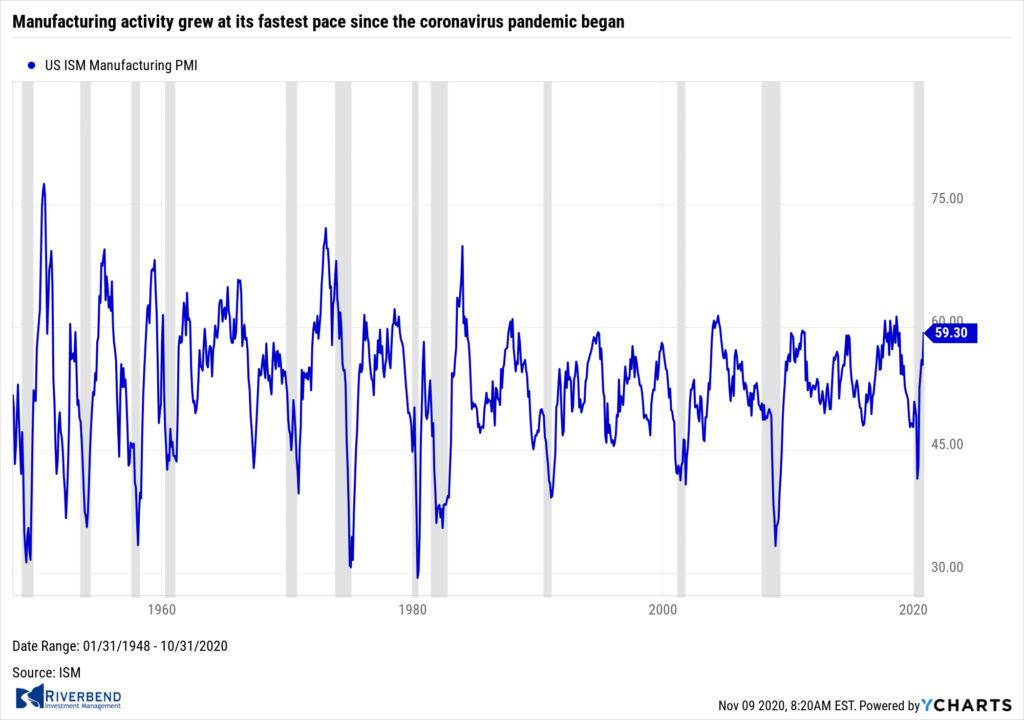 Manufacturing activity grew at its fastest pace since the coronavirus pandemic began last month, according to the Institute for Supply Management (ISM). The ISM index of manufacturers climbed to a two-year high of 59.3 in October—up 3.9 point from September. The increase topped the 56.5 forecast of economists. In the report, the gauge for new orders jumped to 67.9 from 60.2 — the highest reading since 2004. The index for production also increased to 63 from 61.
In addition, employment turned positive for the first time in 14 months. Overall, 15 of the 18 industries tracked by ISM reported growth last month. Chief economist Gus Faucher of PNC Financial Services wrote in a note, “Manufacturing rebounded strongly with fewer restrictions on economic activity and stimulus efforts, but the path forward will be more difficult as the economy continues to cope with the pandemic.”
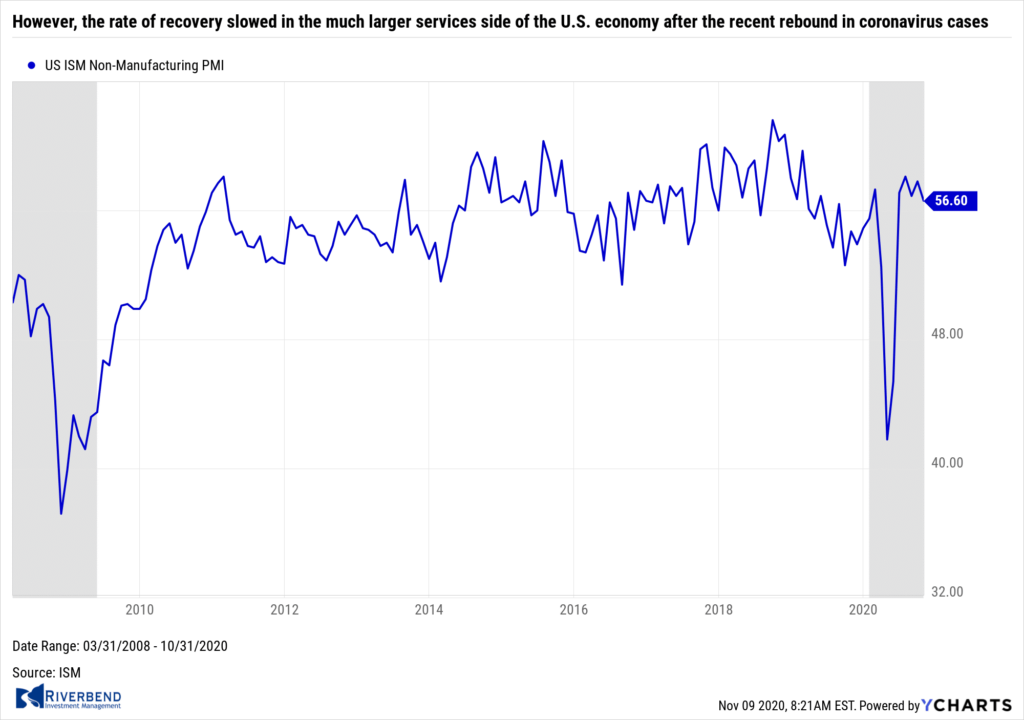 However, the rate of recovery slowed in the much larger services side of the U.S. economy after the recent rebound in coronavirus cases. While still expanding, ISM reported its survey of non-manufacturing companies slipped to 56.6 in October from 57.8. Of the 18 service industries tracked by ISM, 16 expanded in October. The only two that contracted in October were entertainment and local and state government. A gauge of output fell slightly, as did new orders, but both were still quite strong. A measure of jobs and hiring, perhaps the most critical component of the survey, also declined. The employment index dipped to 50.1% from 51.8%, but it remained above the key 50% level for the second month in a row.
Chart of the Week: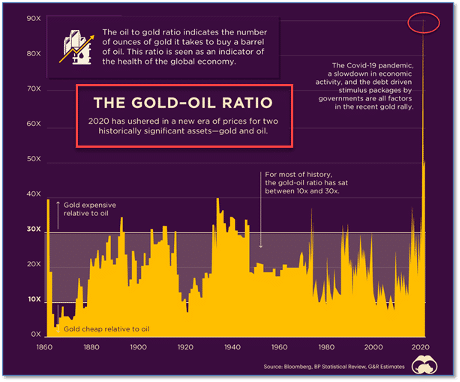
For most of the past 160 years, the ratio of price between two of the most widely followed commodities – Gold and Oil – has been fixed in a relatively tight range…until this year.
Analysts at the site ‘Visual Capitalist’ showed historically the ratio of the price between an ounce of gold and a barrel of oil has reliably ranged from 10:1 to 30:1. However, this year, that ratio blasted higher to 90:1.
Traditional thought is that gold acts as a “safe-haven” investment that appreciates in price during tumultuous economic and financial times. At the other end of the spectrum is oil which tends to rise and fall with the global economy and geopolitical concerns.
Given that the current ratio is at unprecedented levels, analysts are not quite sure what to make of it. Add it to the list of the many unique facets of 2020.
Riverbend Indicators Update:

Each week we post notable changes to the various market indicators we follow.
- As a reading of our Bull-Bear Indicator for U.S. Equities (comparative measurements over a rolling one-year timeframe), we remain in Cyclical Bull territory.
- Counting-up of the number of all our indicators that are ‘Up’ for U.S. Equities, the current tally is that four of four are Positive, representing a multitude of timeframes (two that can be solely days/weeks, or months+ at a time; another, a quarter at a time; and lastly, the {typically} years-long reading, that being the Cyclical Bull or Bear status).
Observations:
Last week, the US markets posted a very post-election rally. Part of the reason: many investors believed the election wouldn’t be decided until December. (Our models have been fully invested during this time.)
The technology sector posted an even stronger performance as Silicon Valley leaders will be hoping for a reversal of President Trump’s restrictions on H-1B visas, which tech companies use to bring in talented workers from abroad. Biden has said he plans to increase the number of high-skilled visas.
Looking at the current state of the market, equities still have room to move higher. The NYSE Bullish % Indicator, which tells us how overbought/oversold the market is, is nowhere near overbought status:
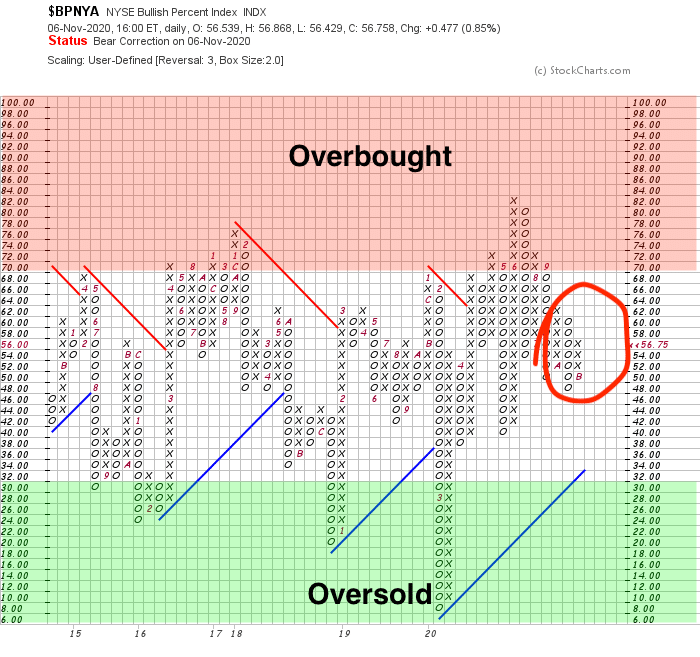
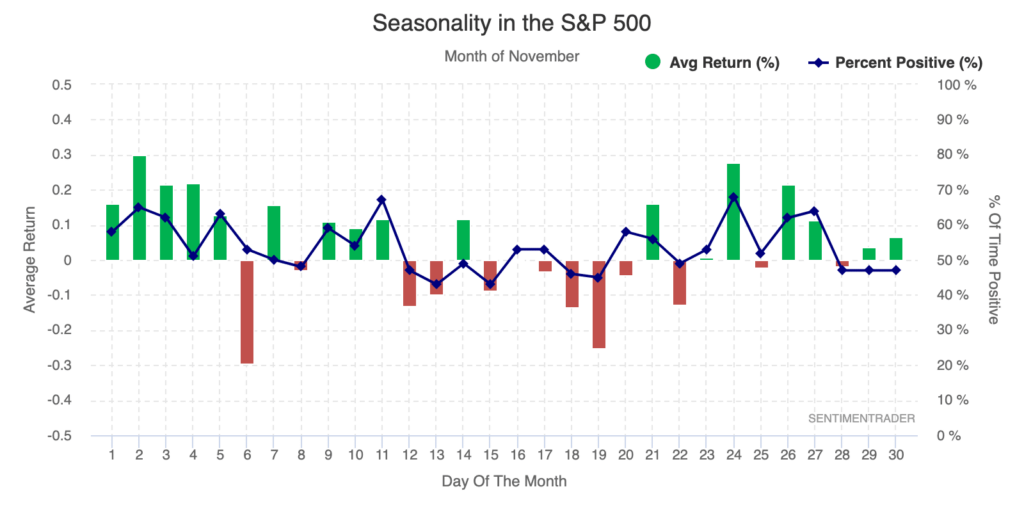
The combination of the market not being overbought, a positive outlook on the Biden/Harris administration, and the historical trend of strong market performance during the month of November, should leave investors very happy.
The Week Ahead:
Monday:
- China CPI y/y +0.8% exp, +1.7% prior
Tuesday:
- U.S. NFIB Small Business Index 104.3 exp, 104.0 prior
- U.S. JOLTs Job Openings 6.50 mln exp, 6.49 mln prior
- U.S. IBD/TIPP Economic Optimism 56.3 exp, 55.2 prior
Wednesday:
- Veterans Day
Thursday:
- Inflation U.S. CPI m/m +0.2% exp, +0.2% prior
- U.S. Core CPI m/m +0.2% exp, +0.2% prior
- U.S. Unemployment Claims 745k exp, 751k prior
Friday:
- U.S. PPI m/m +0.2% exp, +0.4% prior
- U.S. Prelim UoM Consumer Sentiment 82.1 exp, 8.8 prior prior
[/fusion_text][/fusion_builder_column][/fusion_builder_row][/fusion_builder_container]


