U.S. Markets: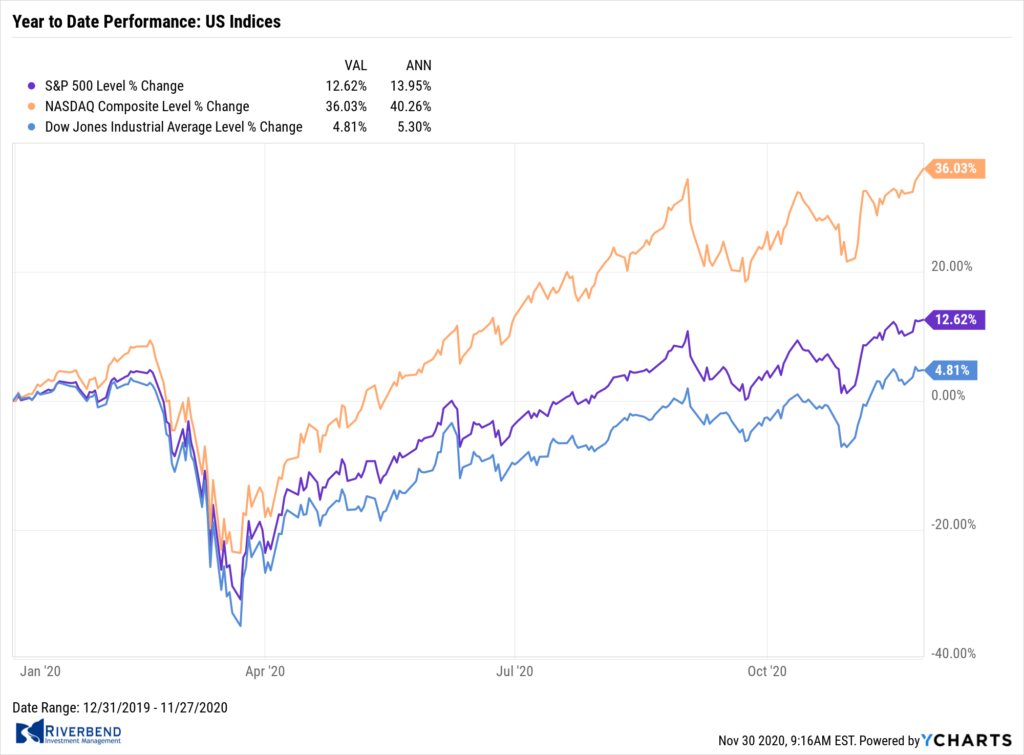
Most of the major U.S. benchmarks reached new record highs this week on optimism for a coronavirus vaccine and diminishing political uncertainty surrounding the presidential election.
The Dow Jones Industrial Average briefly crossed the 30,000-level before ending the week at 29,910 – nonetheless, a gain of 2.2%. The technology-heavy Nasdaq Composite finished the week up 3.0%.
By market cap, the large cap S&P 500 added 2.3%, while the mid cap S&P 400 and small cap Russell 2000 rose 2.7% and 3.9%, respectively.
International Markets: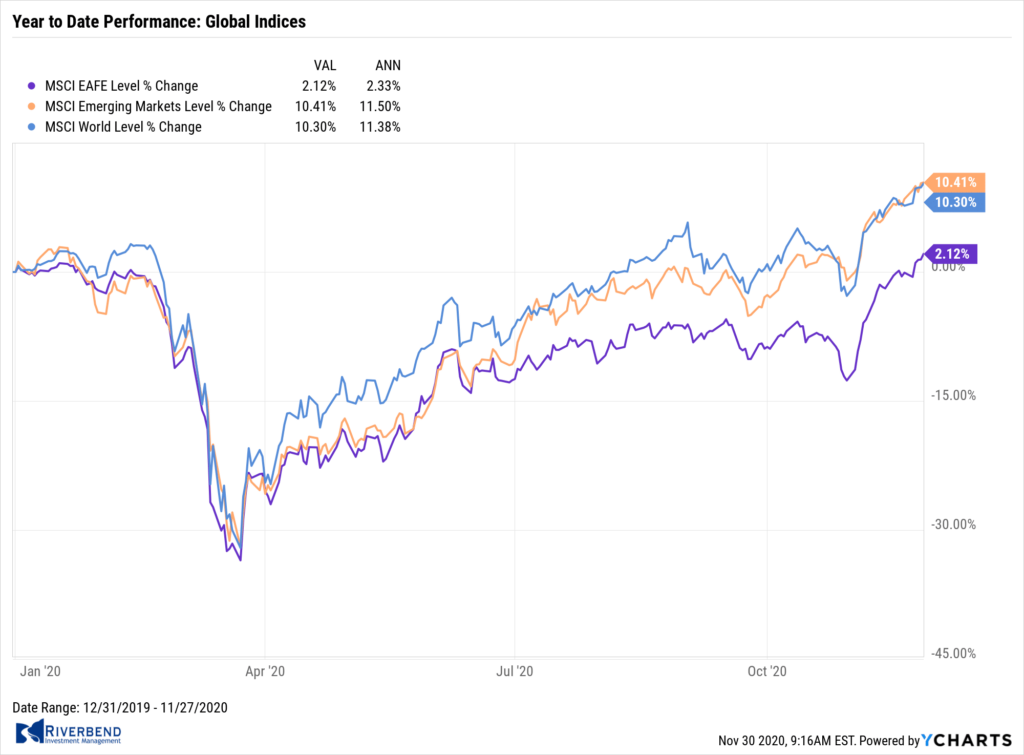
International markets also marched higher with almost all tacking on a fourth consecutive week of gains. Canada’s TSX rose 2.2% and the United Kingdom’s FTSE 100 added 0.3%.
On Europe’s mainland, France’s CAC 40 and Germany’s DAX rose 1.9% and 1.5%, respectively.
In Asia, China’s Shanghai Composite finished the week up 0.9%, while Japan’s Nikkei surged 4.4%.
As grouped by Morgan Stanley Capital International, developed markets rose 1.9% and emerging markets finished up 2.0%.
Commodities: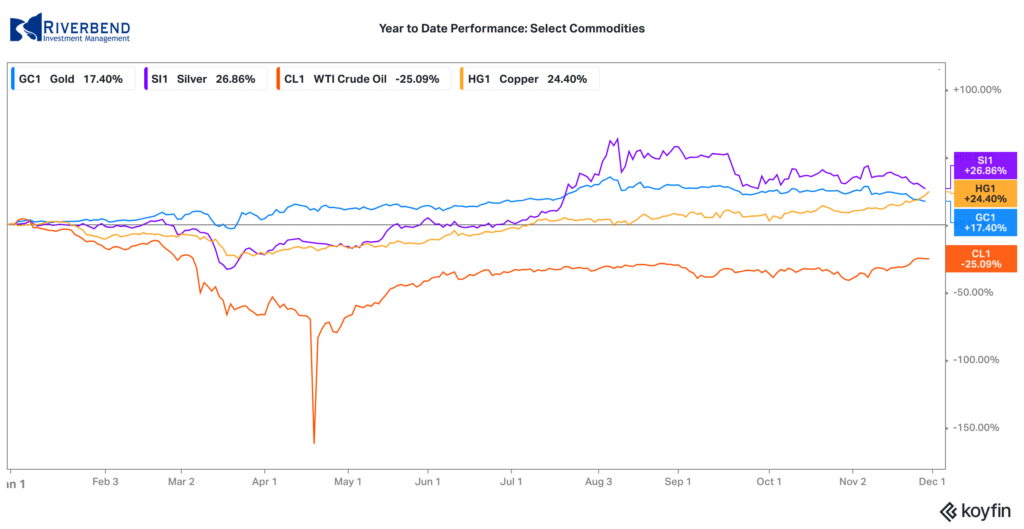
Precious metals continued to sell-off in the face of strength in world equities markets. Gold retreated for a third consecutive week declined -4.5% to $1788.10 per ounce. Similarly, Silver declined -7.1% to $22.64 per ounce.
Oil continued its rally adding over 7.3% finishing the week at $45.53 per barrel for West Texas Intermediate crude.
The industrial metal copper, viewed by some analysts as a barometer of world economic health due to its wide variety of uses, rose for a fourth consecutive week closing up 3.8%.
U.S. Economic News: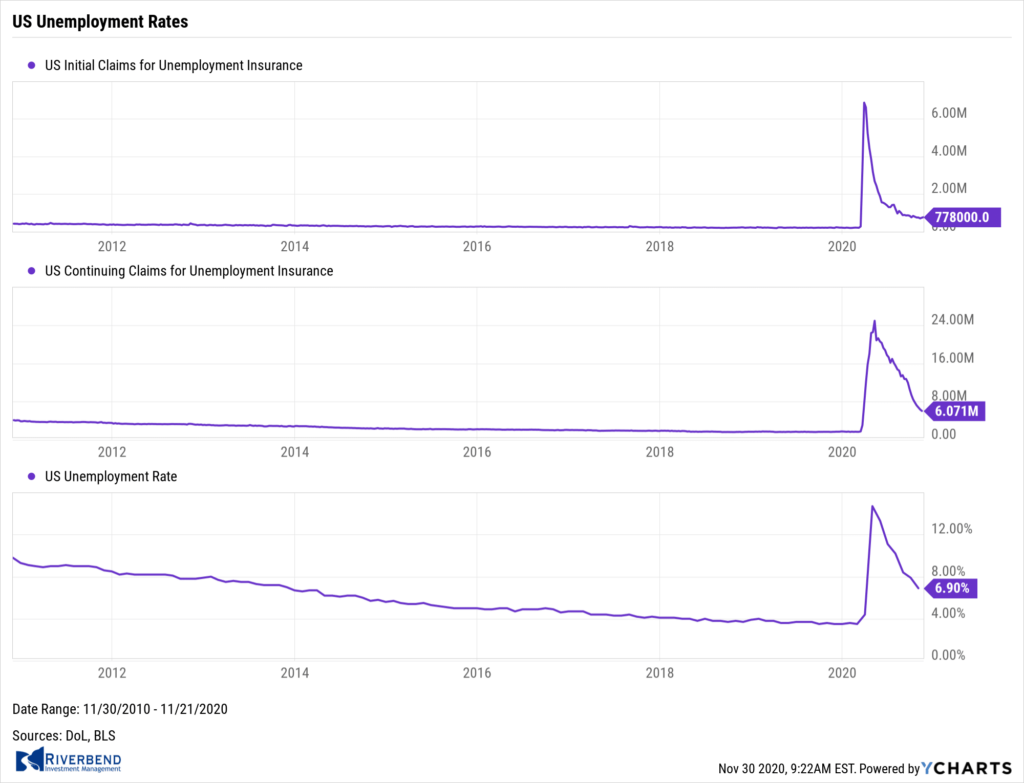
The number of Americans seeking first-time unemployment benefits hit a 5-week high as a resurgence of coronavirus cases triggered more layoffs. The Labor Department reported initial jobless claims increased by a seasonally-adjusted 30,000 to 778,000 last week. Economists had forecast initial jobless claims to total 720,000. It’s the first time new jobless claims have risen two consecutive weeks since July. On the other hand, continuing claims, which count the number of people already receiving benefits, declined by 299,000 to a seasonally-adjusted 6.07 million. That number is at a new pandemic low.
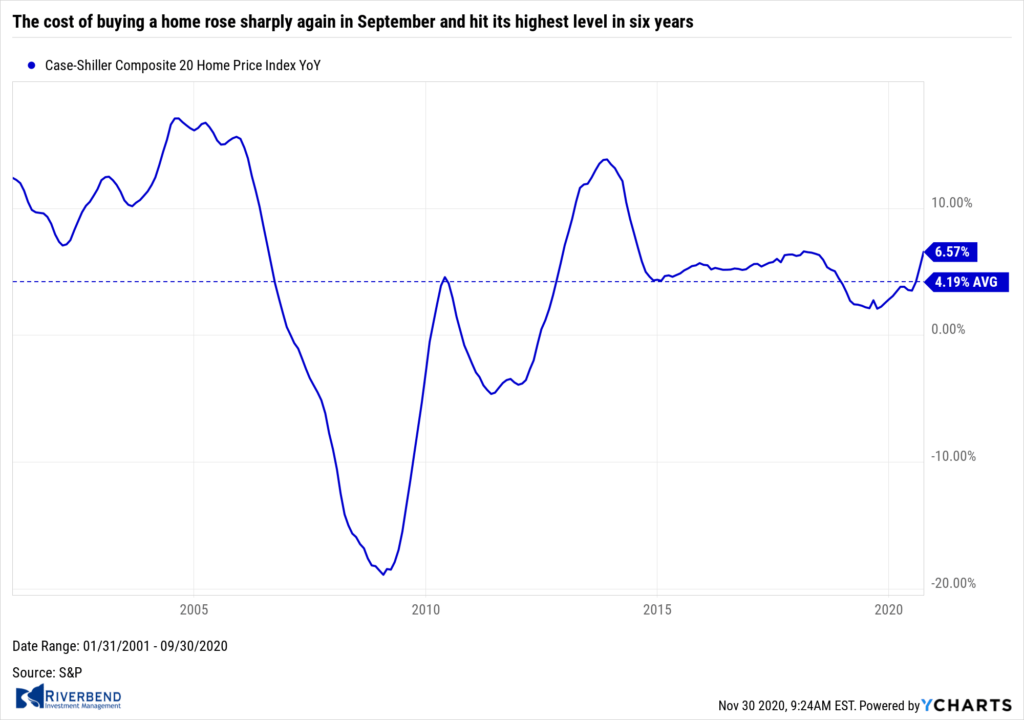 The cost of buying a home rose sharply again in September and hit its highest level in six years, according to S&P CoreLogic. S&P reported its Case-Shiller 20-city home price index rose at a 6.6% annual pace in October, up 1.3% from the prior month. Wall Street economists had forecast a 5.4% increase. A broader measure by Case-Shiller that covers the entire country showed a similarly large 7.0% increase in home prices over the past year, marking the fastest 12-month gain since 2014. On a monthly basis, the Case-Shiller 20-city index rose 1.2% in September. Prices rose in all of the cities tracked by Case-Shiller with the biggest increases taking place in Phoenix, Seattle and San Diego.
Source: Conference Board, Bloomberg
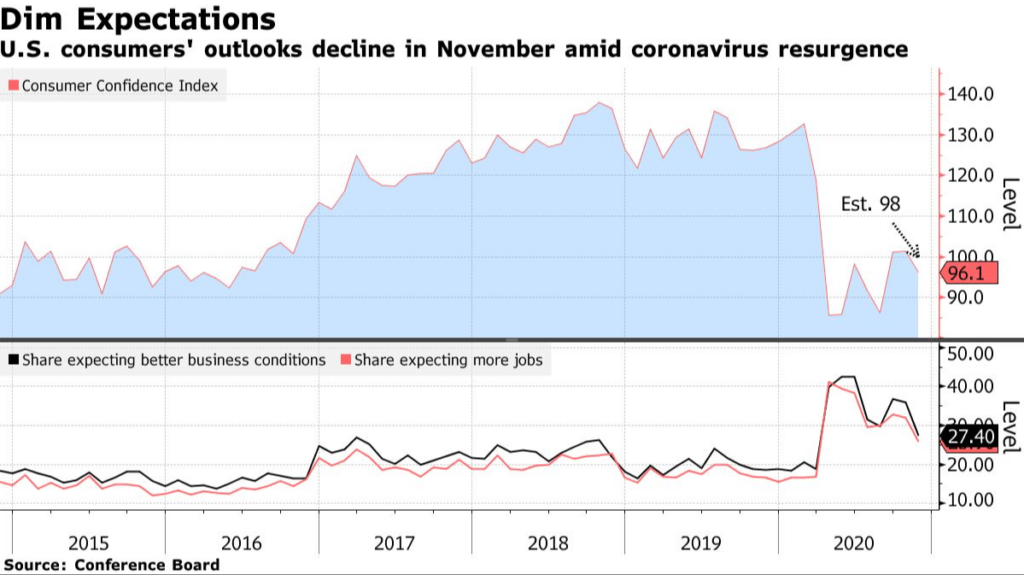
Confidence among the nation’s consumers declined in November following a resurgence in coronavirus cases that spurred some cities and states to reimpose restrictions. The Conference Board reported its index of consumer confidence slipped to 96.1 this month from a revised 101.4 in October. Economists had forecast a decline to 97.3. Confidence remains far below pre-pandemic levels—the index stood at 132.6 before the viral outbreak in February. The reading does not bode well for consumer expectations going into the new year. Lynn Franco, senior director of economic indicators at the board stated, “Heading into 2021, consumers do not foresee the economy, or the labor market, gaining strength.”
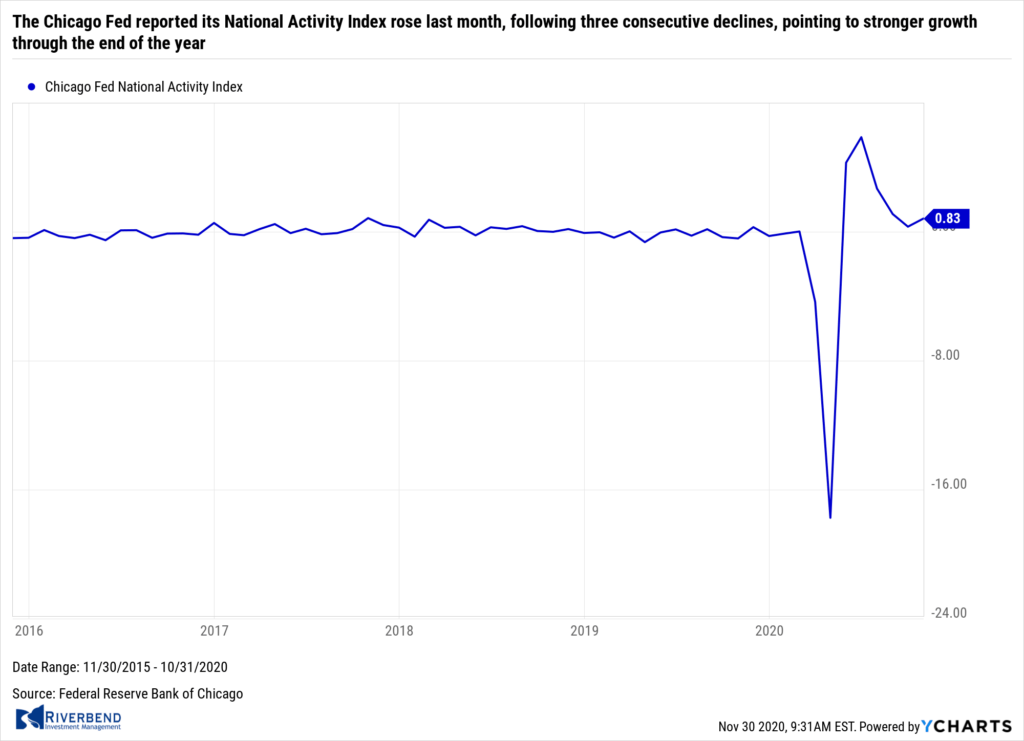 The Chicago Fed reported its National Activity Index rose last month, following three consecutive declines, pointing to stronger growth through the end of the year. The Index rose to 0.83 in October from a revised 0.32 the prior month, and was its first gain in four months. The index is a weighted average of 85 economic indicators. In the details of the report, production-related indicators added 0.36 to the index in October after subtracting 0.10 in the prior month, while employment-related indicators contributed 0.39 in October, up slightly from 0.30 in September. Overall, 61 of the 85 indicators made positive contributions to the index and 54 showed improvement from the prior month.
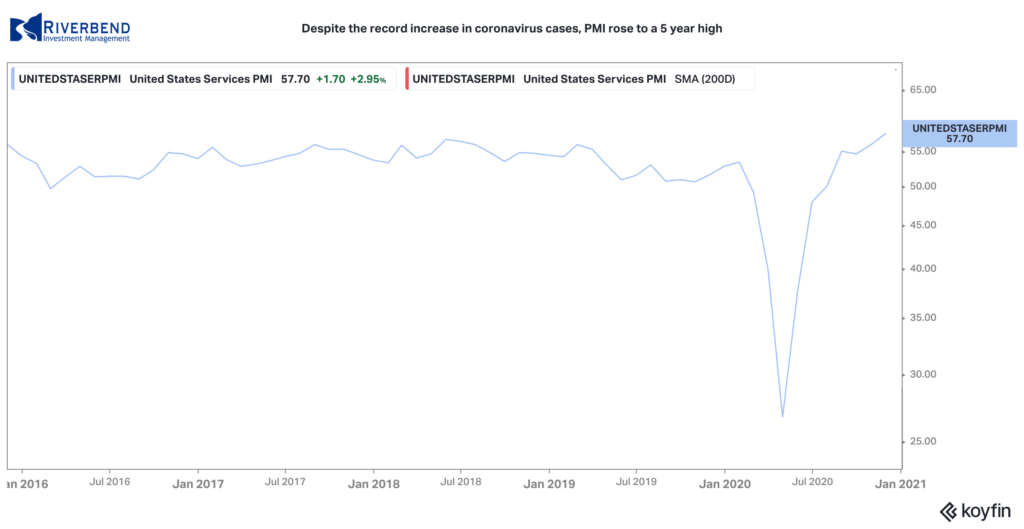 Research firm IHS Markit reported both of its Purchasing Managers’ Indexes (PMIs) for the services and manufacturing sides of the economy rose in November to a five-year high, despite the record increase in coronavirus cases. The flash index for the vast services sector of the U.S. economy rose 1.7 points to 57.7 in November—its biggest increase since March 2015. The index for the smaller manufacturing sector climbed 3.3 points to 56.7. Chris Williamson, chief business economist at IHS Markit stated, “Expectations about the year ahead have surged to the most optimistic for over six years, reflecting the combination of a post-election lift to confidence and encouraging news that vaccines may allow a return to more normal business conditions in the not too distant future.”
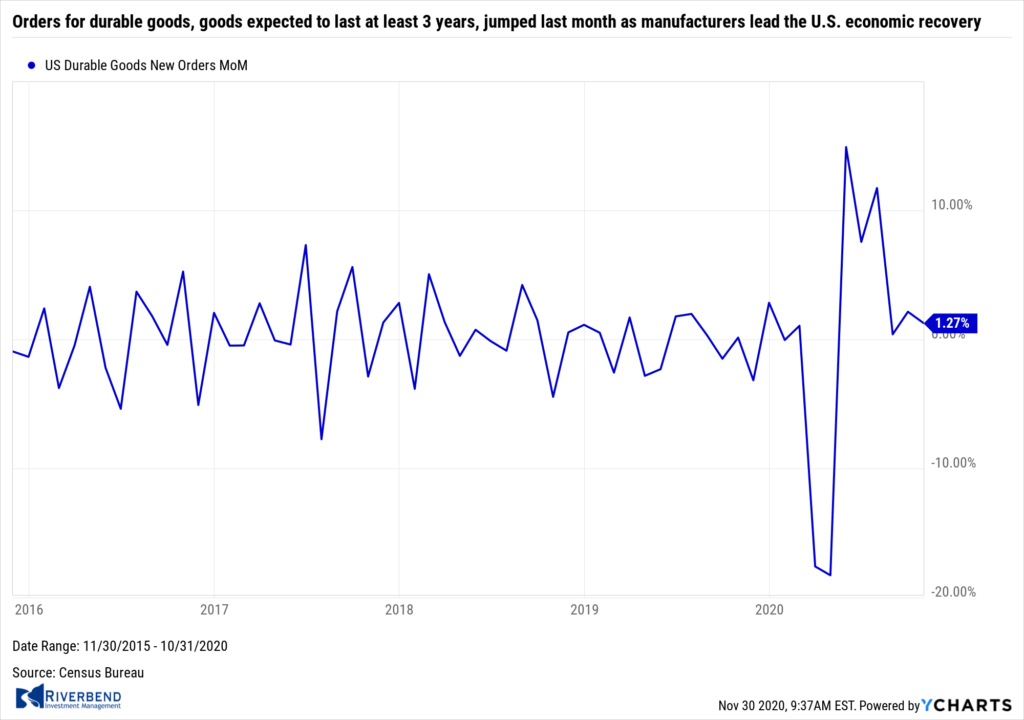 Orders for durable goods, goods expected to last at least 3 years, jumped last month as manufacturers lead the U.S. economic recovery. The Commerce Department reported durable goods orders advanced 1.3% in October. Economists had expected just a 0.5% increase. However, analysts noted the surge in orders was driven primarily by defense spending. If defense is excluded, orders still rose, but by a more modest 0.2%. Core capital goods orders, a key measure of business investment, rose by 0.7% in October. Despite the increase, analysts remain concerned about a resurgence in coronavirus cases. Rubeela Farooqi, chief U.S. economist at High Frequency Economics wrote in a note to clients, “the manufacturing sector remains exposed to surging virus cases that could disrupt supply chains, weigh on demand and slow the pace of rebound going forward.”
Chart of the Week: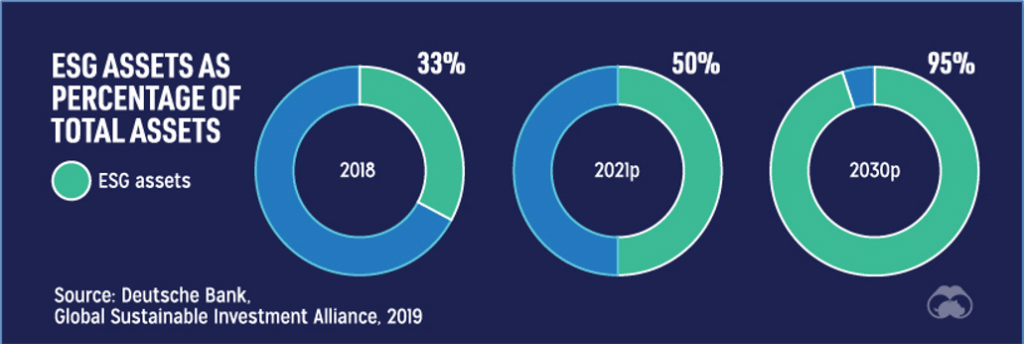
In the past, the performance of their investments was generally all that mattered to most investors. However, a new breed of investors has now put consideration of ‘ESG’ (“Environmental, Social, and Governance’) criteria as a key component.
As Millennials and Generation Z investors continue to increase their economic impact, investment bank Deutsche Bank estimates that by the year 2030, a whopping 95% of all managed assets will incorporate some consideration of ESG factors. Just two years ago, in 2018, that figure was only 33%. (Chart from visualcapitalist.com, data from Deutsche Bank)
Riverbend Indicators Update:

Each week we post notable changes to the various market indicators we follow.
- As a reading of our Bull-Bear Indicator for U.S. Equities (comparative measurements over a rolling one-year timeframe), we remain in Cyclical Bull territory.
- Counting-up of the number of all our indicators that are ‘Up’ for U.S. Equities, the current tally is that four of four are Positive, representing a multitude of timeframes (two that can be solely days/weeks, or months+ at a time; another, a quarter at a time; and lastly, the {typically} years-long reading, that being the Cyclical Bull or Bear status).
Observations:
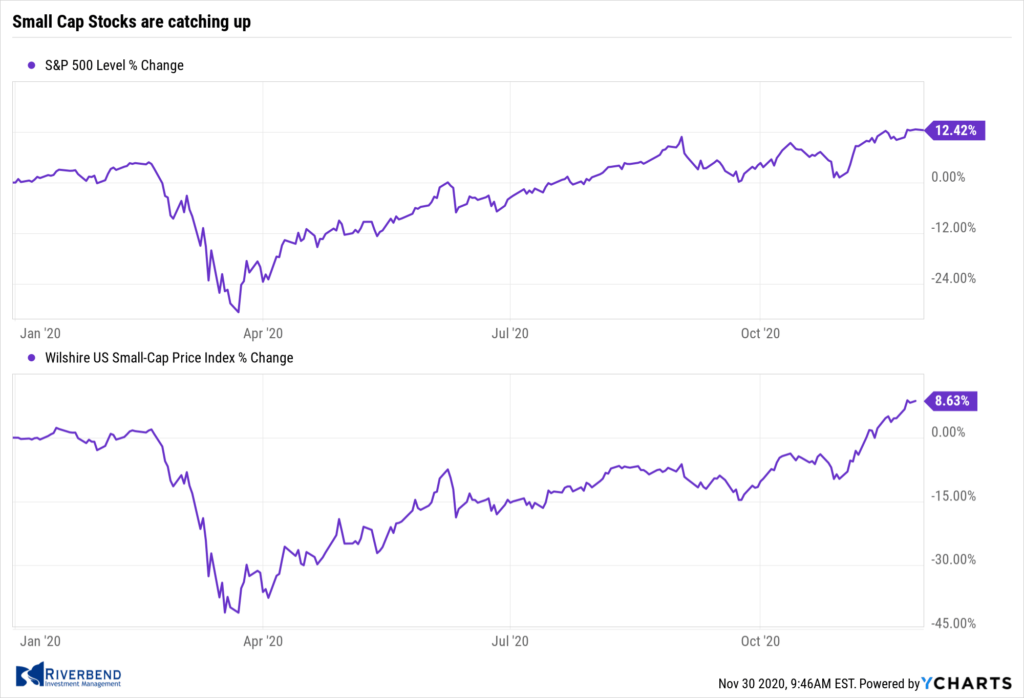
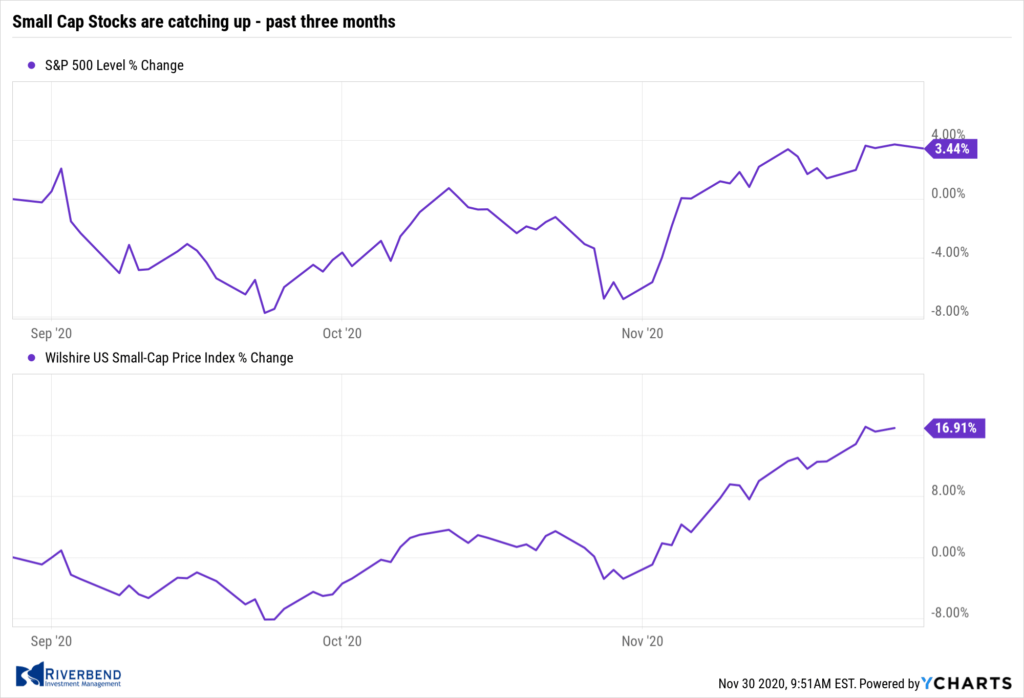
Since the initial declines in March due to COVID, large-cap growth stocks have been leading the market. We are starting to see small-cap stocks play catch up — which is a very good sign. Smaller companies historically show their strongest performance as the economy emerges from a recession.
To me, this is an indication that investors are looking past the current rise in COVID cases and instead are looking forward to a post-COVD world.
The Week Ahead:
Monday:
- Chicago PMI 59.4 exp, 61.1 prior
- U.S. Pending Homes Sales m/m 39.2 exp, 46.5 prior
- China Caixin Manufacturing PMI 53.6 exp, 53.6 prior
Tuesday:
- Eurozone CPI Flash Estimate y/y -0.2% exp, -0.3% prior
- U.S. ISM Manufacturing PMI 57.7 exp, 59.3 prior
- U.S. Construction Spending m/m +0.8% exp, +0.3% prior
Wednesday:
- German Retail Sales m/m +1.1% exp, -2.2% prior
- U.S. ADP Non-Farm Employment Change 500k exp, 365k prior
- China Caixin Services PMI 56.5 exp, 56.8 prior
Thursday:
- Eurozone Retail Sales m/m +0.6% exp, -2.0% prior
- U.S. Unemployment Claims 770k exp, 778k prior
- U.S. ISM Services PMI 56.0 exp, 56.6 prior
Friday:
- Jobs Report
- U.S. Non-Farm Employment Change 500k exp, 638k prior
- U.S. Unemployment Rate 6.8% exp, 6.9% prior
(Sources: All index- and returns-data from Yahoo Finance; news from Reuters, Barron’s, Wall St. Journal, Bloomberg.com, ft.com, guggenheimpartners.com, zerohedge.com, ritholtz.com, markit.com, financialpost.com, Eurostat, Statistics Canada, Yahoo! Finance, stocksandnews.com, marketwatch.com, wantchinatimes.com, BBC, 361capital.com, pensionpartners.com, cnbc.com, CNBC, FactSet.)


