[fusion_builder_container hundred_percent=”no” equal_height_columns=”no” menu_anchor=”” hide_on_mobile=”small-visibility,medium-visibility,large-visibility” class=”” id=”” background_color=”” background_image=”” background_position=”center center” background_repeat=”no-repeat” fade=”no” background_parallax=”none” parallax_speed=”0.3″ video_mp4=”” video_webm=”” video_ogv=”” video_url=”” video_aspect_ratio=”16:9″ video_loop=”yes” video_mute=”yes” overlay_color=”” video_preview_image=”” border_size=”” border_color=”” border_style=”solid” padding_top=”” padding_bottom=”” padding_left=”” padding_right=””][fusion_builder_row][fusion_builder_column type=”1_1″ layout=”1_1″ background_position=”left top” background_color=”” border_size=”” border_color=”” border_style=”solid” border_position=”all” spacing=”yes” background_image=”” background_repeat=”no-repeat” padding_top=”” padding_right=”” padding_bottom=”” padding_left=”” margin_top=”0px” margin_bottom=”0px” class=”” id=”” animation_type=”” animation_speed=”0.3″ animation_direction=”left” hide_on_mobile=”small-visibility,medium-visibility,large-visibility” center_content=”no” last=”no” min_height=”” hover_type=”none” link=””][fusion_text]
U.S. Markets: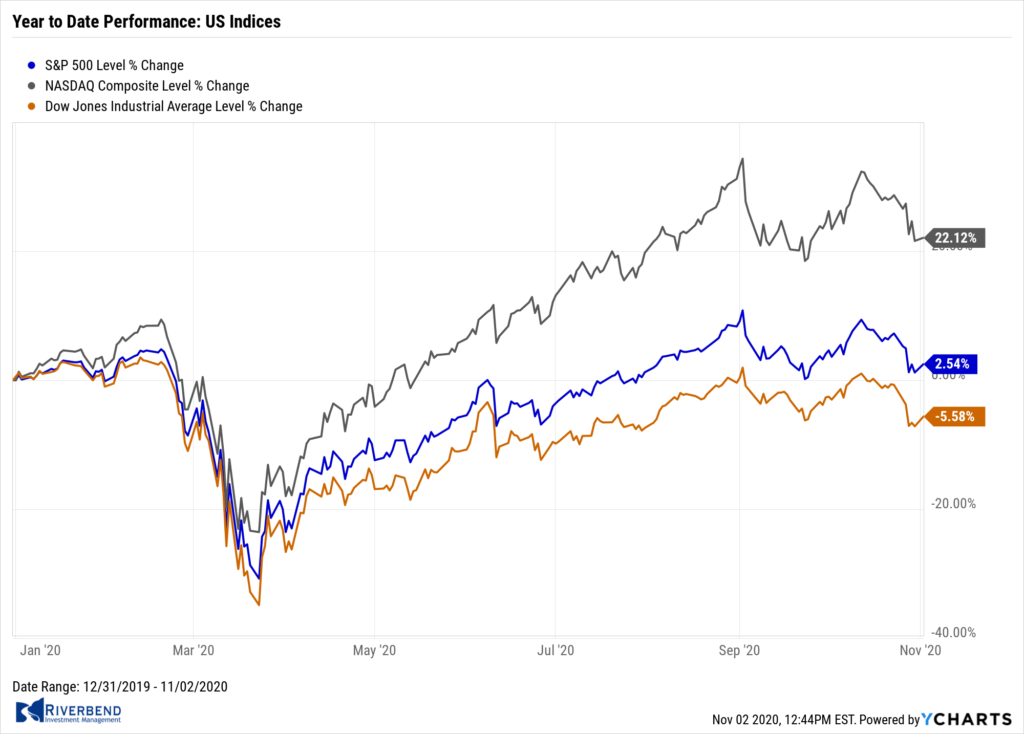
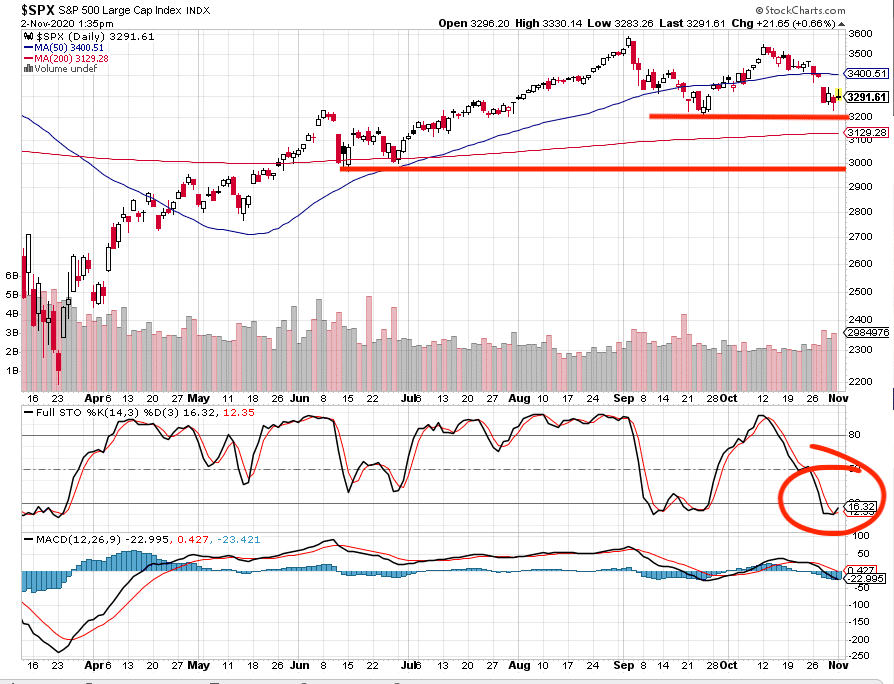
U.S. stocks suffered their worst weekly declines since March, as the resurgence in coronavirus cases and election uncertainty weighed on sentiment.
With the narrow exception of the S&P 500 index, all of the major indexes fell into correction territory, down over 10% from recent highs.
The Dow Jones Industrial Average shed 1,834 points finishing the week at 26,502—a decline of -6.5%. The technology-heavy NASDAQ Composite fell for a second consecutive week, giving up -5.5%.
By market cap, the large cap S&P 500 fell -5.6%, while the mid cap S&P 400 and small cap Russell 2000 fell more, -5.7% and -6.2% respectively.
International Markets: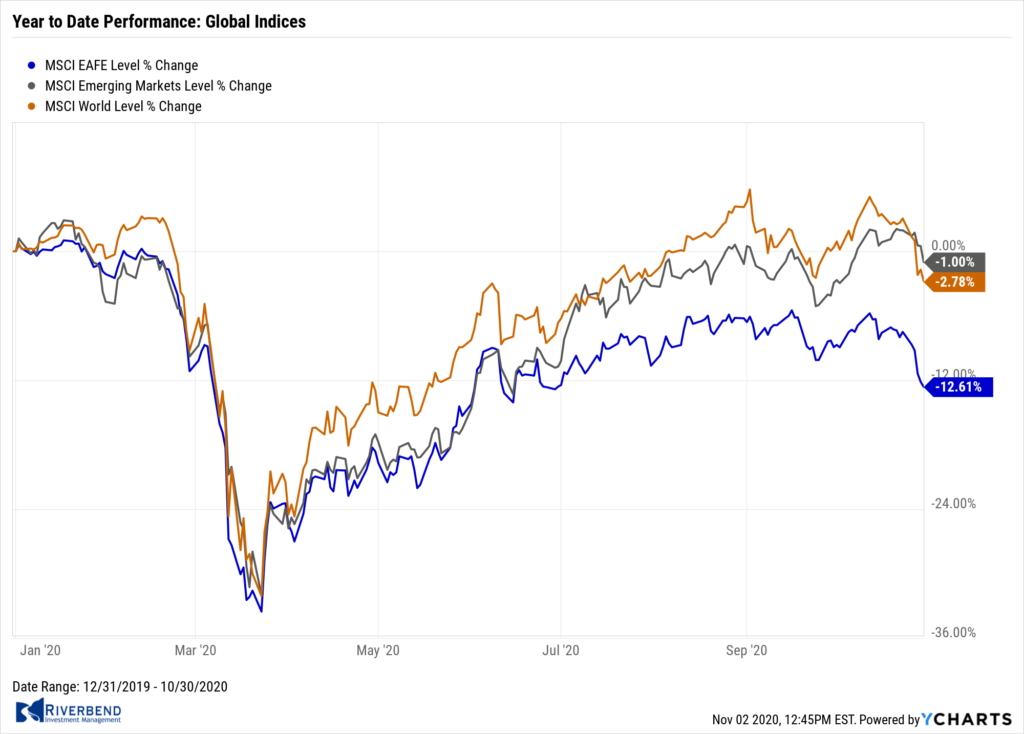
International markets were a sea of red this week. Canada’s TSX gave up -4.4%, while the United Kingdom’s FTSE fell -4.8%.
On Europe’s mainland, France’s CAC 40 shed -6.4% while Germany’s DAX plunged ‑8.6%.
Asia markets fared better; China’s Shanghai Composite declined -1.6% and Japan’s Nikkei retreated ‑2.3%.
As grouped by Morgan Stanley Capital International, developed markets ended down -5.5%, while emerging markets retreated -3.5%.
Commodities: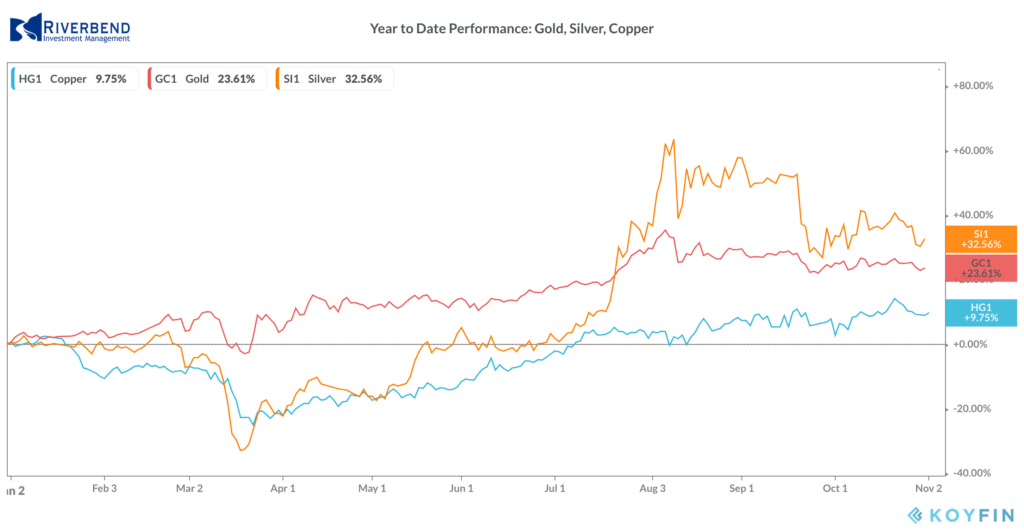
Gold finished down a third week, retreating -1.3% to $1879.90 per ounce, while silver declined -4.2% to $23.65.
Crude oil plunged 10.2% to its lowest closing price since May. West Texas Intermediate crude oil finished the week at $35.79 per barrel.
The industrial metal copper, viewed by some analysts as a barometer of world economic health due to its wide variety of uses, finished the week down -2.6%.
U.S. Economic News:
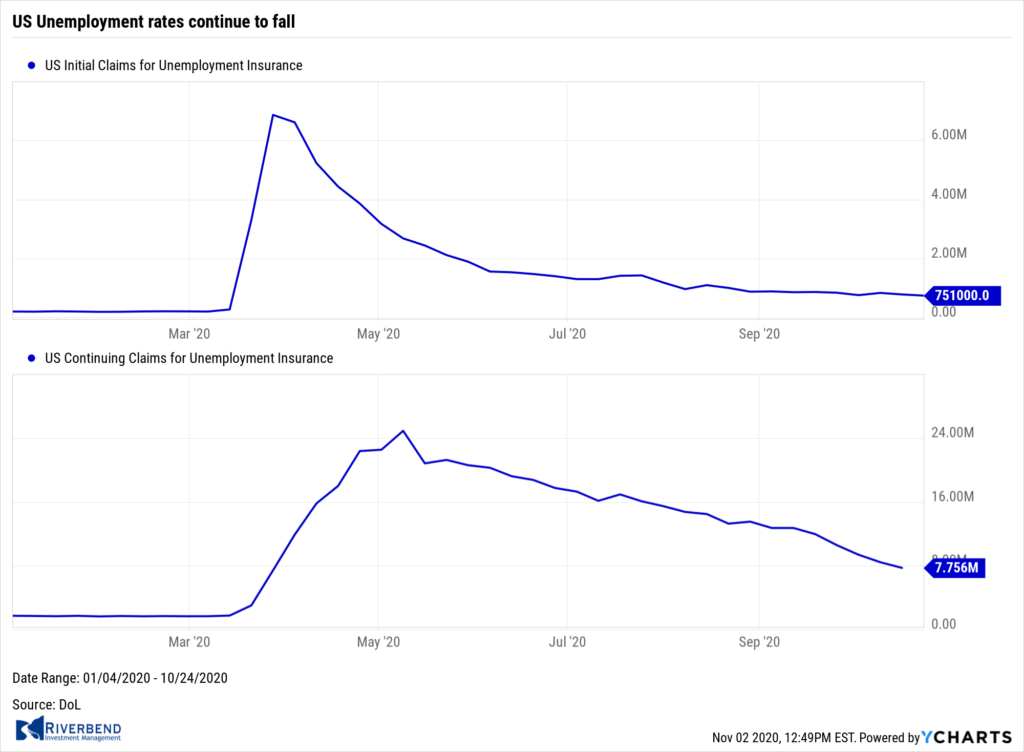 The number of Americans filing for first-time unemployment benefits slipped further in the last week hitting its lowest level since the pandemic began. The Labor Department reported initial jobless claims fell by 40,000 to 751,000 last week. Economists had expected a reading of 770,000. Continuing claims, which counts the number of Americans already receiving benefits fell by 709,000 to a seasonally-adjusted 7.76 million.
Economists remain concerned that rising coronavirus cases will lead people to stay home, causing service industries to begin another round of layoffs. Furthermore, Congress went home for the presidential election without passing additional coronavirus financial relief. Ian Shepherdson, chief economist at Pantheon Macroeconomics wrote, “We think initial claims are more likely to increase over the next month than to fall further.”
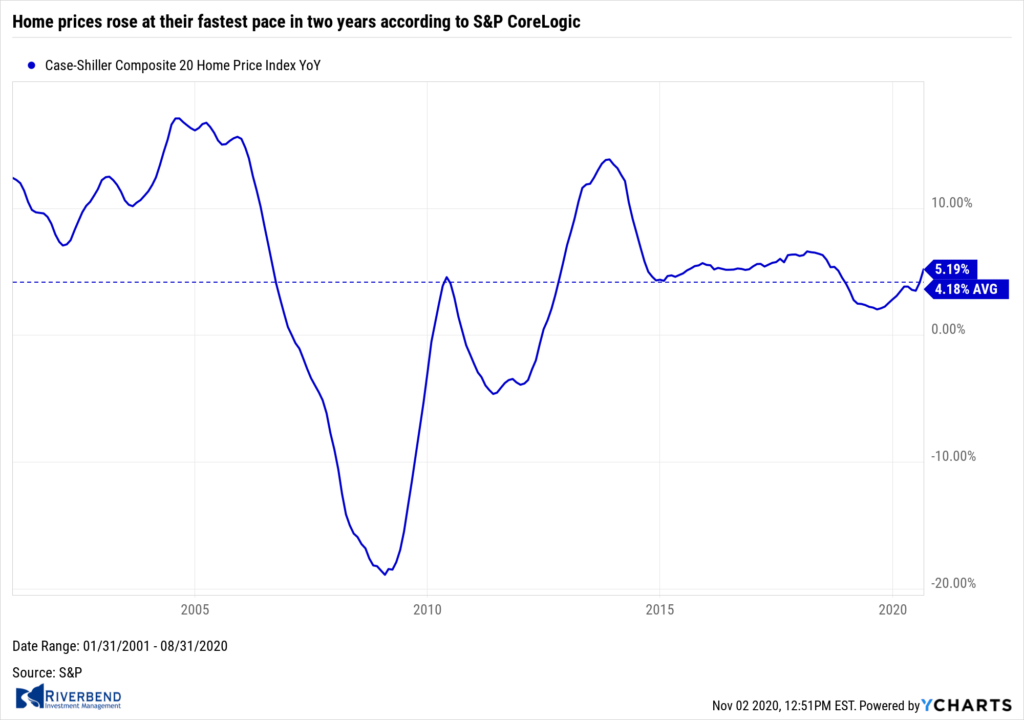 Home prices rose at their fastest pace in two years according to S&P CoreLogic. S&P’s Case-Shiller 20-city price index posted a 5.2% annual price increase in August, up 1.1% from the previous month. The reading was in line with analyst expectations. On a monthly basis, the index increased 0.5% in August. The separate national home price index noted a 5.7% increase in home prices across the U.S. over the past year. This is the fastest pace in more than two years.
Furthermore, the price increases were broad-based. All of the 19 large cities tracked by Case-Shiller posted increases in housing prices in August. Phoenix once again led all other markets nationwide with a 9.9% annual price gain in August, followed by Seattle with an 8.5% increase and San Diego with a 7.6% increase. Phoenix has been the strongest housing market for 15 months.
The housing market generally slows in the fall, but the latest data from the Census Bureau shows sales are still running well ahead of last year’s pace. New home sales ran at a seasonally-adjusted annual rate of 959,000. While that number is a 3.5% drop from August, new home sales are up 32% compared to the same time last year. Last month, the government had reported that new-home sales had exceeded an annual rate of 1 million for the first time since 2006. Economists had expected new home sales to increase to a median pace of 1.033 million.
By region, new homes plunged 28.9% in the Northeast, followed by smaller declines in the Midwest and the South. Comparatively, the West was the only region to experience an increase in sales with a 3.8% jump. The median sales price in July was $326,800, up from August’s median price. The inventory of new homes was 284,000, representing a 3.6-month supply at the current pace of sales. A 6-month supply is considered the benchmark for a balanced market.
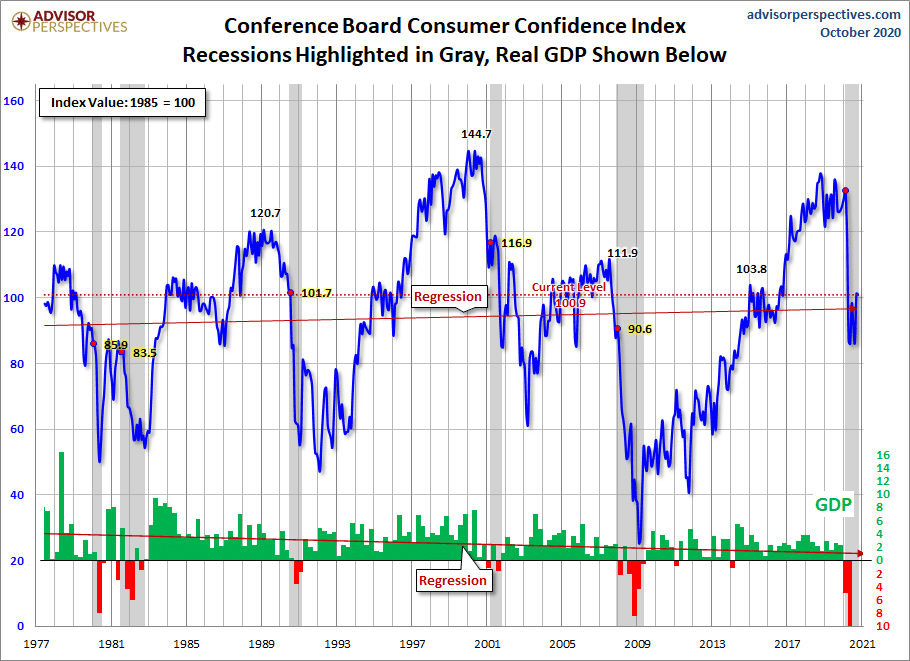 Confidence among the nation’s consumers waned this month, reflecting less optimism about the jobs market and the U.S. economy in the next six months amid a new outbreak of coronavirus cases. The Conference Board reported its index of consumer confidence dipped a point to 100.3 this month. The decline was slightly bigger than Wall Street had expected.
In the details, the sub-index that gauges how consumers feel right now about the economy rose to 104.6 from 98.9 in the prior month. However, another gauge that assesses how Americans view the next six months, the so-called ‘future expectations index’, declined to 98.4 from 102.9. The latest survey was largely compiled before the sharp upturn in coronavirus cases this month, suggesting confidence could suffer an even bigger decline in November.
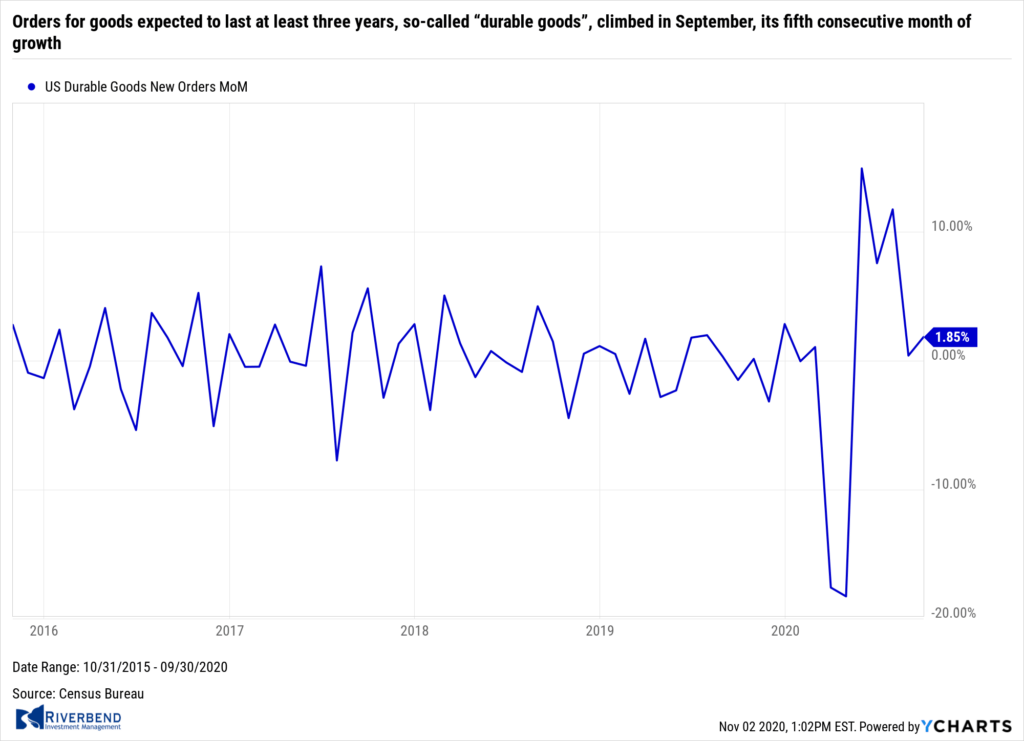 Orders for goods expected to last at least three years, so-called “durable goods”, climbed 1.9% in September, its fifth consecutive month of growth. The increase in orders last month easily topped Wall Street expectations. Economists had forecast a 0.2% decline. Orders for new cars and trucks increased 1.5% last month, snapping back from sharp decline in August.
Outside of transportation, orders were mixed. Core orders, a category which excludes the volatile transportation and defense segments, increased 1% last month and exceeded pre-crisis levels for the second month in a row. Paul Ashworth, chief U.S. economist wrote in a note to clients, “The 1.9% rise in durable goods orders in September demonstrates that the economic recovery isn’t entirely dependent on consumers, with business equipment investment recording a swift bounce back to pre-pandemic levels.”
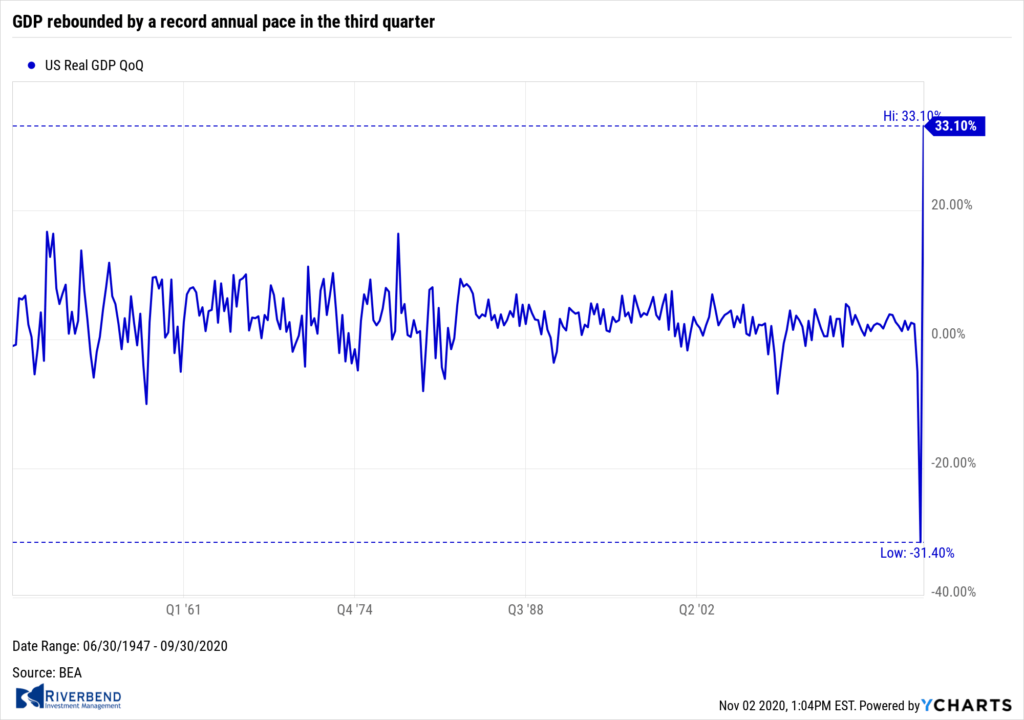 GDP rebounded by a record annual pace in the third quarter, but a resurgence of coronavirus cases threatens to derail the recovery. The Commerce Department reported GDP soared 33.1% in the third quarter as the economy began to recover from the coronavirus pandemic. The widely expected snapback in gross domestic product was given a huge assist by trillions of dollars in government stimulus. However, most of the aid has now expired and another surge in coronavirus cases threatens to force the economy back into lockdown.
The increase in third-quarter GDP matched the forecasts of economists. However, economists are expecting a much weaker 4th quarter. Paul Ashworth, chief economist at Capital Economics wrote in a note to clients, “With coronavirus infections hitting a record high in recent days and any additional fiscal stimulus unlikely to arrive until, at the earliest, the start of next year, further progress will be much slower.”
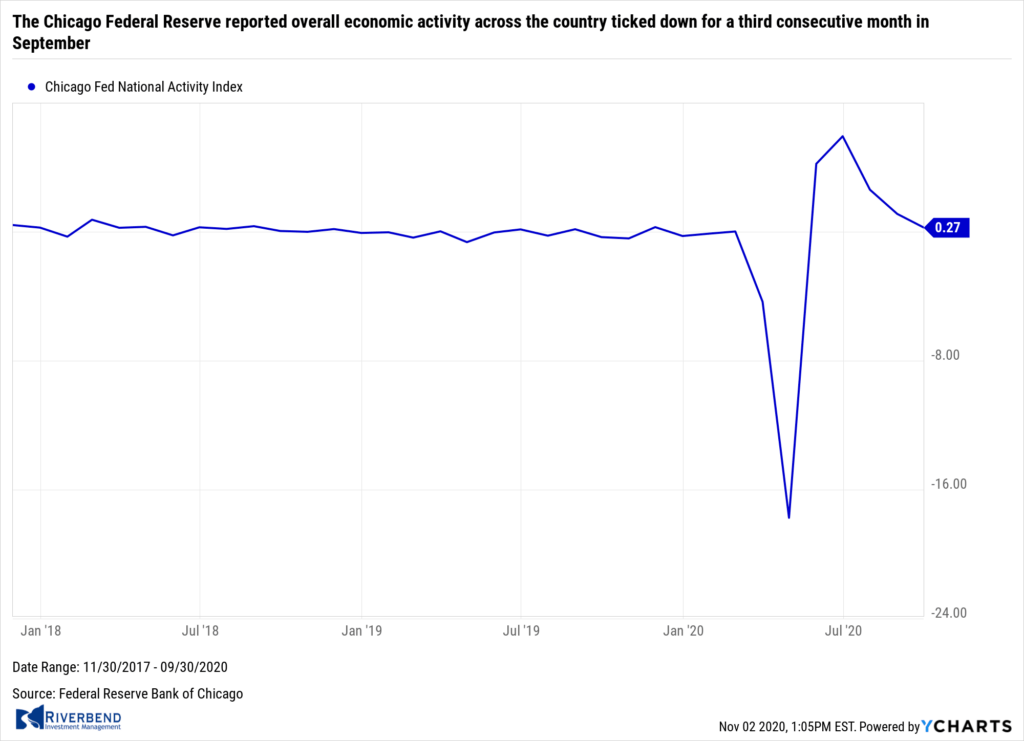 The Chicago Federal Reserve reported overall economic activity across the country ticked down for a third consecutive month in September. The Chicago Fed’s National Activity Index ticked down 0.84 point to 0.27 last month. The index’s three-month moving average, smoothed to iron-out the monthly volatility, moved down to 1.33 from 3.22 in August. A zero value of the index indicates the national economy is expanding at its historic trend rate of growth. Of the 85 economic indicators the Chicago Fed examines, fifty made positive contributions to the index. The third straight month of weaker readings fits with worries that the economy is faltering even as additional fiscal support for the economy remains blocked in Congress.
Chart of the Week: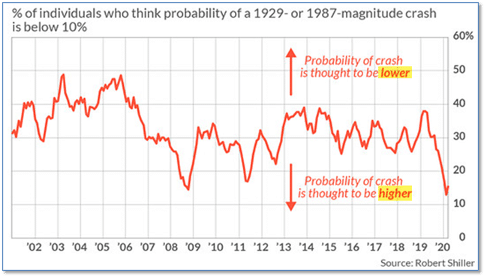
Given the market turmoil of this past week, investors might find solace in this item. Nobel prize-winning Yale University Finance Professor Dr. Robert Shiller reports that most investors now expect the U.S. stock market to crash like it did in 1929 or 1987.
Why is that good news? Because “most investors” are usually wrong at critical turning points. He has documented that extremes in investor sentiment are actually pretty reliable contrarian indicators.
In September, Shiller’s U.S. Crash Confidence Index remained near a record low of 15% (meaning 85% of respondents believe that the probability of an impending crash to be greater than 10%). The last time readings were so extreme was in the depths of the 2008-2009 bear market, before the record-breaking ten year bull market kicked off. However, Shiller cautions that most extremes in bearish sentiments are also accompanied by low market valuations, and that is not the case this time as valuations remain high.
Riverbend Indicators Update:

Each week we post notable changes to the various market indicators we follow.
- As a reading of our Bull-Bear Indicator for U.S. Equities (comparative measurements over a rolling one-year timeframe), we remain in Cyclical Bull territory.
- Counting-up of the number of all our indicators that are ‘Up’ for U.S. Equities, the current tally is that three of four are Positive, representing a multitude of timeframes (two that can be solely days/weeks, or months+ at a time; another, a quarter at a time; and lastly, the {typically} years-long reading, that being the Cyclical Bull or Bear status).
Observations:
Our intermediate and long term indicators are still flashing buy signals, however, our short-term indicator did flash a sell signal early last week.
While most of Wall Street is taking a “wait and see” approach to the market/election, investors were surprised when the hope of a stimulus package before the election evaporated.
The combination of investors not wanting to buy before the election and algorithms negatively reacting to the stimulus news, created a 5% drop in the S&P 500 index and put the market into oversold conditions.
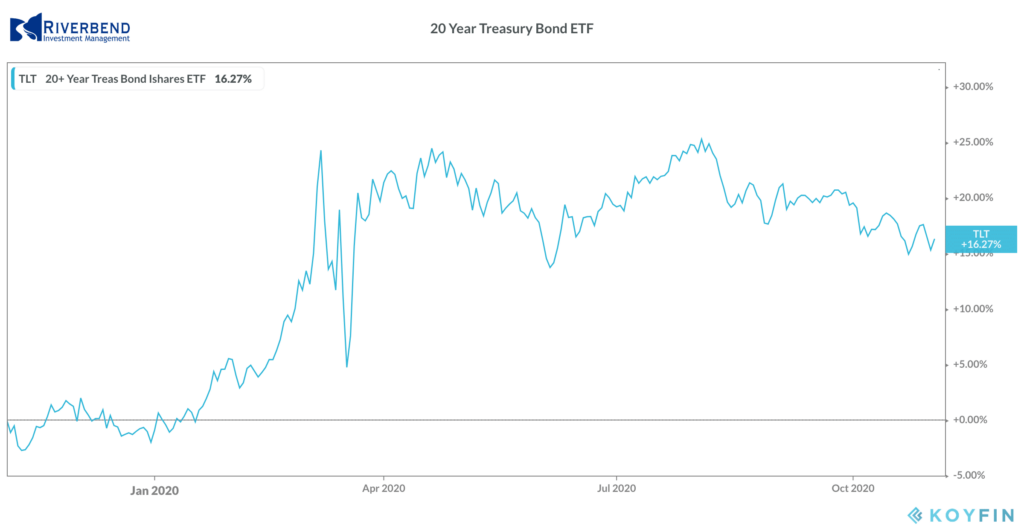
Of note: safe-haven asset classes, like gold and US bonds, did not see a spike in values — indicating that last week’s market volatility was more of an “I don’t want to buy” vs “I want to sell” type of event.

The Week Ahead:
Monday:
- U.S. ISM Manufacturing PMI 55.6 exp, 55.4 prior
- Reserve Bank of Australia Rate Decision 0.10% exp, 0.25% prior
Tuesday:
- U.S. Election
- U.S. Factory Orders m/m +0.8%, +0.7% prior
- U.S. IBD/TIPP Economic Optimism 56.3 exp, 55.2 prior
Wednesday:
- U.S. ISM Services PMI 57.4 exp, 57.8 prior
- U.S. ADP Non-Farm Employment Change 690k exp, 749k prior
Thursday:
- U.S. Prelim Unit Labor Costs q/q -10.0% exp, +9.0% prior
- U.S. Unemployment Claims 746k exp, 751k prior
- FOMC Statement and Press Conference
Friday:
- Jobs Report U.S. Non-farm Payroll Employment Change +600k exp, +661k exp prior
- U.S. Unemployment Rate 7.7% exp, 7.9% prior
- U.S. Average Hourly Earnings m/m +0.2% exp, +0.1% prior
[/fusion_text][/fusion_builder_column][/fusion_builder_row][/fusion_builder_container]


