[fusion_builder_container hundred_percent=”no” equal_height_columns=”no” menu_anchor=”” hide_on_mobile=”small-visibility,medium-visibility,large-visibility” class=”” id=”” background_color=”” background_image=”” background_position=”center center” background_repeat=”no-repeat” fade=”no” background_parallax=”none” parallax_speed=”0.3″ video_mp4=”” video_webm=”” video_ogv=”” video_url=”” video_aspect_ratio=”16:9″ video_loop=”yes” video_mute=”yes” overlay_color=”” video_preview_image=”” border_size=”” border_color=”” border_style=”solid” padding_top=”” padding_bottom=”” padding_left=”” padding_right=””][fusion_builder_row][fusion_builder_column type=”1_1″ layout=”1_1″ background_position=”left top” background_color=”” border_size=”” border_color=”” border_style=”solid” border_position=”all” spacing=”yes” background_image=”” background_repeat=”no-repeat” padding_top=”” padding_right=”” padding_bottom=”” padding_left=”” margin_top=”0px” margin_bottom=”0px” class=”” id=”” animation_type=”” animation_speed=”0.3″ animation_direction=”left” hide_on_mobile=”small-visibility,medium-visibility,large-visibility” center_content=”no” last=”no” min_height=”” hover_type=”none” link=””][fusion_text]
U.S. Markets: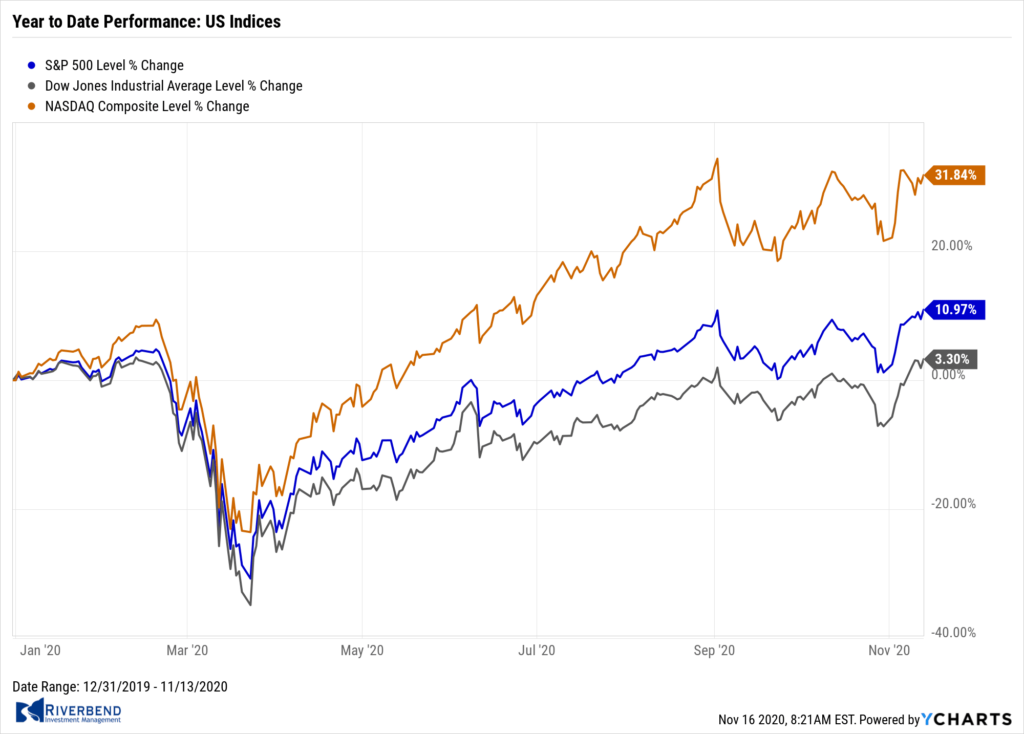
Most of the major U.S. benchmarks added to last week’s sharp gains, bolstered by positive news of a coronavirus vaccine candidate from Pfizer. All of the major indexes touched all-time intraday highs in early trading Monday but surrendered much of their gains by midweek.
The Dow Jones Industrial Average and the smaller cap benchmarks performed the best, while value shares easily outperformed their growth counterparts. The Dow Jones Industrial Average added over 1,100 points finishing the week at 29,480, a gain of 4.1%.
The technology-heavy NASDAQ Composite retraced some of last week’s surge and was the only U.S.equity index to finish down for the week at ‑0.6%.
By market cap, the large cap S&P 500 added 2.2%, while the mid cap S&P 400 and small cap Russell 2000 added 4.3% and 6.1%, respectively.
International Markets: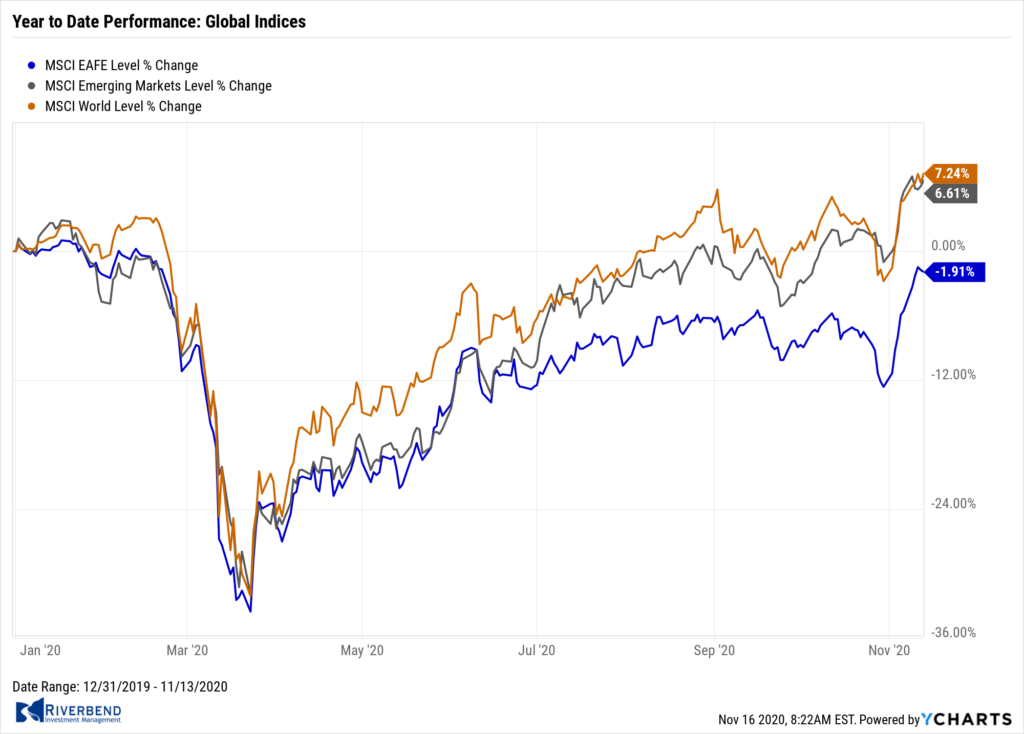
Like the U.S., almost all major international equity markets finished the week in the green. Canada’s TSX added 2.4%, while the United Kingdom’s FTSE 100 vaulted 6.9%.
On Europe’s mainland France’s CAC 40 surged 8.5%, while Germany’s DAX gained 4.8%.
In Asia, China’s Shanghai Composite ticked down -0.1% while Japan’s Nikkei rose 4.4%.
As grouped by Morgan Stanley Capital International, developed markets rallied 4.8% while emerging markets added 0.8%.
Commodities: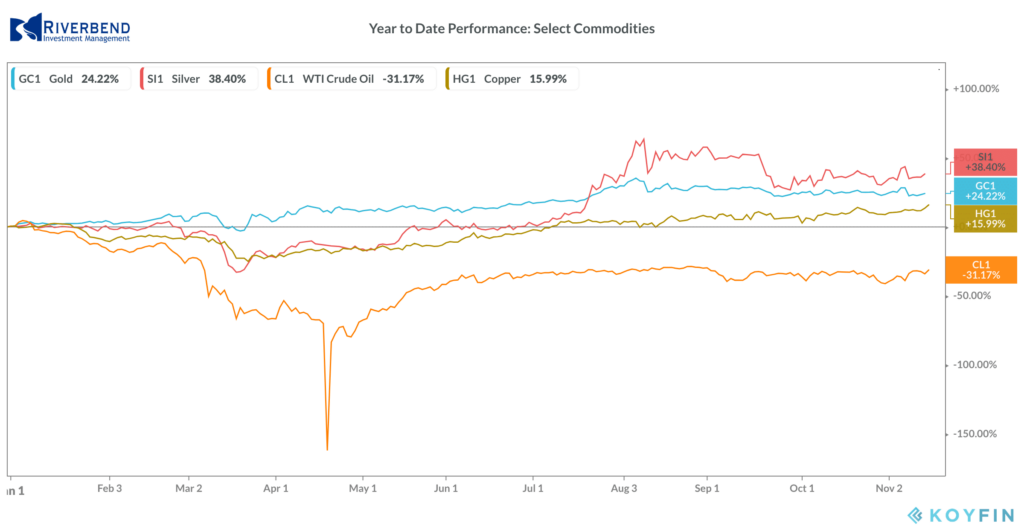
Precious metals retreated in the face of the strength in equities markets. Gold retraced most of last week’s gain falling -3.4% to $1886.20 per ounce. Silver declined -3.5% to $24.77 per ounce.
Oil, on the other hand, had its second week of strong gains. West Texas Intermediate crude oil surged 8.1% to $40.13 per barrel.
The industrial metal copper, viewed by some analysts as a barometer of world economic health due to its wide variety of uses, finished the week up 0.8%.
U.S. Economic News: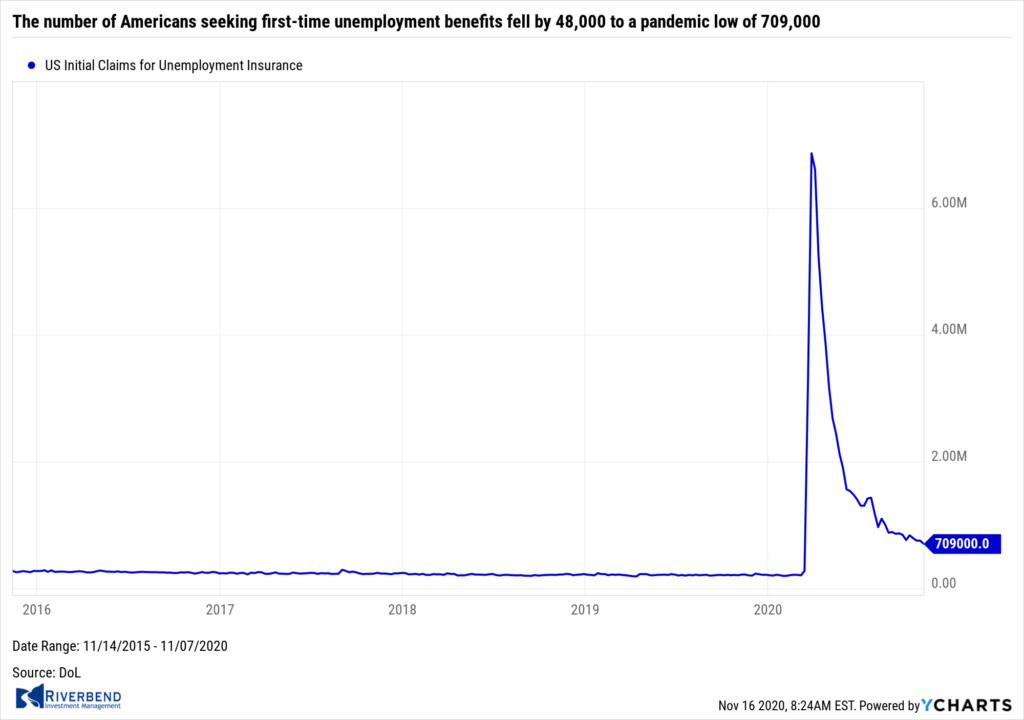
The number of Americans seeking first-time unemployment benefits fell by 48,000 to a pandemic low of 709,000. The reading suggests the record outbreak in coronavirus cases has not made a significant dent in the labor market. At least not yet. The decline was bigger than expected—economists had forecast a decline to 731,000.
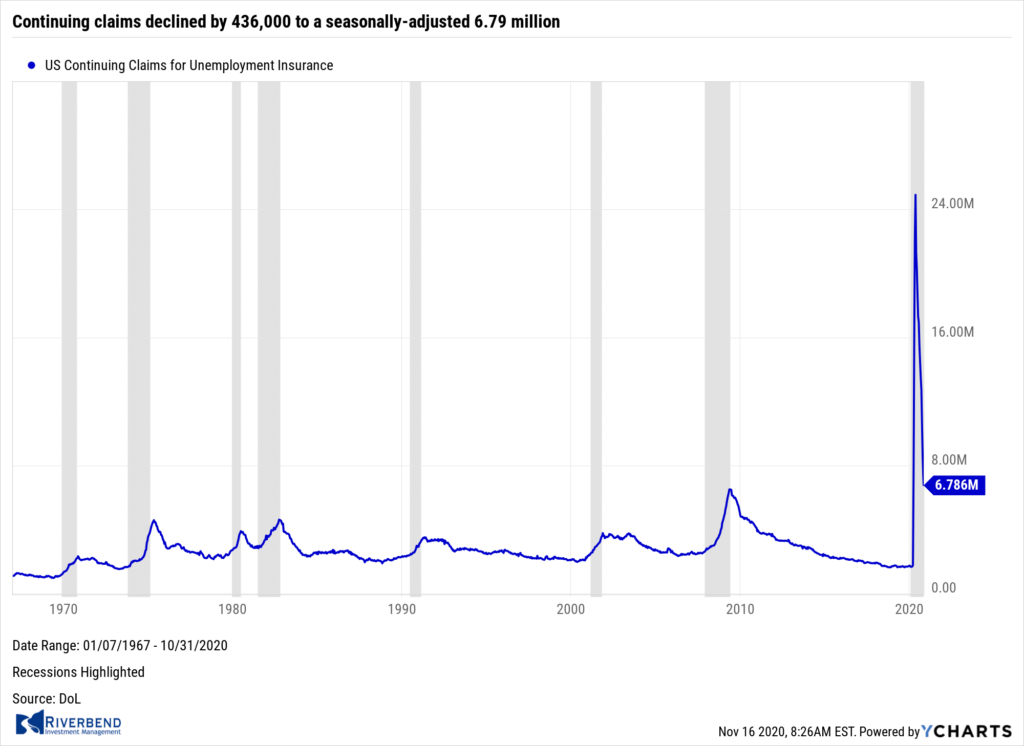 Continuing claims, which counts the number of Americans already collecting benefits, declined by 436,000 to a seasonally-adjusted 6.79 million. Robert Frick, corporate economist at Navy Federal Credit Union stated, “This is the fourth week in a row unemployment claims have fallen, and while the pace is slow, we are seeing the jobs market clawing its way back.”
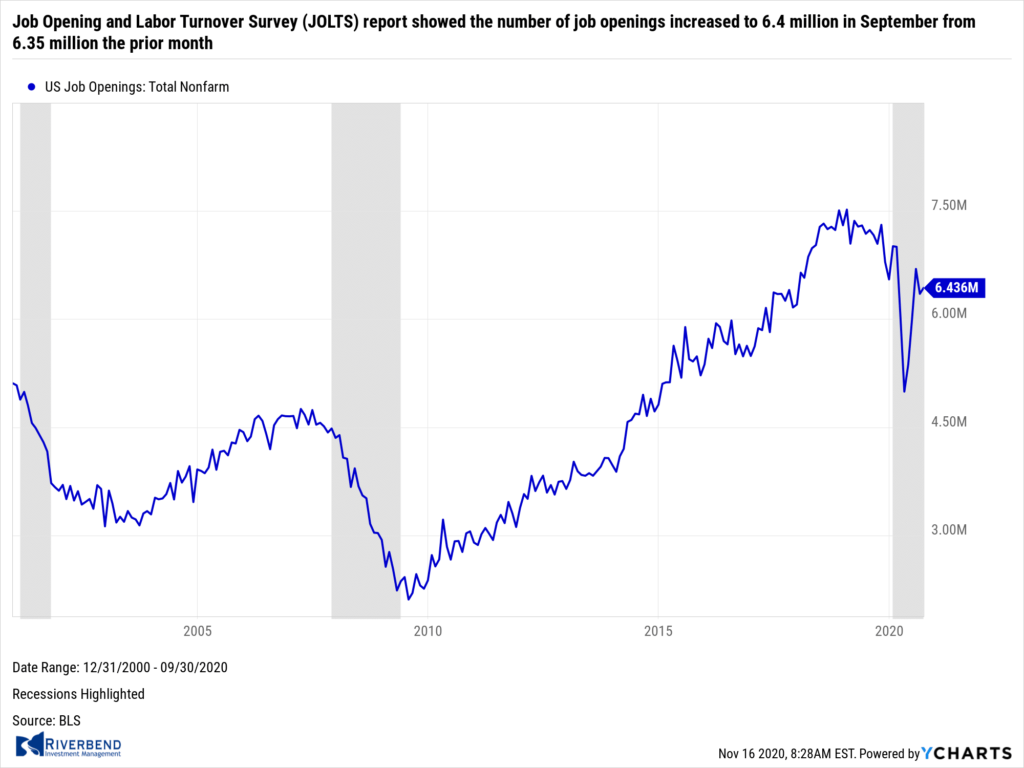 The Bureau of Labor Statistics reported its Job Opening and Labor Turnover Survey (JOLTS) report showed the number of job openings increased to 6.4 million in September from 6.35 million the prior month. While job openings are back to pre-crisis levels, the U.S. economy is still missing some 10 million jobs that existed before the pandemic struck in March.
The pace of hiring also appears to have returned to normal, but even if that’s the case, it will take many months to recover most of the lost jobs. Some 5.87 million people were hired in September, down a bit from 5.95 million in August. Hiring had jumped to as high as 7.2 million in May when the economy reopened.
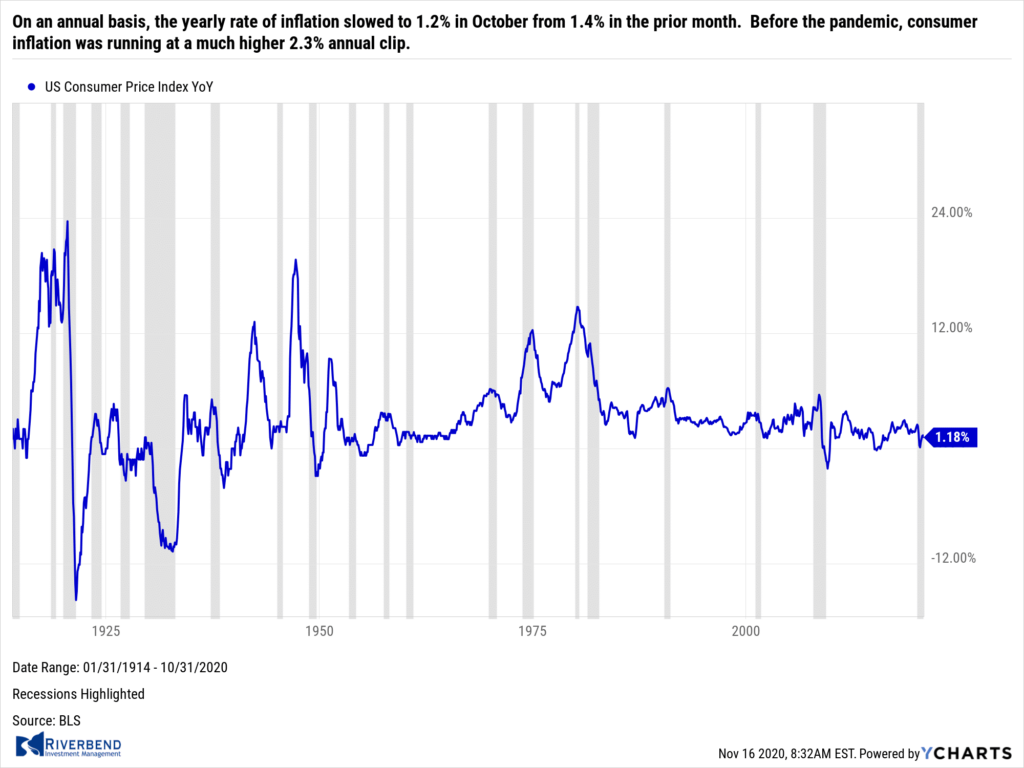 Prices at the consumer level remained unchanged in October according to the Bureau of Labor Statistics (BLS). Economists had expected a 0.1% increase. The cost of living had risen sharply over a fourth-month span from June to September, but it seems to have been mostly just “catch-up” after a steep decline in prices early in the coronavirus pandemic. On an annual basis, the yearly rate of inflation slowed to 1.2% in October from 1.4% in the prior month. Before the pandemic, consumer inflation was running at a much higher 2.3% annual clip.
In the report, the cost of staples such as groceries and electricity rose slightly in October, but those increases were offset by price declines for gasoline, car insurance, clothing, home furnishings and medical care. Core CPI, which excludes the often-volatile food and energy categories, was also unchanged in October. Over the past year the core rate of consumer inflation has risen 1.6%, a tick down from the previous month.
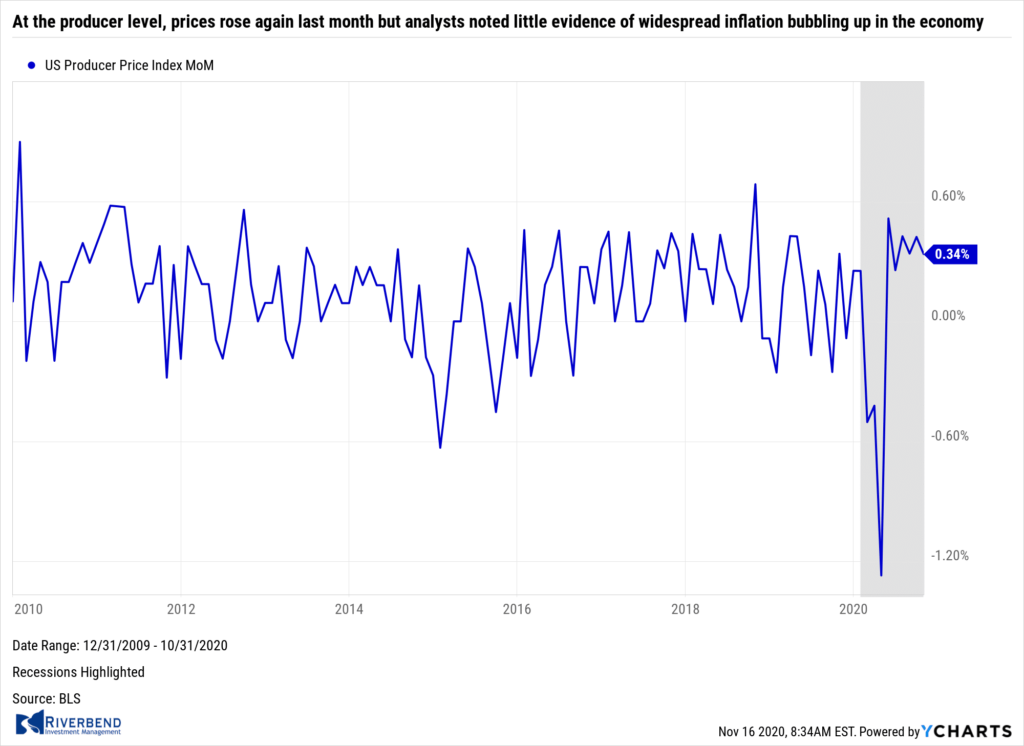 At the producer level, prices rose again last month but analysts noted little evidence of widespread inflation bubbling up in the economy. The BLS reported its Producer Price Index (PPI) advanced 0.3% in October—its sixth consecutive increase since the economy reopened in May. Economists had expected a 0.2% increase. The increase in producer prices over the past year ticked up to 0.5% from 0.4%.
The index had been growing at a 2% annual pace in January, shortly before the pandemic took hold. In the report, the rising cost of food such as vegetables, meat, chicken and eggs was the biggest contributor to the increase in wholesale prices last month, the government said. They accounted for about three-fourths of the 0.5% increase in the cost of goods. The cost of services advanced a smaller 0.2% and was largely centered on transportation. Core PPI increased 0.2% last month. The core rate has risen just 0.8% in the past 12 months.
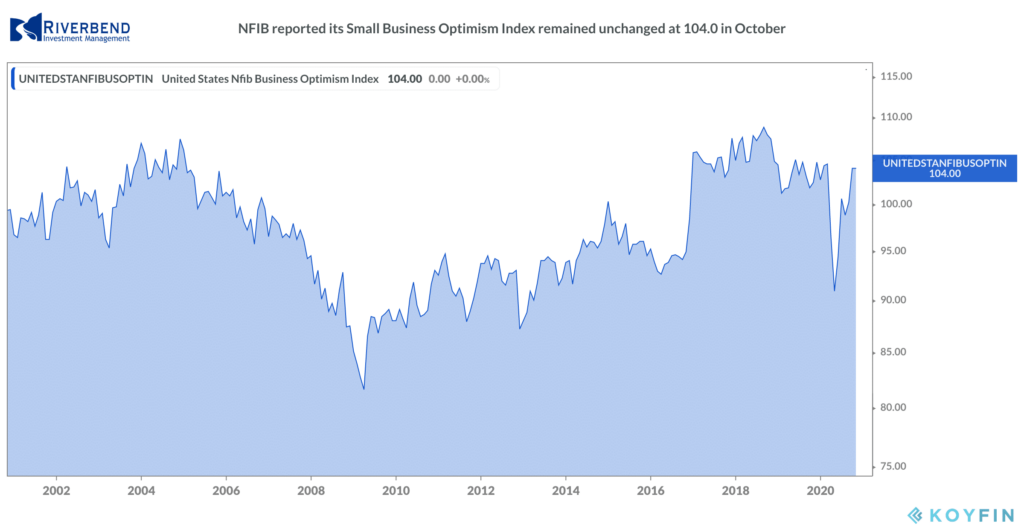 The National Federation of Independent Business (NFIB) reported its Small Business Optimism Index remained unchanged at 104.0 in October, but uncertainty about future business conditions hit its highest level since November 2016. The cautious level of optimism was evident in the index’s subcomponents, with four improving, five declining, and one remaining unchanged. Profits improved again in October and many small businesses expect sales to pick up in the next several months.
Some companies are also restocking goods, hiring more workers and even planning to increase investment. The coronavirus still poses the biggest risk given the record increase in cases that could trigger more government limits on business. Even a partial reinstatement of restrictions could be harmful, especially since the federal program that provided struggling small businesses with a financial lifeline came to an end in July.
Chart of the Week: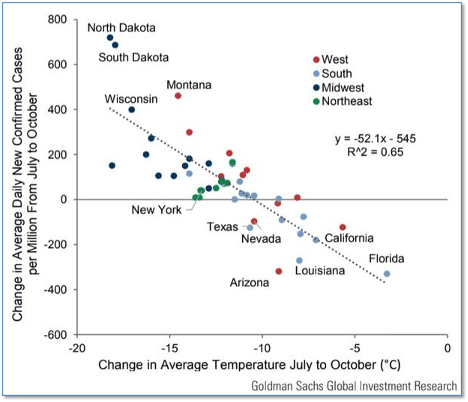
We all know that the flu comes and goes with the seasons. We even call the flu “seasonal” and expect it to rear its ugly head about this time annually.
What if the COVID-19 virus is similar? What if it, too, rises and falls with the seasons?
Goldman Sachs Global Investment Research group took temperature data from NOAA and NASA, and COVID-19 data from Johns Hopkins University, and found a very distinct correlation between the current rise in COVID-19 cases in some parts of the country, and the change in temperature since July (when Covid-19 cases had reached a low).
The chart above shows that those areas whose average temperatures have fallen by 10 degrees or more since July have experienced a rise in COVID-19 cases, while those areas with lesser temperature changes have not.
The relationship is fairly linear (R2 value of 0.65) with a greater drop in temperature (e.g., Wisconsin, Montana, the Dakotas) being associated strongly with a greater increase in COVID‑19 cases, whereas a smaller change in temperature (e.g., Florida, California, Louisiana) is associated strongly with an actual drop in daily cases. If this relationship is validated by further research, the implications for public health management of the virus are immense.
Riverbend Indicators Update:

Each week we post notable changes to the various market indicators we follow.
- As a reading of our Bull-Bear Indicator for U.S. Equities (comparative measurements over a rolling one-year timeframe), we remain in Cyclical Bull territory.
- Counting-up of the number of all our indicators that are ‘Up’ for U.S. Equities, the current tally is that four of four are Positive, representing a multitude of timeframes (two that can be solely days/weeks, or months+ at a time; another, a quarter at a time; and lastly, the {typically} years-long reading, that being the Cyclical Bull or Bear status).
Observations:
From time to time, I like to post an update on our CAPE readings.
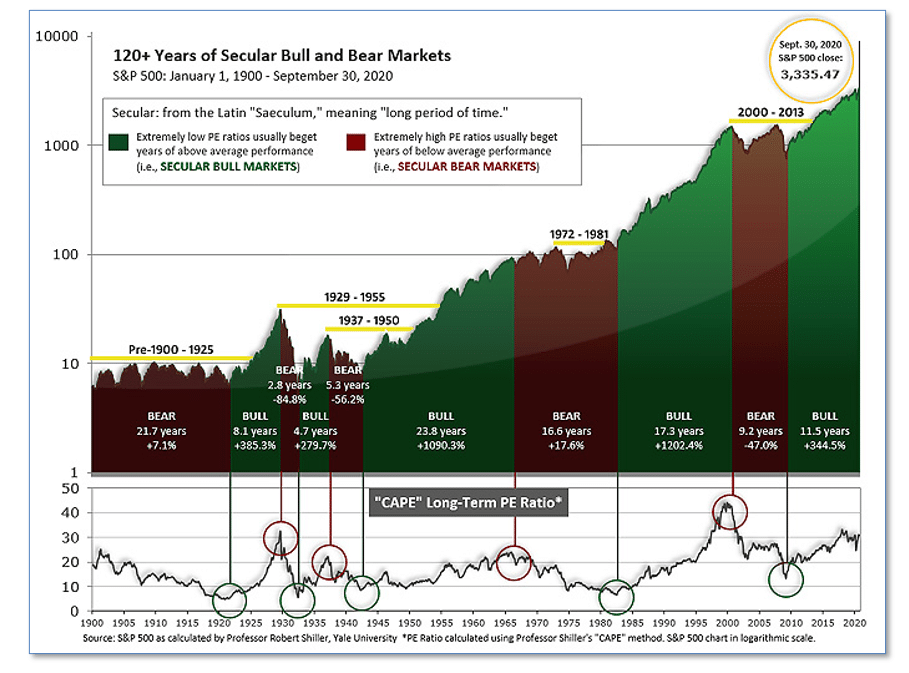
The long-term valuation of the market is commonly measured by the Cyclically Adjusted Price to Earnings ratio, or “CAPE”, which smooths-out shorter-term earnings swings in order to get a longer-term assessment of market valuation.
A CAPE level of 30 is considered to be the upper end of the normal range, and the level at which further PE-ratio expansion comes to a halt (meaning that further increases in market prices only occur as a general response to earnings increases, instead of rising “just because”). The market was recently at that level.
Of course, a “mania” could come along and drive prices higher – much higher, even – and for some years to come. Manias occur when valuation no longer seems to matter, and caution is thrown completely to the wind – as buyers rush in to buy first, and ask questions later.
Two manias in the last century – the “Roaring Twenties” of the 1920s, and the “Tech Bubble” of the late 1990s – show that the sky is the limit when common sense is overcome by a blind desire to buy. But, of course, the piper must be paid, and the following decade or two were spent in Secular Bear Markets, giving most or all of the mania-gains back.
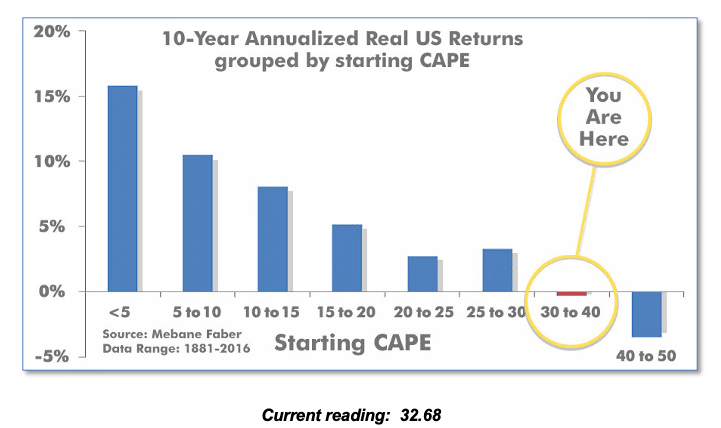
The CAPE is now at 32.68, up from the prior week’s 31.99. Since 1881, the average annual return for all ten-year periods that began with a CAPE in the 30-40 range has been slightly negative
Note: We do not use CAPE as an official input into our methods.
However, if history is any guide – and history is typically ‘some’ kind of guide – it’s always good to simply know where we are on the historic continuum, where that may lead, and what sort of expectations one may wish to hold in order to craft an investment strategy that works in any market ‘season’ … whether current one, or one that may be ‘coming soon’.
In our research, we have found that buy and hold investment strategies do not perform well during periods where a high CAPE level is present. Adaptive strategies based on relative strength, however, tends to do very well during these periods.
The Week Ahead:
Monday:
- U.S. Empire State Manufacturing Index 13.9 exp, 10.5 prior
Tuesday:
- Retail U.S. Core Retail Sales m/m +0.6% exp, +1.5% prior
- U.S. Retail Sales m/m +0.5% exp, +1.9% prior
- U.S. Industrial Production m/m +1.1% exp, -0.6% prior
- U.S. NAHB Housing Market Index 85 exp, 85 prior
Wednesday:
- U.S. Building Permits 1.57 mln exp, 1.55 mln prior
- U.S. Housing Starts 1.45 mln, 1.42 mln prior
Thursday:
- U.S. Philly Fed Manufacturing Index 22.0 exp, 32.3 prior U
- .S. Unemployment Claims 716k exp, 709k prior
- U.S. CB Leading Index m/m +0.7% exp, +0.7% prior
- U.S. Existing Home Sales 6.45 mln exp, 6.54 mln
Friday:
- UK Retail Sales m/m -0.4% exp, +1.5% prior
[/fusion_text][/fusion_builder_column][/fusion_builder_row][/fusion_builder_container]


