[fusion_builder_container hundred_percent=”no” equal_height_columns=”no” menu_anchor=”” hide_on_mobile=”small-visibility,medium-visibility,large-visibility” class=”” id=”” background_color=”” background_image=”” background_position=”center center” background_repeat=”no-repeat” fade=”no” background_parallax=”none” parallax_speed=”0.3″ video_mp4=”” video_webm=”” video_ogv=”” video_url=”” video_aspect_ratio=”16:9″ video_loop=”yes” video_mute=”yes” overlay_color=”” video_preview_image=”” border_size=”” border_color=”” border_style=”solid” padding_top=”” padding_bottom=”” padding_left=”” padding_right=””][fusion_builder_row][fusion_builder_column type=”1_6″ spacing=”” center_content=”no” link=”” target=”_self” min_height=”” hide_on_mobile=”small-visibility,medium-visibility,large-visibility” class=”” id=”” hover_type=”none” border_size=”0″ border_color=”” border_style=”solid” border_position=”all” box_shadow=”no” box_shadow_blur=”0″ box_shadow_spread=”0″ box_shadow_color=”” box_shadow_style=”” background_type=”single” gradient_start_position=”0″ gradient_end_position=”100″ gradient_type=”linear” radial_direction=”center” linear_angle=”180″ background_color=”” background_image=”” background_image_id=”” background_position=”left top” background_repeat=”no-repeat” background_blend_mode=”none” animation_type=”” animation_direction=”left” animation_speed=”0.3″ animation_offset=”” filter_type=”regular” filter_hue=”0″ filter_saturation=”100″ filter_brightness=”100″ filter_contrast=”100″ filter_invert=”0″ filter_sepia=”0″ filter_opacity=”100″ filter_blur=”0″ filter_hue_hover=”0″ filter_saturation_hover=”100″ filter_brightness_hover=”100″ filter_contrast_hover=”100″ filter_invert_hover=”0″ filter_sepia_hover=”0″ filter_opacity_hover=”100″ filter_blur_hover=”0″ last=”no”][/fusion_builder_column][fusion_builder_column type=”2_3″ layout=”1_1″ background_position=”left top” background_color=”” border_size=”” border_color=”” border_style=”solid” border_position=”all” spacing=”yes” background_image=”” background_repeat=”no-repeat” padding_top=”” padding_right=”” padding_bottom=”” padding_left=”” margin_top=”0px” margin_bottom=”0px” class=”” id=”” animation_type=”” animation_speed=”0.3″ animation_direction=”left” hide_on_mobile=”small-visibility,medium-visibility,large-visibility” center_content=”no” last=”no” min_height=”” hover_type=”none” link=””][fusion_text]
U.S. Markets: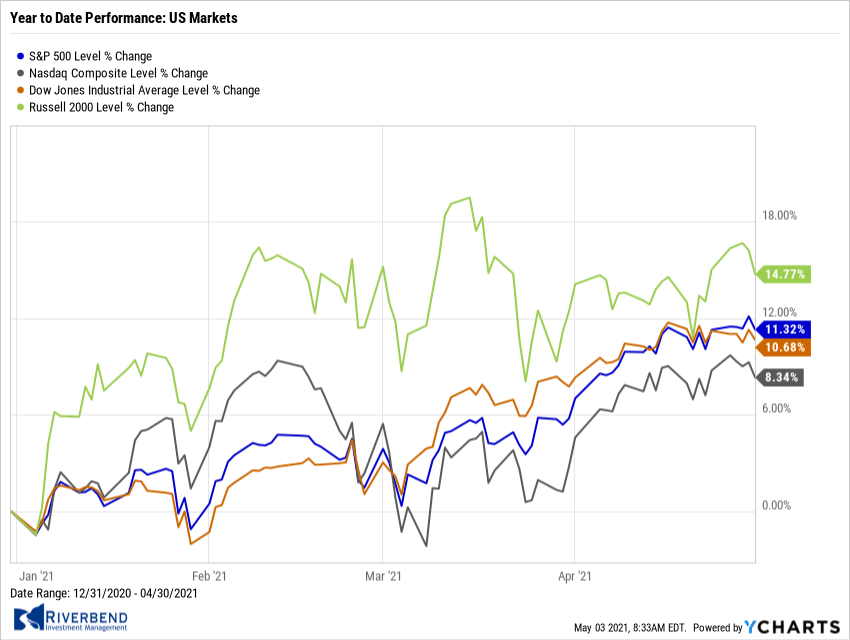
The major U.S. indexes ended the week mostly lower, but the S&P 500, Nasdaq Composite, and the S&P MidCap indexes all hit new highs before surrendering their gains late in the week.
The Dow Jones Industrial Average shed 169 points to finish the week at 33,874, a decline of -0.5%.
The technology-heavy NASDAQ Composite closed lower for a second week, giving up -0.4%.
By market cap, the large cap S&P 500 finished flat, while the mid cap S&P 400 retreated -0.7% and the small cap Russell 2000 declined -0.2%.
International Markets: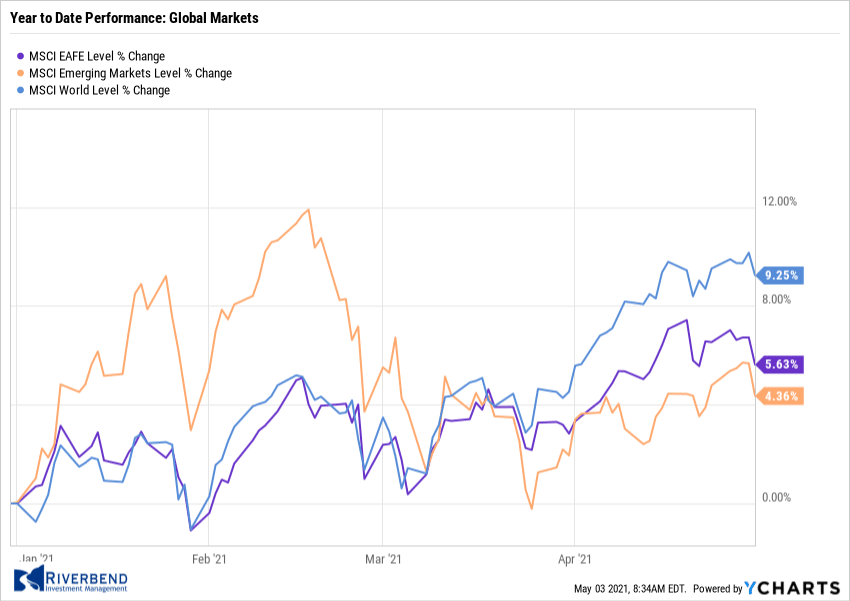
International markets finished the week mixed. Canada’s TSX rose 6 points to 19,108, essentially unchanged, while the United Kingdom’s FTSE 100 added 0.5%.
On Europe’s mainland, France’s CAC 40 rose 0.2%, while Germany’s DAX declined -0.9%.
In Asia, China’s Shanghai Composite retreated -0.8% and Japan’s Nikkei gave up -0.7%.
As grouped by Morgan Stanley Capital International, both developed and emerging markets ended down -1.2%.
Commodities: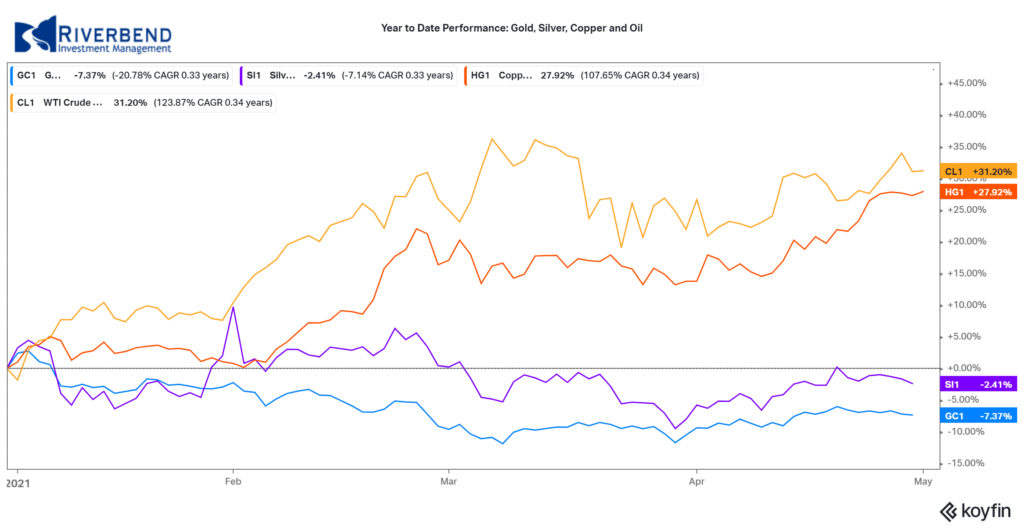
Energy rebounded following last week’s decline. West Texas Intermediate crude oil rose 2.3% to $63.58 per barrel.
Precious metals closed to the downside for a second week. Gold retreated -0.6% to $1767.70 per ounce, while Silver declined -0.8% to $25.87.
The industrial metal copper, viewed by some analysts as a barometer of global economic health due to its wide variety of uses rallied 3%.
U.S. Economic News: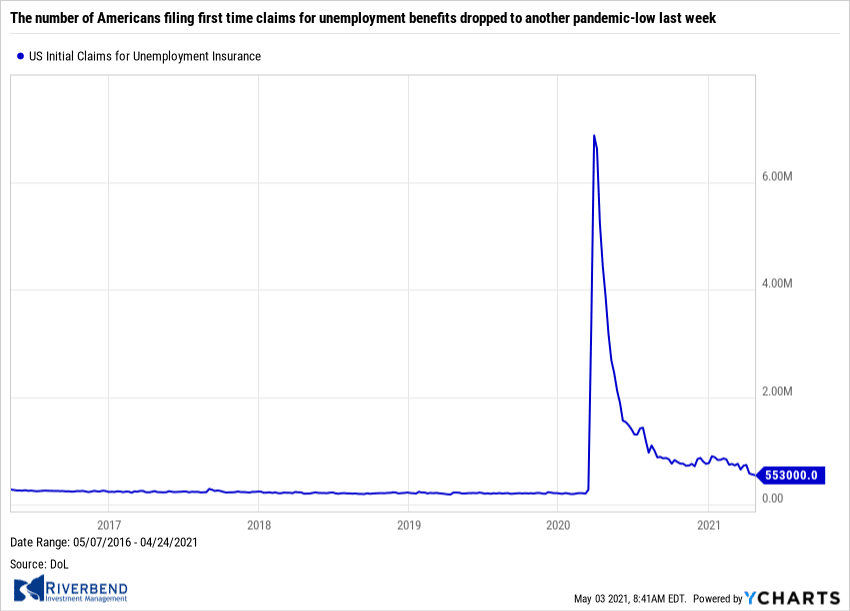
The number of Americans filing first time claims for unemployment benefits dropped to another pandemic-low last week, with the accelerating pace of COVID vaccinations helping to support the labor market’s recovery. The Department of Labor reported initial jobless claims last week fell by 13,000 to 553,000. Economists had expected 542,000 new claims. It was the third consecutive decline in claims and the lowest level since March 2020.
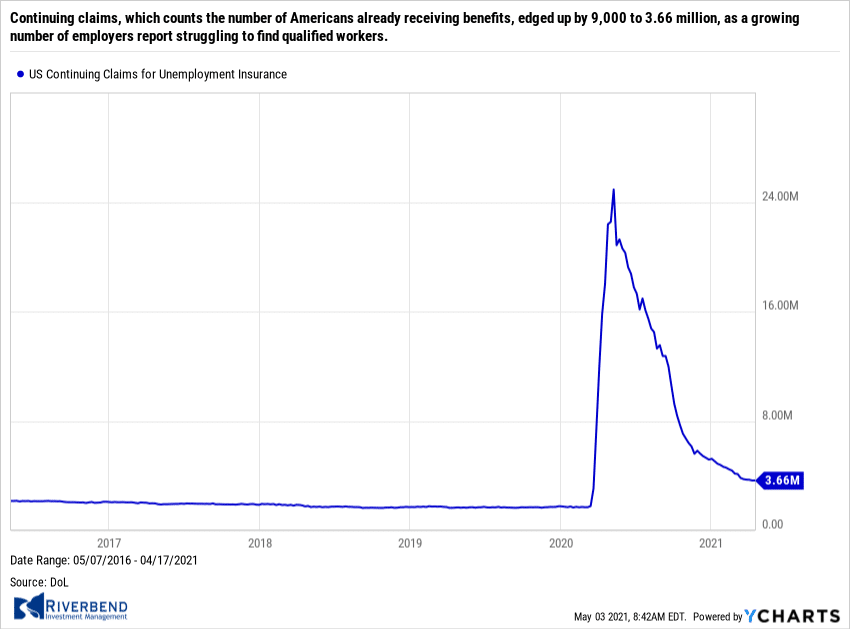
Continuing claims, which counts the number of Americans already receiving benefits, edged up by 9,000 to 3.66 million. “A growing number of employers report struggling to find qualified workers, particularly for entry level or lower wage positions,” Bankrate senior economic analyst Mark Hamrick said in an email. “The hard-hit leisure and hospitality sector, including bars and restaurants, appears to be ground zero for this challenge.”
The cost of purchasing a home increased by a record amount last month, according to two widely followed home price barometers. S&P CoreLogic Case-Shiller reported it index of home prices across 20 large cities increased at an annual pace of 11.9% in February. Month-over-month, home prices rose 1.2%–their biggest gain since February 2006.
Prices rose in all of the 20 cities tracked by Case-Shiller. Among these cities, Phoenix saw the largest increase once again with a 17.4% leap, followed by San Diego (up 17%) and Seattle (up 15.4%). The separate national index, which measures home prices across the country, displayed a similar 12% gain over the past year.
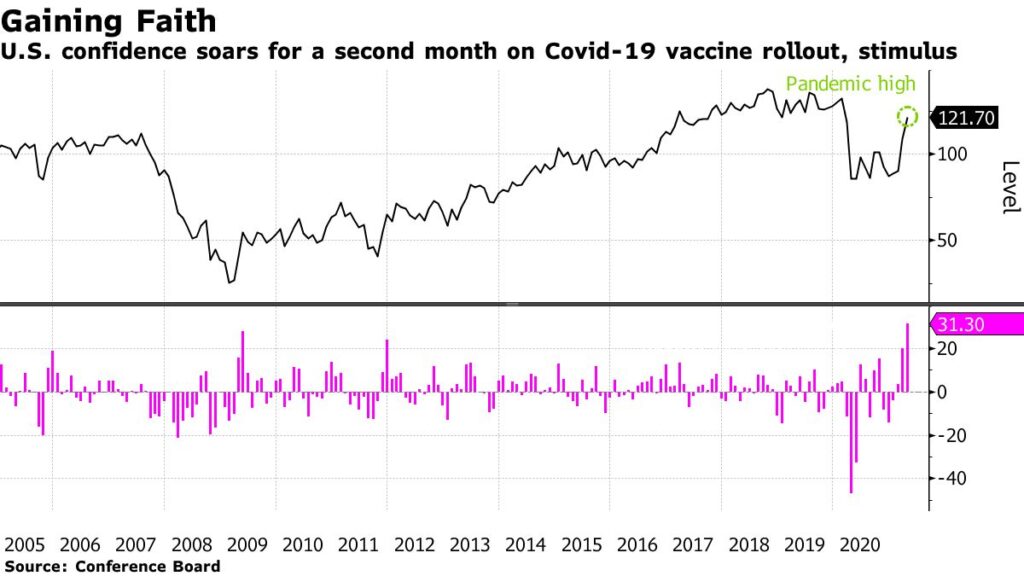
source: Conference Board, Bloomberg
The confidence of America’s consumers jumped to a 14-month high as rising vaccination counts, falling coronavirus cases, and a surge in hiring eased worries over the pandemic. The Conference Board reported its index of consumer confidence climbed 12.7 points to 121.7 this month. That’s the highest level since February of 2020. Economists had expected a reading of just 113.
In the report, the part of the survey that tracks how consumers feel about the economy right now surged to a 13-month peak of 139.6. Confidence in the future still hasn’t returned to pre-pandemic levels, however. The gauge that assesses how Americans view the next six months–the so-called future expectations index–only rose slightly to 109.8 from 108.3. The index stood close to a 20-year high of 132.6 shortly before the crisis began.
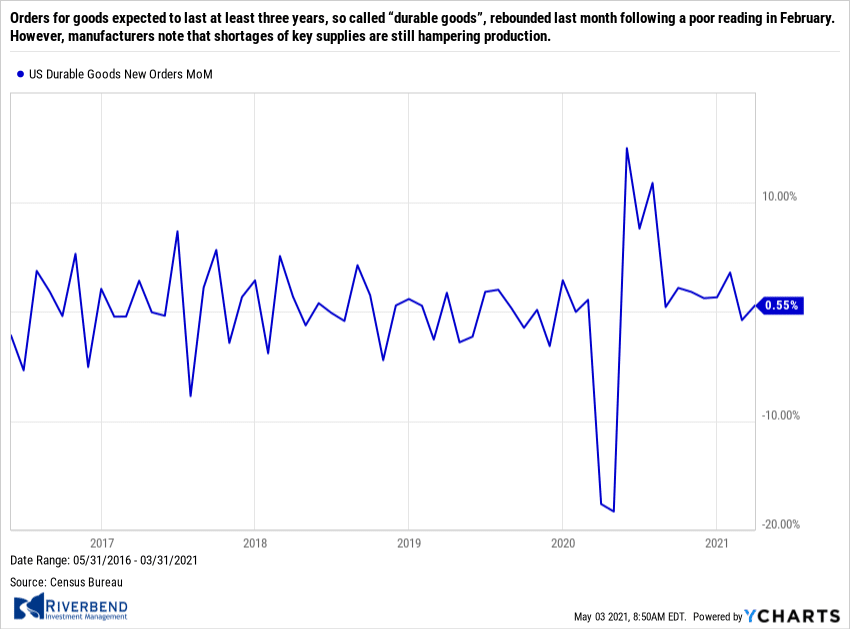
Orders for goods expected to last at least three years, so called “durable goods”, rebounded last month following a poor reading in February. However, manufacturers note that shortages of key supplies are still hampering production. The Census Bureau reported ‘Durable Goods Orders’ rose 0.5% last month. Economists had expected a 2.2% increase. Notably, orders for new cars and trucks increased 5.5% in March after slumping more than 9% in the prior month. Semiconductor shortages are still constraining production of some models, but automakers have managed to keep most of their assembly lines going.
Furthermore, durable goods orders would have been three times stronger in March if not for a sharp drop in bookings for commercial and military aircraft. If transportation is excluded, new orders actually rose 1.6% in March. “Core orders”, which excludes defense and transportation, rose 0.9% in March. Manufacturers reported their biggest obstacles are shortages of key supplies, a lack of skilled labor, and rising prices for raw materials.
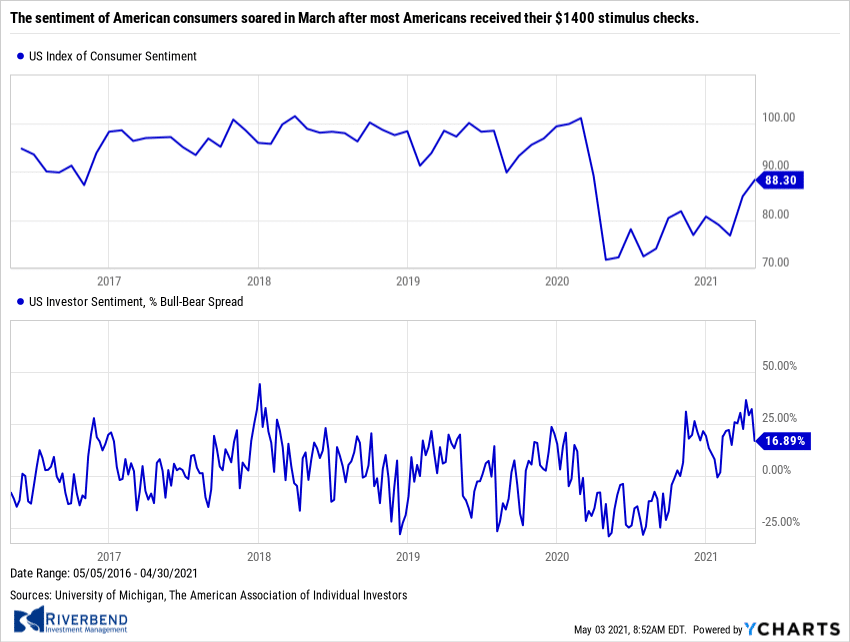
The sentiment of American consumers soared in March after most Americans received their $1400 stimulus checks. Consumers spent their checks on new cars, recreational goods, and takeout food in March, giving a big shot in the arm to an economy still recovering from the coronavirus pandemic. The government reported consumer spending soared 4.2% in March. Economists had expected a 4% increase. Economists predict even faster growth in the spring as vaccinated Americans get out and about and businesses ratchet up production to meet rising demand.
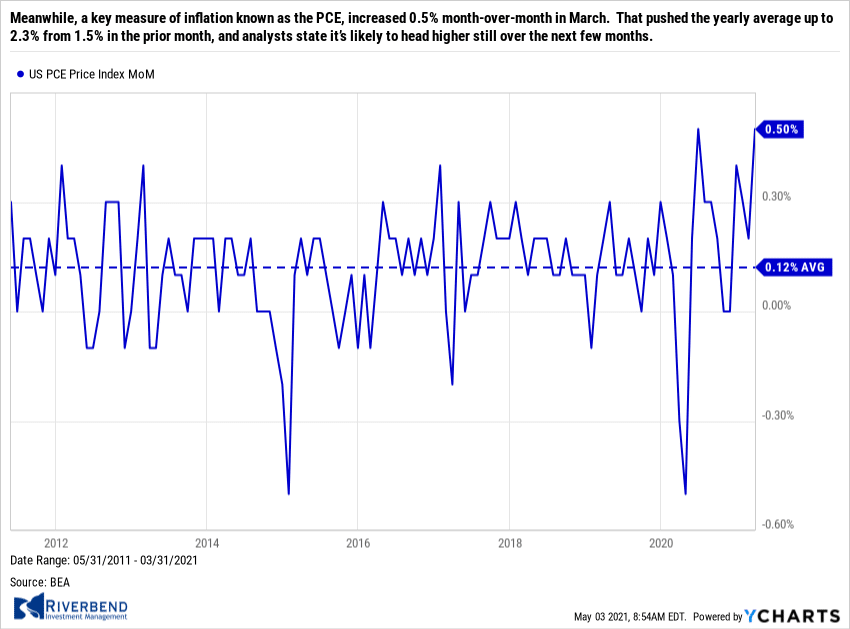
Meanwhile, a key measure of inflation known as the PCE, increased 0.5% month-over-month in March. That pushed the yearly average up to 2.3% from 1.5% in the prior month, and analysts state it’s likely to head higher still over the next few months. Mickey Levy, chief economist for Americans at Berenberg Capital Markets stated, “PCE inflation will likely rise to 3% and the core PCE inflation close to 2.5%. Although these sharp spikes will dissipate, we anticipate the robust growth in aggregate demand will support more sustained inflation pressures.”
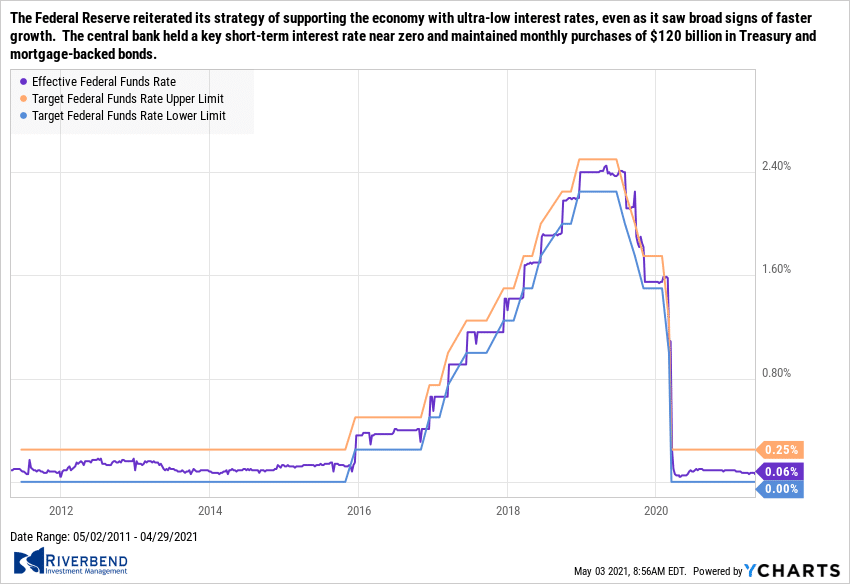
The Federal Reserve reiterated its strategy of supporting the economy with ultra-low interest rates, even as it saw broad signs of faster growth. The central bank held a key short-term interest rate near zero and maintained monthly purchases of $120 billion in Treasury and mortgage-backed bonds. These policies have enabled a housing boom and made it cheap for consumers and businesses to borrow.
Chairman Jerome Powell said the Fed would stay the course until the economy strengthened even further and coronavirus cases fell sharply. Powell reiterated that the Fed is not considering a pullback anytime soon. “There is a long way to go until we reach our goal,” he said.
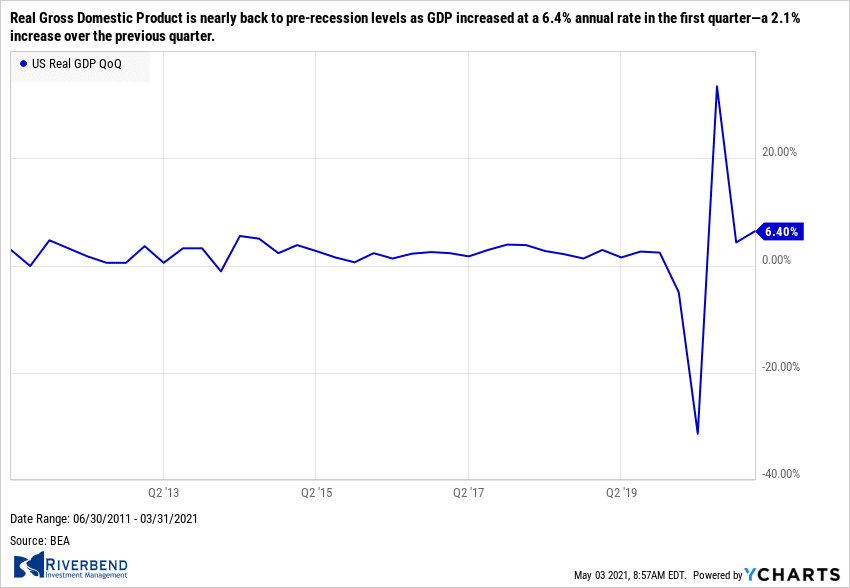
Real Gross Domestic Product is nearly back to pre-recession levels as GDP increased at a 6.4% annual rate in the first quarter—a 2.1% increase over the previous quarter. It was the third consecutive quarterly gain following the deep contraction in the first half of 2020. Real output is now 0.4% higher than a year ago, and only 0.9% short of its pre-pandemic peak.
The swift recovery has been supported by the successful vaccine rollout this year and multiple rounds of fiscal and monetary stimulus. Total COVID fiscal support has amounted to nearly 25% of 2020 GDP. Nearly all GDP components increased in the first quarter.
Chart of the Week:
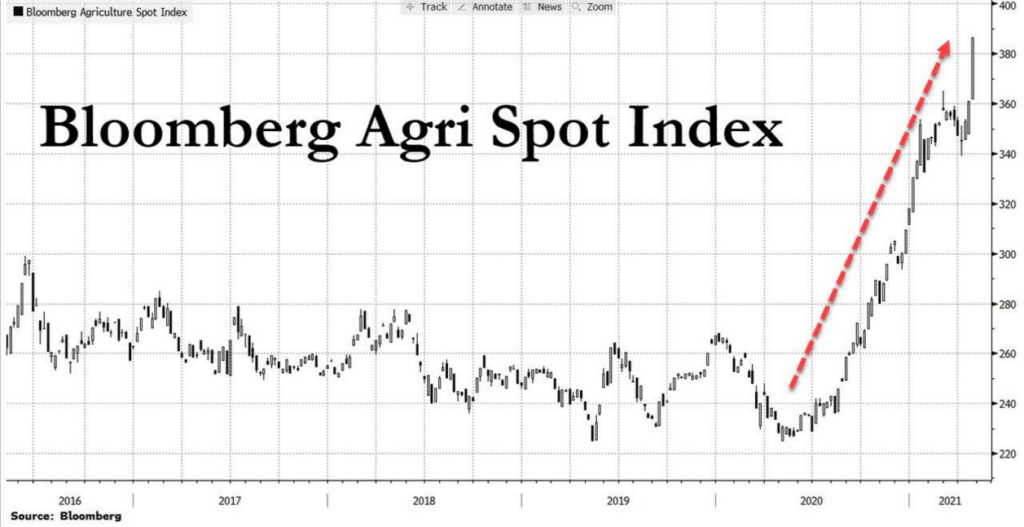
With upward price pressures already impacting the economy in areas like construction and building supplies, it was only a matter of time before food price inflation arrived at a supermarket near you.
The Bloomberg Agriculture Spot Index has risen by 76% year-over-year – the biggest rise in nearly a decade.
This is more than just a problem at the American dinner table as there is extensive literature connecting big jumps in food prices to periods of social unrest. The Arab Spring unrest in 2010-11 coincided with the last jump of this magnitude.
Deutsche Bank’s Jim Reid points out that “…emerging markets are more vulnerable to this trend, since their consumers spend a far greater share of their income on food than those in the developed world.” And Warren Buffet said at this weekend’s Berkshire Hathaway annual meeting that “We are seeing substantial inflation. We are raising prices. People are raising prices to us, and it’s being accepted.” Berkshire Hathaway owns, among many other holdings, food processing giant Kraft Heinz.
Riverbend Indicators:
Each week we post notable changes to the various market indicators we follow.
- As a reading of our Bull-Bear Indicator for U.S. Equities (comparative measurements over a rolling one-year timeframe), we remain in Cyclical Bull territory.
- Counting-up of the number of all our indicators that are ‘Up’ for U.S. Equities, the current tally is that four of four are Positive, representing a multitude of timeframes (two that can be solely days/weeks, or months+ at a time; another, a quarter at a time; and lastly, the {typically} years-long reading, that being the Cyclical Bull or Bear status).
The Week Ahead:
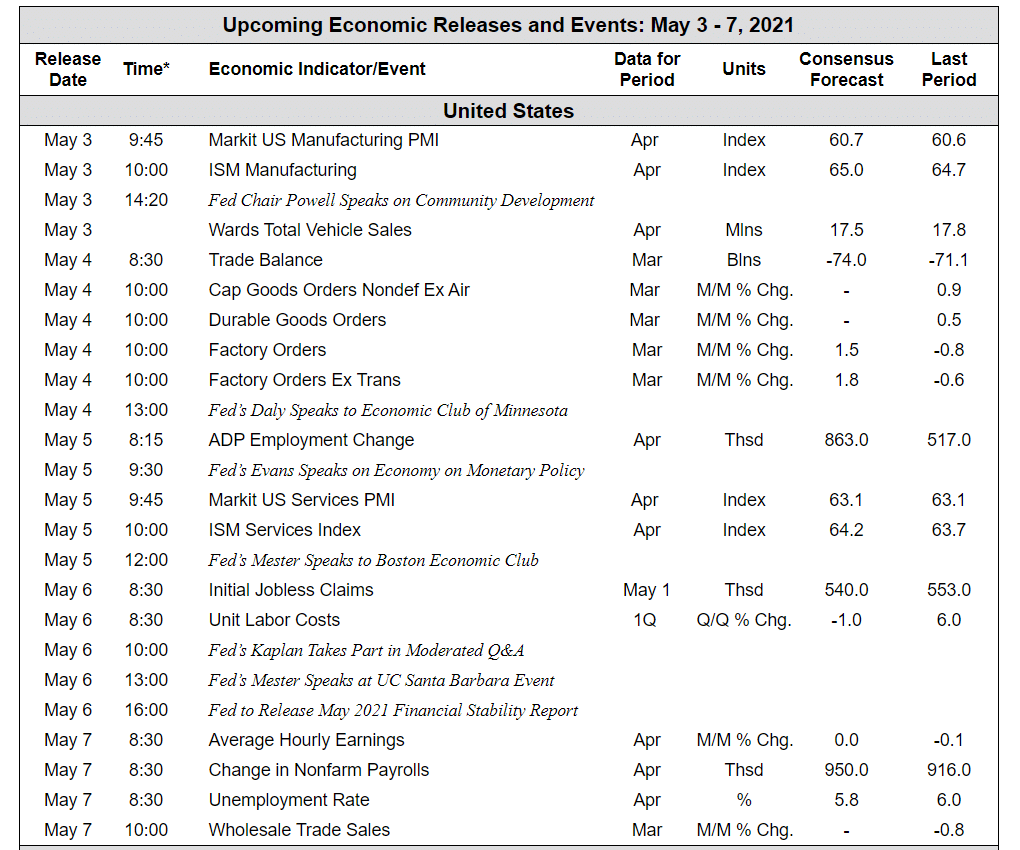
Source: TD Economics, Bloomberg
(Sources: All index- and returns-data from Yahoo Finance; news from Reuters, Barron’s, Wall St. Journal, Bloomberg.com, ft.com, guggenheimpartners.com, zerohedge.com, ritholtz.com, markit.com, financialpost.com, Eurostat, Statistics Canada, Yahoo! Finance, stocksandnews.com, marketwatch.com, wantchinatimes.com, BBC, 361capital.com, pensionpartners.com, cnbc.com, FactSet.)
[/fusion_text][/fusion_builder_column][fusion_builder_column type=”1_6″ spacing=”” center_content=”no” link=”” target=”_self” min_height=”” hide_on_mobile=”small-visibility,medium-visibility,large-visibility” class=”” id=”” hover_type=”none” border_size=”0″ border_color=”” border_style=”solid” border_position=”all” border_radius=”” box_shadow=”no” dimension_box_shadow=”” box_shadow_blur=”0″ box_shadow_spread=”0″ box_shadow_color=”” box_shadow_style=”” padding_top=”” padding_right=”” padding_bottom=”” padding_left=”” margin_top=”” margin_bottom=”” background_type=”single” gradient_start_color=”” gradient_end_color=”” gradient_start_position=”0″ gradient_end_position=”100″ gradient_type=”linear” radial_direction=”center” linear_angle=”180″ background_color=”” background_image=”” background_image_id=”” background_position=”left top” background_repeat=”no-repeat” background_blend_mode=”none” animation_type=”” animation_direction=”left” animation_speed=”0.3″ animation_offset=”” filter_type=”regular” filter_hue=”0″ filter_saturation=”100″ filter_brightness=”100″ filter_contrast=”100″ filter_invert=”0″ filter_sepia=”0″ filter_opacity=”100″ filter_blur=”0″ filter_hue_hover=”0″ filter_saturation_hover=”100″ filter_brightness_hover=”100″ filter_contrast_hover=”100″ filter_invert_hover=”0″ filter_sepia_hover=”0″ filter_opacity_hover=”100″ filter_blur_hover=”0″ last=”no”][/fusion_builder_column][/fusion_builder_row][/fusion_builder_container]


