[fusion_builder_container hundred_percent=”no” equal_height_columns=”no” menu_anchor=”” hide_on_mobile=”small-visibility,medium-visibility,large-visibility” class=”” id=”” background_color=”” background_image=”” background_position=”center center” background_repeat=”no-repeat” fade=”no” background_parallax=”none” parallax_speed=”0.3″ video_mp4=”” video_webm=”” video_ogv=”” video_url=”” video_aspect_ratio=”16:9″ video_loop=”yes” video_mute=”yes” overlay_color=”” video_preview_image=”” border_size=”” border_color=”” border_style=”solid” padding_top=”” padding_bottom=”” padding_left=”” padding_right=””][fusion_builder_row][fusion_builder_column type=”1_6″ spacing=”” center_content=”no” link=”” target=”_self” min_height=”” hide_on_mobile=”small-visibility,medium-visibility,large-visibility” class=”” id=”” hover_type=”none” border_size=”0″ border_color=”” border_style=”solid” border_position=”all” border_radius=”” box_shadow=”no” dimension_box_shadow=”” box_shadow_blur=”0″ box_shadow_spread=”0″ box_shadow_color=”” box_shadow_style=”” padding_top=”” padding_right=”” padding_bottom=”” padding_left=”” margin_top=”” margin_bottom=”” background_type=”single” gradient_start_color=”” gradient_end_color=”” gradient_start_position=”0″ gradient_end_position=”100″ gradient_type=”linear” radial_direction=”center” linear_angle=”180″ background_color=”” background_image=”” background_image_id=”” background_position=”left top” background_repeat=”no-repeat” background_blend_mode=”none” animation_type=”” animation_direction=”left” animation_speed=”0.3″ animation_offset=”” filter_type=”regular” filter_hue=”0″ filter_saturation=”100″ filter_brightness=”100″ filter_contrast=”100″ filter_invert=”0″ filter_sepia=”0″ filter_opacity=”100″ filter_blur=”0″ filter_hue_hover=”0″ filter_saturation_hover=”100″ filter_brightness_hover=”100″ filter_contrast_hover=”100″ filter_invert_hover=”0″ filter_sepia_hover=”0″ filter_opacity_hover=”100″ filter_blur_hover=”0″ last=”no”][/fusion_builder_column][fusion_builder_column type=”2_3″ layout=”1_1″ background_position=”left top” background_color=”” border_size=”” border_color=”” border_style=”solid” border_position=”all” spacing=”yes” background_image=”” background_repeat=”no-repeat” padding_top=”” padding_right=”” padding_bottom=”” padding_left=”” margin_top=”0px” margin_bottom=”0px” class=”” id=”” animation_type=”” animation_speed=”0.3″ animation_direction=”left” hide_on_mobile=”small-visibility,medium-visibility,large-visibility” center_content=”no” last=”no” min_height=”” hover_type=”none” link=””][fusion_text]
U.S. Markets: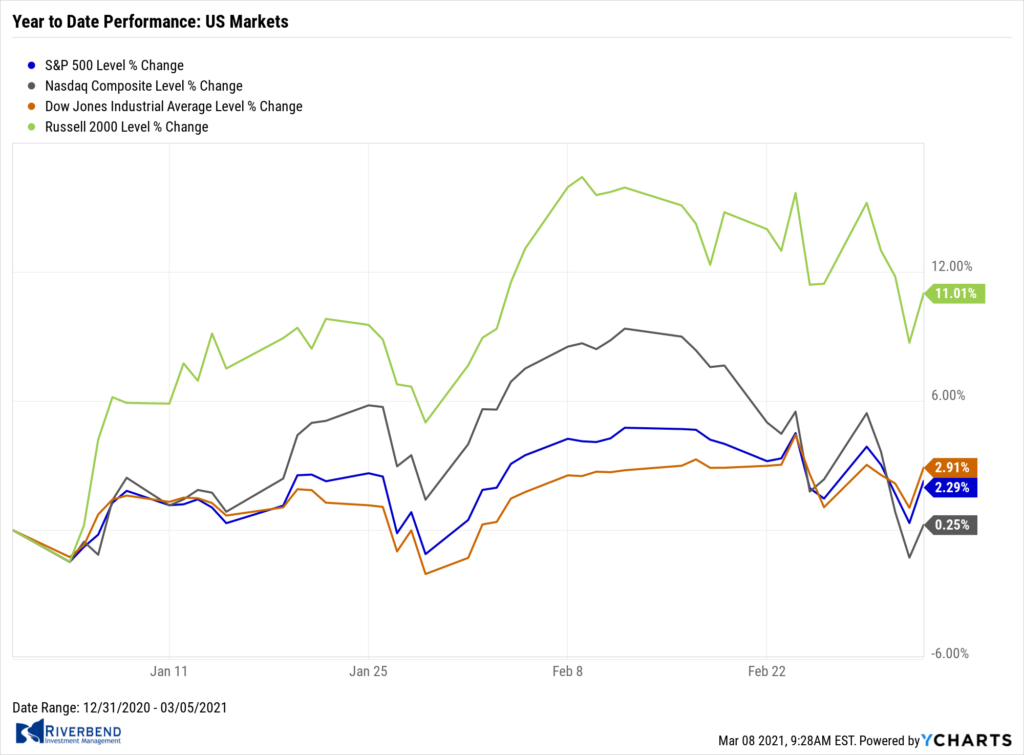
The major U.S. benchmark indexes finished the week mixed as longer-term interest rates continued to climb. The rise in rates weighed on growth stocks, while value stocks managed gains.
The Dow Jones Industrial Average climbed 564 points finishing the week at 31,496—a gain of 1.8%. The technology-heavy NASDAQ Composite declined a third consecutive week giving up -2.1%.
By market cap, the large cap S&P 500 added 0.8%, while the mid cap S&P 400 rose 0.7% and the small cap Russell 2000 declined -0.4%.
International Markets: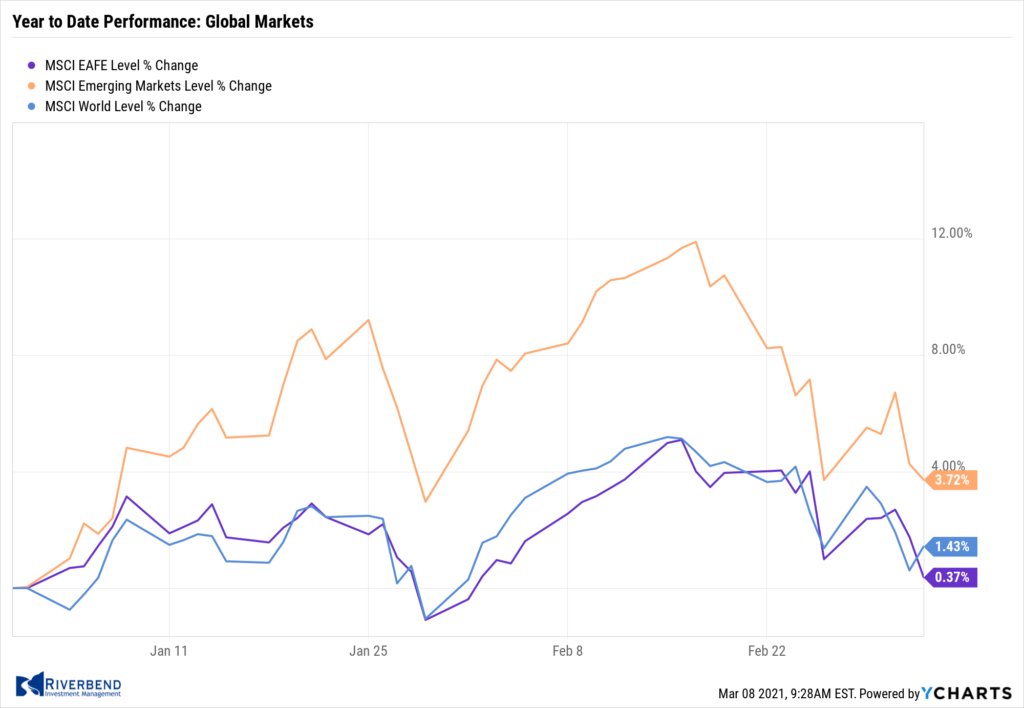
Like the U.S., international markets were mixed on the week. Canada’s TSX finished the week up 1.8%, while the United Kingdom’s FTSE rose 2.3%.
On Europe’s mainland, France’s CAC 40 and Germany’s DAX added 1.4% and 1.0%, respectively.
In Asia, China’s Shanghai Composite ticked down -0.2%, while Japan’s Nikkei retreated -0.4%.
As grouped by Morgan Stanley Capital International, developed markets rose 0.8% while emerging markets added 0.2%.
Commodities: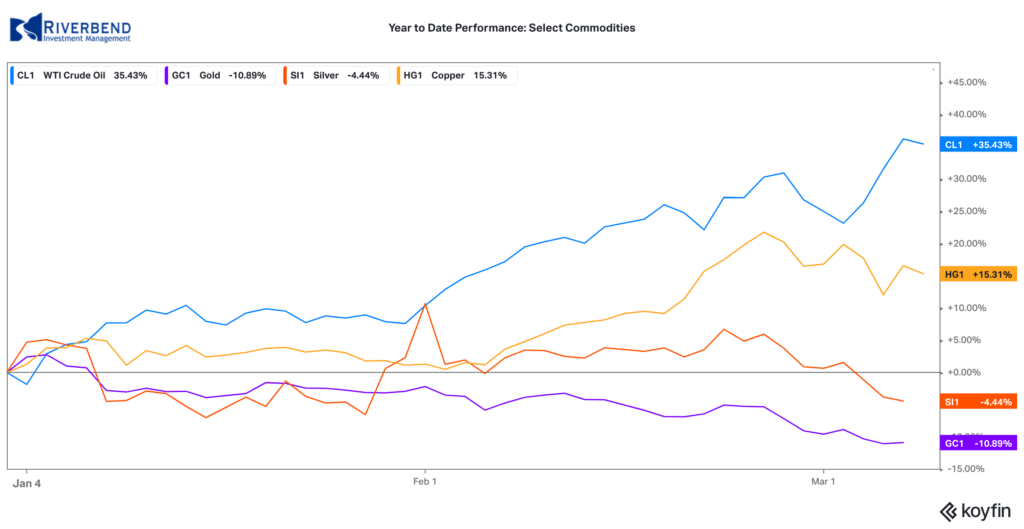
Precious metals continued their descent. Gold declined -1.75% to $1698.50 per ounce, while Silver fell a further -4.4% to $25.29 per ounce.
Oil, on the other hand, continued its ascent, now up four out of the last five weeks. West Texas Intermediate crude oil surged 7.5% to $66.09 per barrel.
The industrial metal copper, viewed by some analysts as a barometer of global economic health due to its wide variety of uses, finished the week down -0.4%.
U.S. Economic News: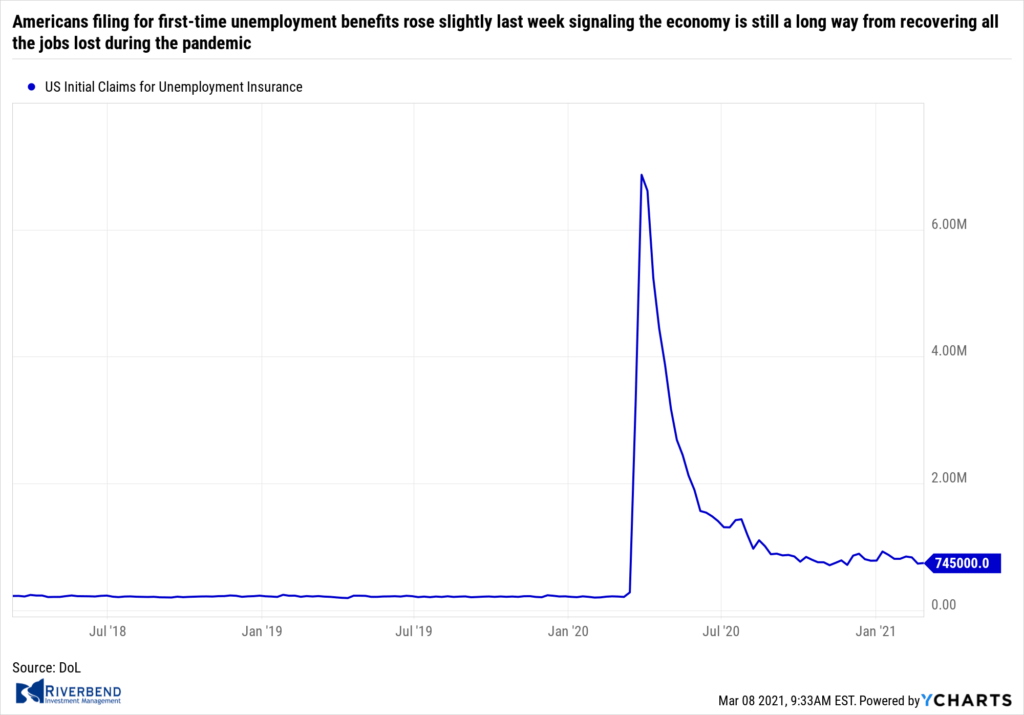
The number of Americans filing for first-time unemployment benefits rose slightly last week signaling the economy is still a long way from recovering all the jobs lost during the pandemic. The Labor Department reported initial jobless claims rose by 9,000 to 745,000 in the week ended February 27th. Economists had forecast claims would total 750,000.
For perspective, new claims were running in the low 200,000’s before the pandemic took hold in late February of last year. New applications for jobless benefits rose the most in Texas, Ohio and New York. Missouri was the only state to report a big decline.
The U.S. economy added 379,000 jobs in February – the biggest gain in four months – in what is hoped to be a preview of the surge in hiring in the months ahead as the economy fully reopens. The increase in hiring last month was concentrated at businesses such as restaurants, retailers, hotels and entertainment venues as states eased restrictions on customer limits and public gatherings. Most other industries also added workers.
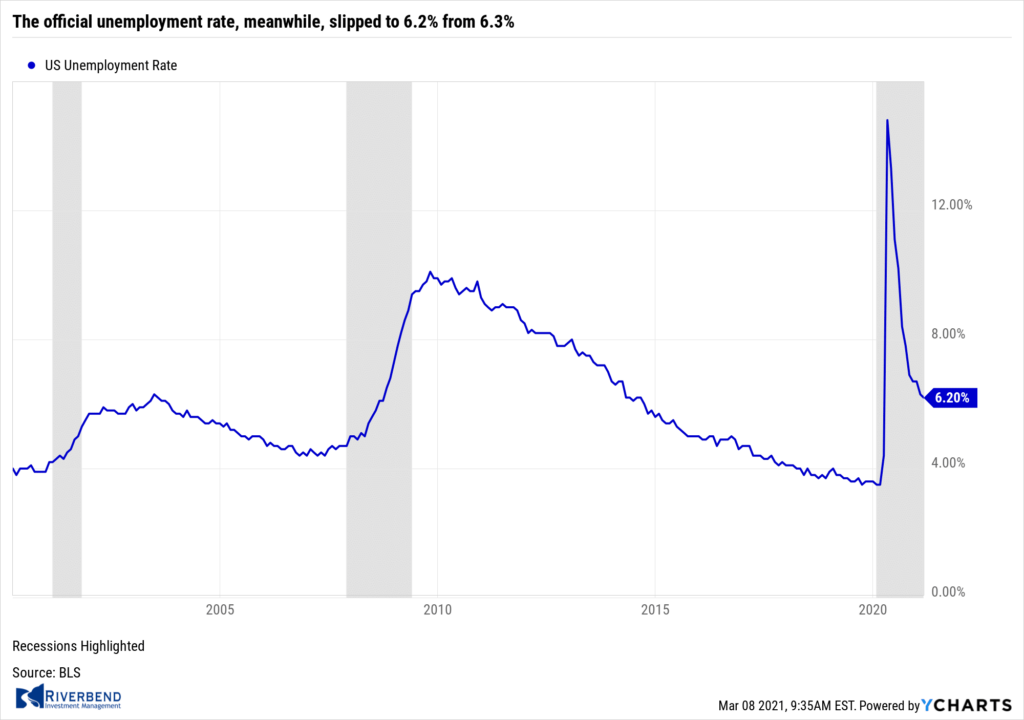 The official unemployment rate, meanwhile, slipped to 6.2% from 6.3%. Analysts believe warmer weather, falling coronavirus cases, rising vaccinations, and another massive increase in federal stimulus are all likely to contribute to a strong labor market in the spring and summer. The increase exceeded Wall Street expectations. Economists had expected just 210,000 new jobs. New jobs in leisure and hospitality — restaurants, hotels, casinos, theaters and the like — accounted for almost all of the gains.
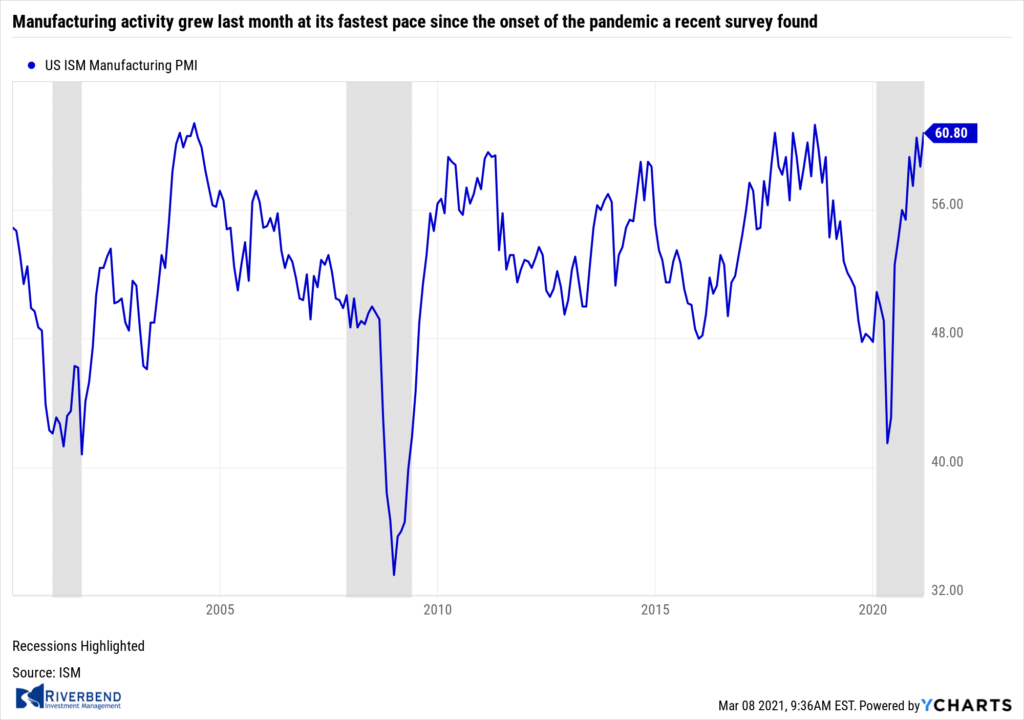 Manufacturing activity grew last month at its fastest pace since the onset of the pandemic a recent survey found. The Institute for Supply Management (ISM) reported its manufacturing survey climbed 2.1 points to 60.8—a three-year high. Readings over 50 indicate growth, while readings over 55 are considered exceptional. The increase surpassed Wall Street expectations. Economists had expected a reading of just 58.9.
In the report, new orders, production, and employment all improved last month. Of concern, the biggest worry of the ISM survey respondents was shortages of key materials such as lumber and semiconductors which are pushing prices higher and in some cases restricting production. That could lead to an increase in inflation and hinder the recovery. A senior executive at a maker of wood products stated, “Prices are rising so rapidly that many are wondering if [the situation] is sustainable.”
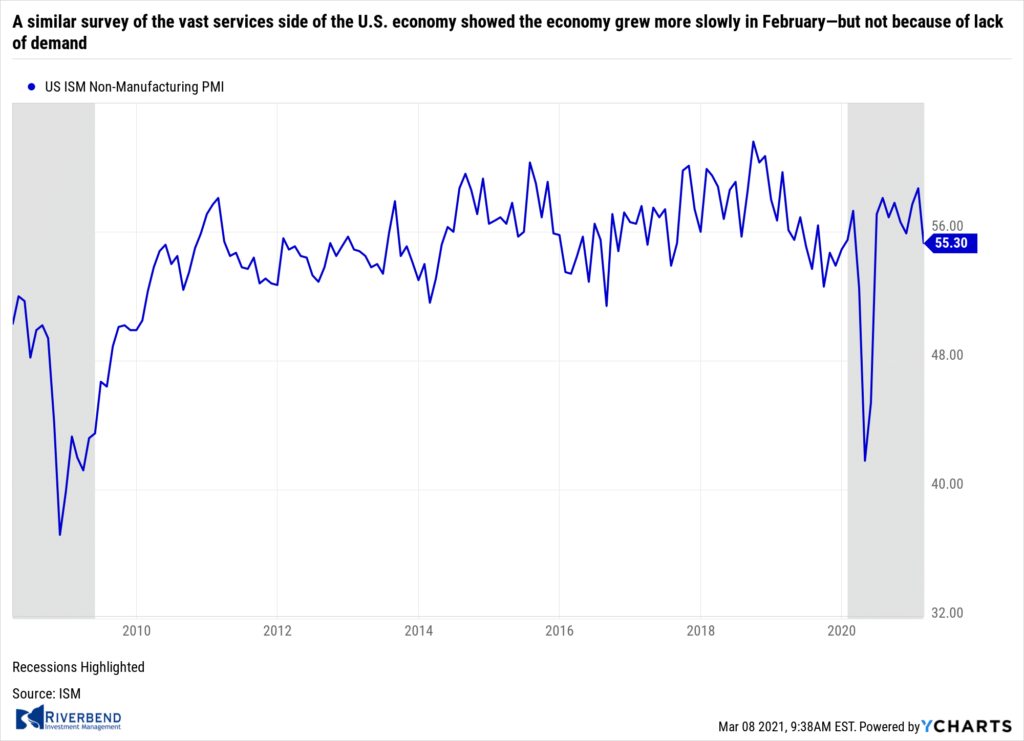 A similar survey of the vast services side of the U.S. economy showed the economy grew more slowly in February—but not because of lack of demand. Again, shortages of key supplies hurt many service providers’ ability to run their businesses at full tilt. ISM reported its services index, a survey of business leaders at service-oriented firms such as banks, retailers, and restaurants slipped 3.4 points to 55.3.
The reading indicates the ninth straight month of growth for the services sector which has expanded for all but two of the last 133 months. Still, the survey fell short of Wall Street expectations. Economists had expected the index to remain at 58.7. The biggest worry in the report was the increase in prices. The price gauge component of the ISM survey soared to 71.8—its highest level in 10 years.
The Federal Reserve’s ‘Beige Book’ found only modest improvement in the economy. Overall, the survey noted, business contacts were optimistic about the rest of the year as COVID-19 vaccinations continue, but things were improving slower than desired. On the crucial question of inflation, the report found a mixed picture. Some retailers and manufacturers were able to raise prices to consumers, but many others were not. Most districts reported that nonfinancial services, a key sector badly damaged by the pandemic, saw only modest growth.
 In a Wall Street Journal webinar, Federal Reserve Chairman Jerome Powell reiterated that the current fiscal policy is appropriate despite worries over inflation and troubling signs in the bond market. Powell said the bond market sell-off over the past few weeks has his attention and the central bank would not sit back and let financial conditions tighten broadly. However, Powell offered no concrete guidance on his plan to counter such events.
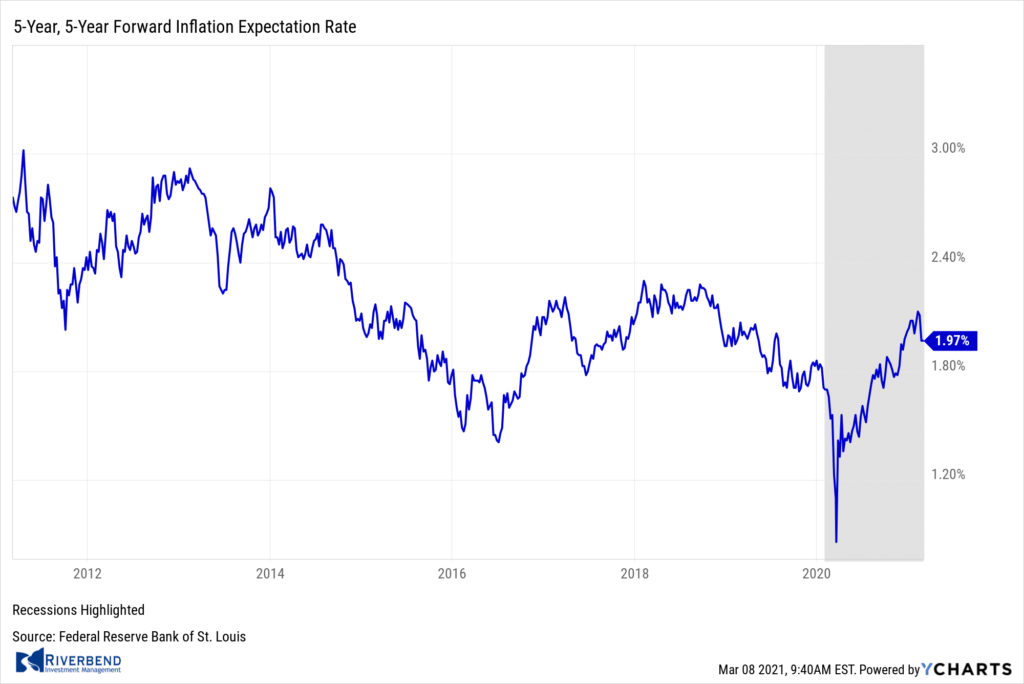
In addition, Powell said the Fed would be “patient” with higher inflation, saying it will likely be a “one time” effect and not price increases that continue year-after-year. Powell repeated that the Fed was a “long way” from its goals of maximum employment and stable 2% inflation.
Chart of the Week: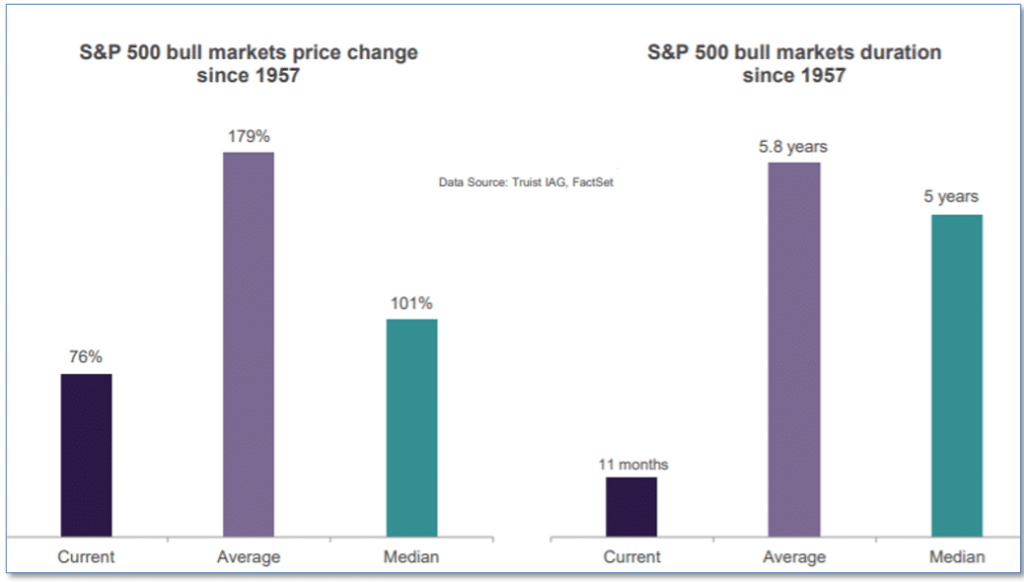
It has been a little over a year since the coronavirus pandemic blindsided the U.S. economy and crashed the stock market into a short-lived bear market. The new bull market that began at the end of March/start of April is thus now about 11 months old.
That’s one of the key reasons why analysts at Truist Wealth think the upswing in the S&P 500 still has plenty of room to run. Looking at data over the past six decades, Truist asserts that the current bull-market may be both too young and too limited in terms of price gains to be over anytime soon.
The current gains are much lower than the average gain since 1957, and the age of this bull is not even close to the average duration of 5 years.
Riverbend Indicators Update:

Each week we post notable changes to the various market indicators we follow.
- As a reading of our Bull-Bear Indicator for U.S. Equities (comparative measurements over a rolling one-year timeframe), we remain in Cyclical Bull territory.
- Counting-up of the number of all our indicators that are ‘Up’ for U.S. Equities, the current tally is that three of four are Positive, representing a multitude of timeframes (two that can be solely days/weeks, or months+ at a time; another, a quarter at a time; and lastly, the {typically} years-long reading, that being the Cyclical Bull or Bear status).
Observations:
One topic that I brought up at the start of the year were possible market themes and how they may play out in 2021.
So far, the two primary themes I wrote about are still ongoing.
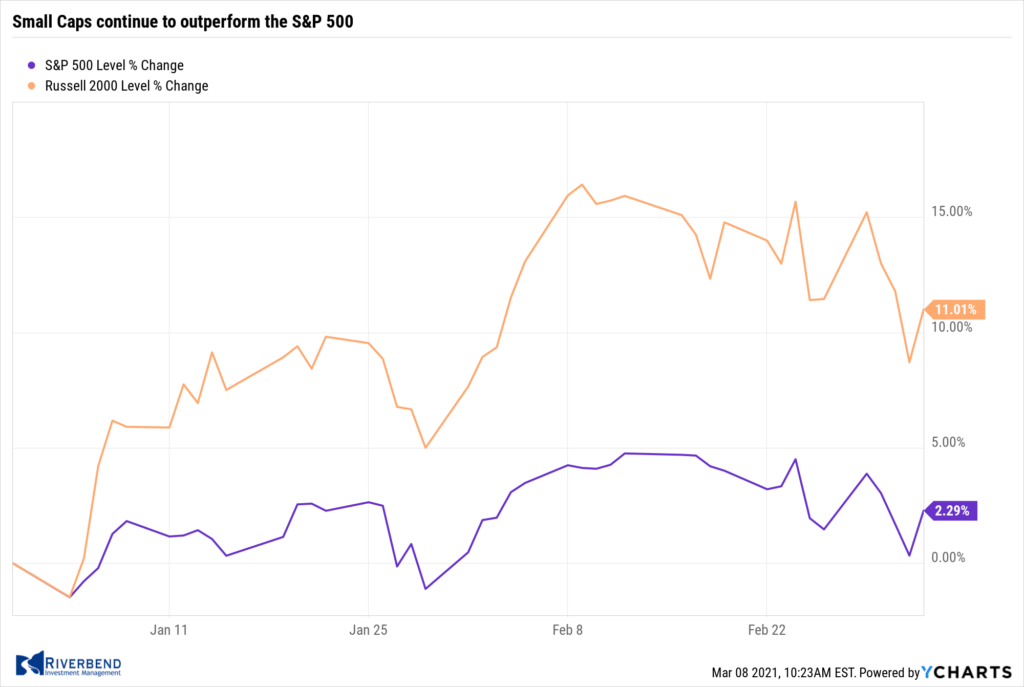
The first of these is the rotation into the small and mid-cap areas of the market.
Year to date, we have seen a strong outperformance by small-caps vs the S&P 500 index:
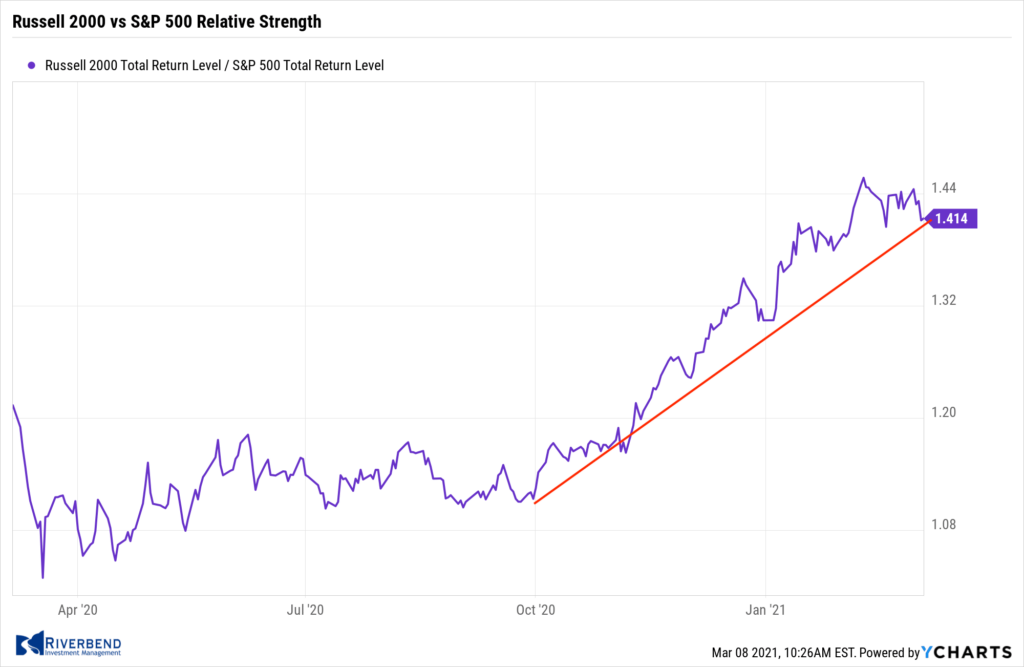
I expect this trend to continue as the relative strength relationship favoring small-caps over the S&P 500 continues to grow stronger:
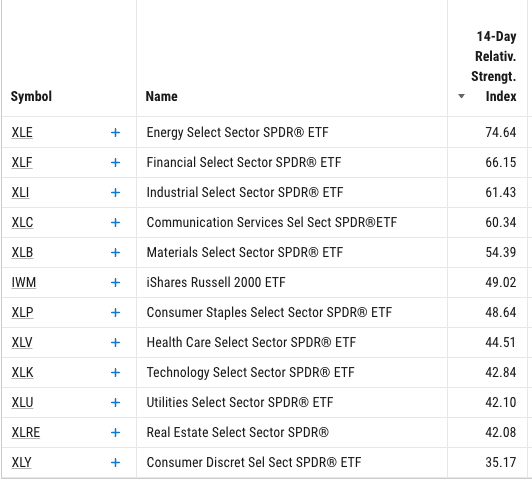
The second theme I mentioned was in regards to winners vs losers.
Last year’s losers are this year’s winners. I am seeing a continued interest in areas of the market that was hit hardest last year due to COVID. For example, last year the energy sector (“XLE”) declined -36.88%.
This year energy is up over 39%:
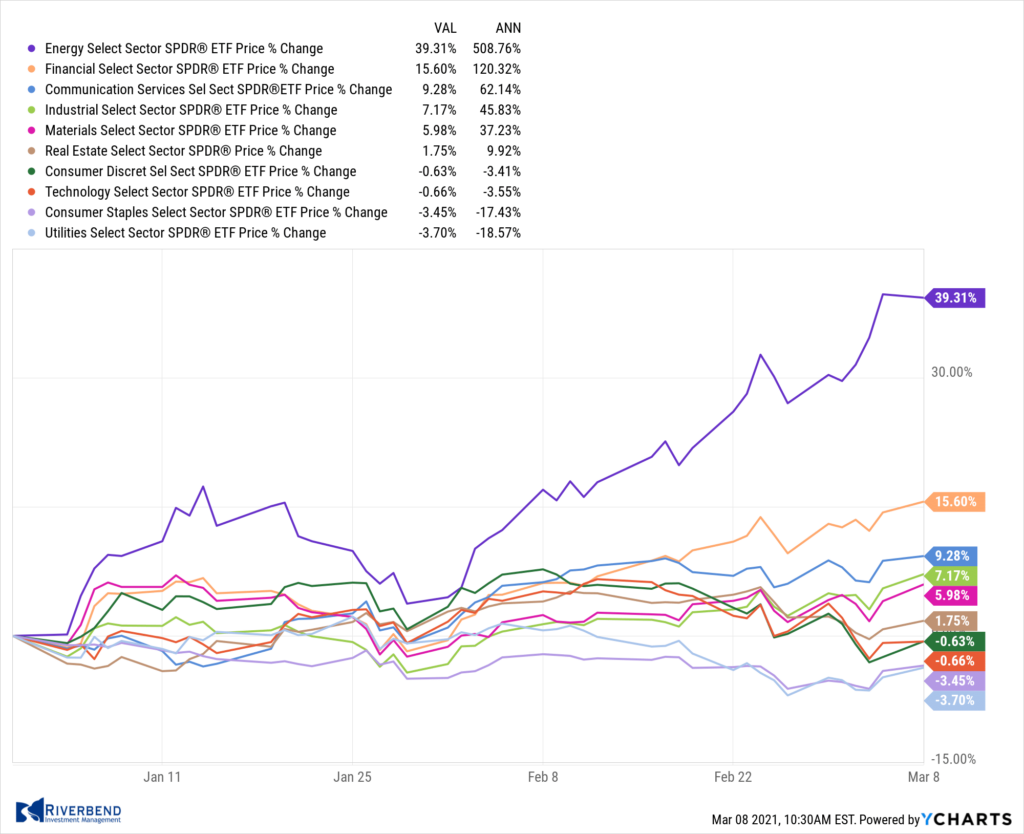
Additionally, the relative strength breakdown of the market confirms this trend continues:
For passive investors, especially “buy and hold” indexers, this is a problem.
Within the S&P 500, the technology sector makes up nearly a quarter of the index, while energy’s weighting is less than 3%:
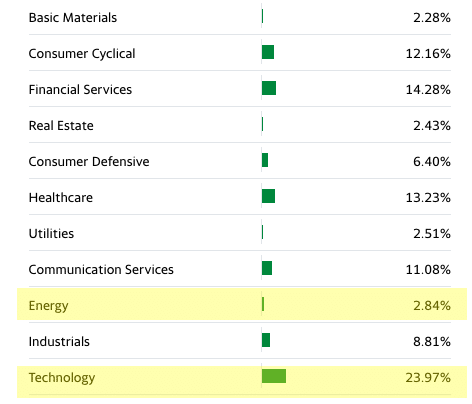
For investors who simply buy an index fund like the “SPY” (SPDR S&P 500 ETF Trust), they are simply not participating in this rotation. At some point, we may see this area of the market “throw in the towel” and rush into the areas of the market that have been doing well. This fear of missing out may provide additional inflows into last year’s losers.
Looking forward, I continue to believe 2021 will favor rotational strategies (like the ones we use at Riverbend) as investors focus on sectors that show the greatest recovery potential in a post-COVID world.
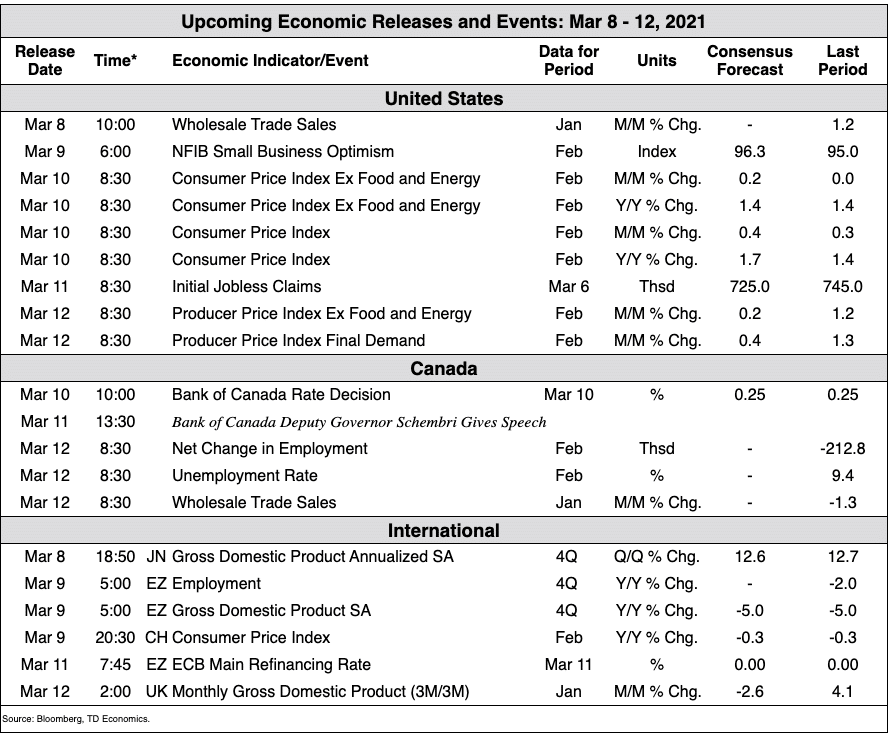
The Week Ahead:
(Sources: All index- and returns-data from Yahoo Finance; news from Reuters, Barron’s, Wall St. Journal, Bloomberg.com, yCharts, ft.com, guggenheimpartners.com, zerohedge.com, ritholtz.com, markit.com, financialpost.com, Eurostat, Statistics Canada, Yahoo! Finance, stocksandnews.com, marketwatch.com, wantchinatimes.com, BBC, 361capital.com, pensionpartners.com, cnbc.com, FactSet.)
[/fusion_text][/fusion_builder_column][fusion_builder_column type=”1_6″ spacing=”” center_content=”no” link=”” target=”_self” min_height=”” hide_on_mobile=”small-visibility,medium-visibility,large-visibility” class=”” id=”” hover_type=”none” border_size=”0″ border_color=”” border_style=”solid” border_position=”all” box_shadow=”no” box_shadow_blur=”0″ box_shadow_spread=”0″ box_shadow_color=”” box_shadow_style=”” background_type=”single” gradient_start_position=”0″ gradient_end_position=”100″ gradient_type=”linear” radial_direction=”center” linear_angle=”180″ background_color=”” background_image=”” background_image_id=”” background_position=”left top” background_repeat=”no-repeat” background_blend_mode=”none” animation_type=”” animation_direction=”left” animation_speed=”0.3″ animation_offset=”” filter_type=”regular” filter_hue=”0″ filter_saturation=”100″ filter_brightness=”100″ filter_contrast=”100″ filter_invert=”0″ filter_sepia=”0″ filter_opacity=”100″ filter_blur=”0″ filter_hue_hover=”0″ filter_saturation_hover=”100″ filter_brightness_hover=”100″ filter_contrast_hover=”100″ filter_invert_hover=”0″ filter_sepia_hover=”0″ filter_opacity_hover=”100″ filter_blur_hover=”0″ last=”no”][/fusion_builder_column][/fusion_builder_row][/fusion_builder_container][fusion_builder_container hundred_percent=”no” hundred_percent_height=”no” hundred_percent_height_scroll=”no” hundred_percent_height_center_content=”yes” equal_height_columns=”no” menu_anchor=”” hide_on_mobile=”small-visibility,medium-visibility,large-visibility” status=”published” publish_date=”” class=”” id=”” border_size=”” border_color=”” border_style=”solid” margin_top=”” margin_bottom=”” padding_top=”” padding_right=”” padding_bottom=”” padding_left=”” gradient_start_color=”” gradient_end_color=”” gradient_start_position=”0″ gradient_end_position=”100″ gradient_type=”linear” radial_direction=”center” linear_angle=”180″ background_color=”” background_image=”” background_position=”center center” background_repeat=”no-repeat” fade=”no” background_parallax=”none” enable_mobile=”no” parallax_speed=”0.3″ background_blend_mode=”none” video_mp4=”” video_webm=”” video_ogv=”” video_url=”” video_aspect_ratio=”16:9″ video_loop=”yes” video_mute=”yes” video_preview_image=”” filter_hue=”0″ filter_saturation=”100″ filter_brightness=”100″ filter_contrast=”100″ filter_invert=”0″ filter_sepia=”0″ filter_opacity=”100″ filter_blur=”0″ filter_hue_hover=”0″ filter_saturation_hover=”100″ filter_brightness_hover=”100″ filter_contrast_hover=”100″ filter_invert_hover=”0″ filter_sepia_hover=”0″ filter_opacity_hover=”100″ filter_blur_hover=”0″][fusion_builder_row][/fusion_builder_row][/fusion_builder_container]


