[fusion_builder_container hundred_percent=”no” equal_height_columns=”no” menu_anchor=”” hide_on_mobile=”small-visibility,medium-visibility,large-visibility” class=”” id=”” background_color=”” background_image=”” background_position=”center center” background_repeat=”no-repeat” fade=”no” background_parallax=”none” parallax_speed=”0.3″ video_mp4=”” video_webm=”” video_ogv=”” video_url=”” video_aspect_ratio=”16:9″ video_loop=”yes” video_mute=”yes” overlay_color=”” video_preview_image=”” border_size=”” border_color=”” border_style=”solid” padding_top=”” padding_bottom=”” padding_left=”” padding_right=””][fusion_builder_row][fusion_builder_column type=”1_6″ spacing=”” center_content=”no” link=”” target=”_self” min_height=”” hide_on_mobile=”small-visibility,medium-visibility,large-visibility” class=”” id=”” hover_type=”none” border_size=”0″ border_color=”” border_style=”solid” border_position=”all” border_radius=”” box_shadow=”no” dimension_box_shadow=”” box_shadow_blur=”0″ box_shadow_spread=”0″ box_shadow_color=”” box_shadow_style=”” padding_top=”” padding_right=”” padding_bottom=”” padding_left=”” margin_top=”” margin_bottom=”” background_type=”single” gradient_start_color=”” gradient_end_color=”” gradient_start_position=”0″ gradient_end_position=”100″ gradient_type=”linear” radial_direction=”center” linear_angle=”180″ background_color=”” background_image=”” background_image_id=”” background_position=”left top” background_repeat=”no-repeat” background_blend_mode=”none” animation_type=”” animation_direction=”left” animation_speed=”0.3″ animation_offset=”” filter_type=”regular” filter_hue=”0″ filter_saturation=”100″ filter_brightness=”100″ filter_contrast=”100″ filter_invert=”0″ filter_sepia=”0″ filter_opacity=”100″ filter_blur=”0″ filter_hue_hover=”0″ filter_saturation_hover=”100″ filter_brightness_hover=”100″ filter_contrast_hover=”100″ filter_invert_hover=”0″ filter_sepia_hover=”0″ filter_opacity_hover=”100″ filter_blur_hover=”0″ last=”no”][/fusion_builder_column][fusion_builder_column type=”2_3″ layout=”1_1″ background_position=”left top” background_color=”” border_size=”” border_color=”” border_style=”solid” border_position=”all” spacing=”yes” background_image=”” background_repeat=”no-repeat” padding_top=”” padding_right=”” padding_bottom=”” padding_left=”” margin_top=”0px” margin_bottom=”0px” class=”” id=”” animation_type=”” animation_speed=”0.3″ animation_direction=”left” hide_on_mobile=”small-visibility,medium-visibility,large-visibility” center_content=”no” last=”no” min_height=”” hover_type=”none” link=””][fusion_text]
U.S. Markets: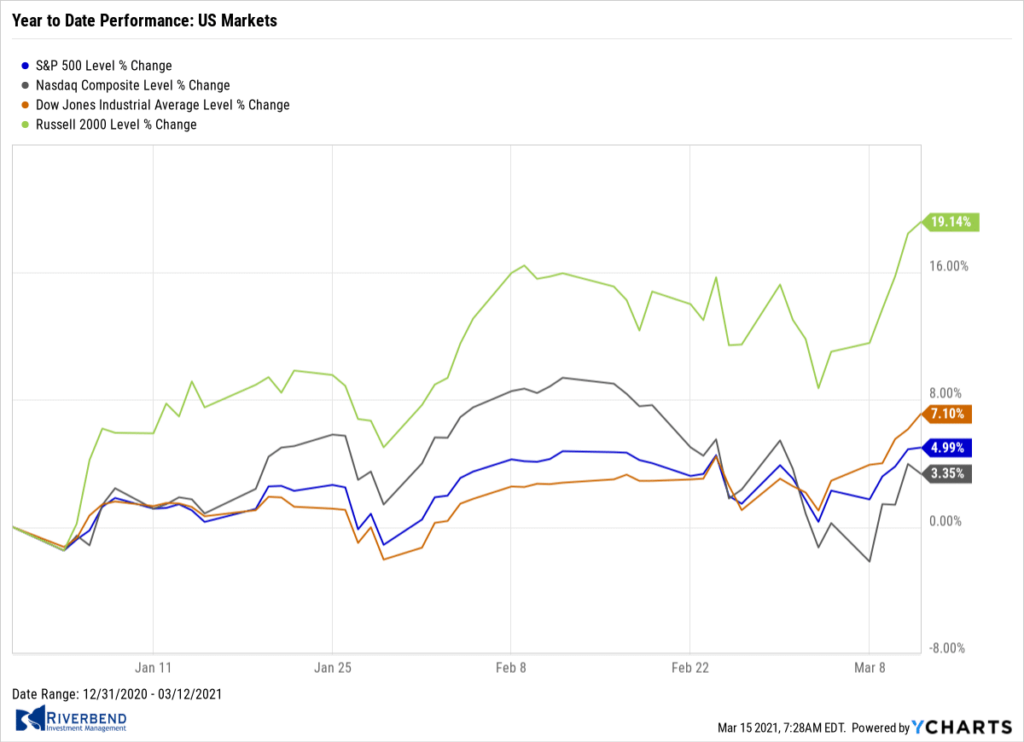
U.S. stocks moved broadly higher for the week, lifting most of the major benchmarks to new record highs.
The Dow Jones Industrial Average rallied almost a thousand points finishing the week at 32,778, a 4.1% gain. The technology-heavy NASDAQ Composite added 3.1% closing at 13,319.
By market cap, the large-cap S&P 500 added 2.6%, while the mid-cap S&P 400 and small-cap Russell 2000 rose by 5.3% and 7.3%, respectively.
International Markets: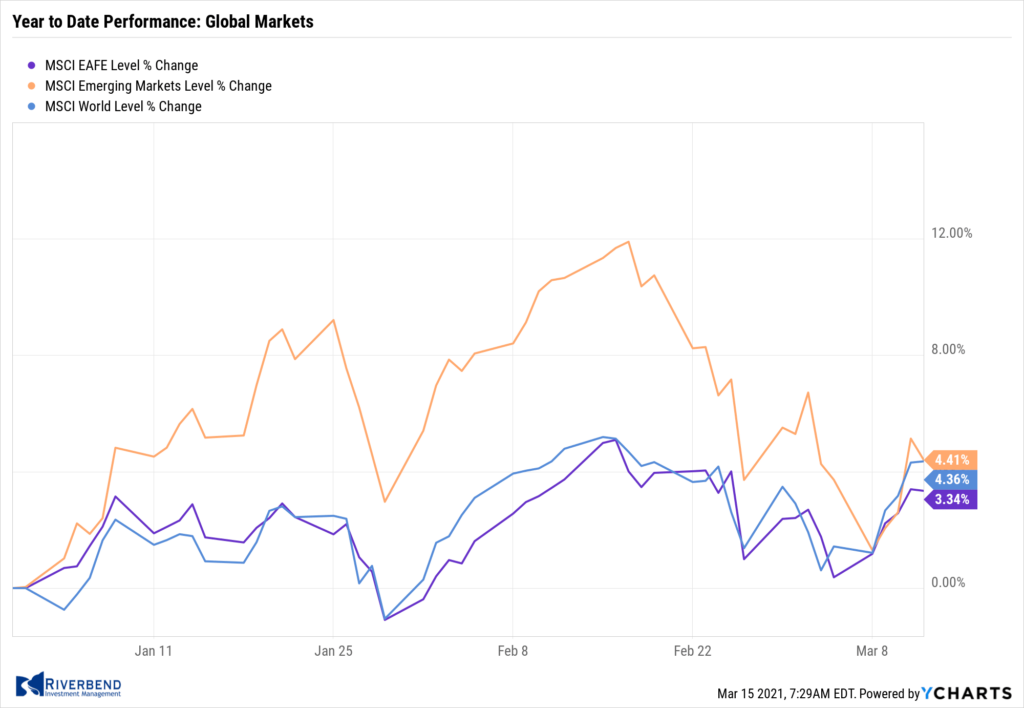
International markets finished the week predominantly to the upside. Canada’s TSX gained 2.6%, while the United Kingdom’s FTSE 100 added 2.0%.
On Europe’s mainland, France’s CAC 40 and Germany’s DAX rose by 4.6% and 4.6%, respectively. In Asia, China’s Shanghai Composite fell for a third consecutive week giving up ‑1.4%, while Japan’s Nikkei added 3.0%.
As grouped by Morgan Stanley Capital International, developed markets rose 2.2% and emerging markets added 0.3%.
Commodities: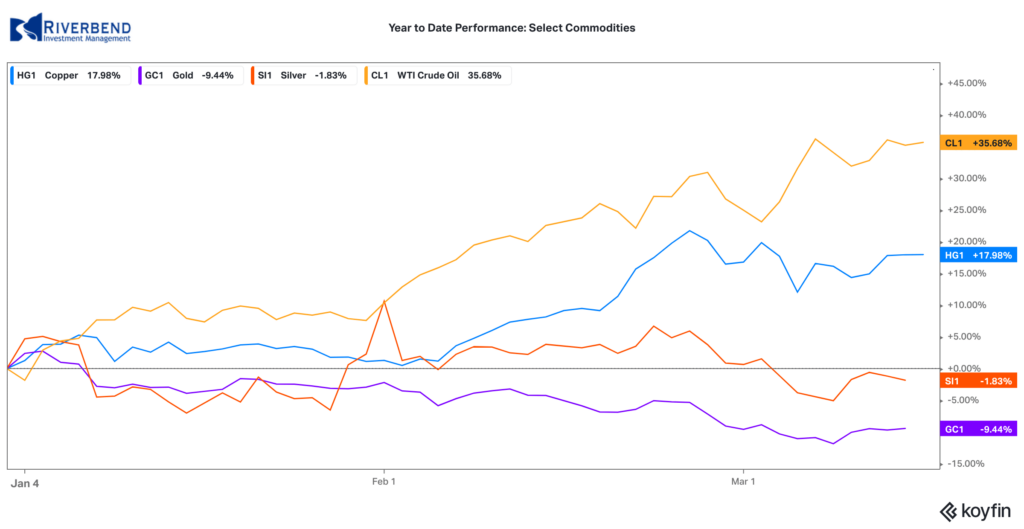
In commodities, Gold managed a rebound this week. The precious metal gained $21.30 an ounce finishing the week at $1719.80—an increase of 2.7%. Silver, which is often the more volatile of the two, gained 2.5% to $25.91 per ounce.
Oil consolidated after two weeks of gains. West Texas Intermediate crude oil finished down -0.7% to $65.61 per barrel.
The industrial metal copper, viewed by some analysts as a barometer of world economic health due to its wide variety of uses, finished the week up 1.6%.
U.S. Economic News: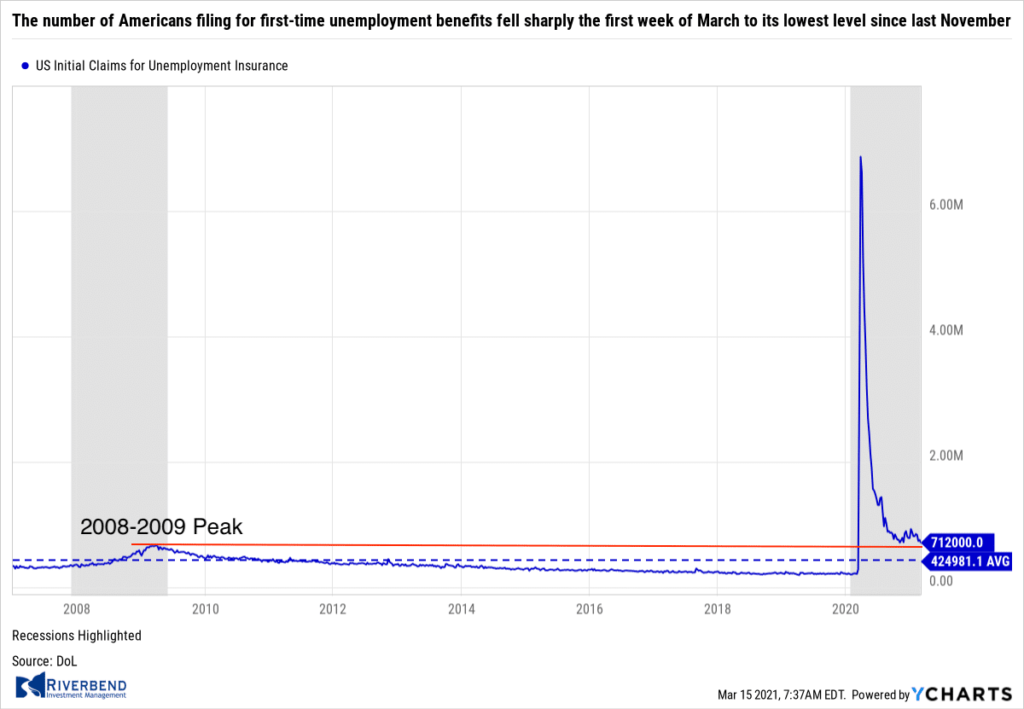
The number of Americans filing for first-time unemployment benefits fell sharply the first week of March to its lowest level since last November. The Department of Labor reported initial jobless claims fell by 42,000 to 712,000 in the week ended March 6. That’s near the lowest level of claims since the pandemic took hold.
Economists had expected claims to fall to 725,000. Meanwhile, the number of people already collecting benefits, so-called “continuing claims”, fell by 193,000 to 4.14 million. This is the lowest level of “continuing claims” since last March. Ian Shepherdson, chief economist at Pantheon Macroeconomics believes this is just the start of the improvement in the labor market. In a research note, Shepherdson wrote “A sustained, strong downward trend in claims is just beginning.” He expects claims to fall to 500,000 or less by the end of May.
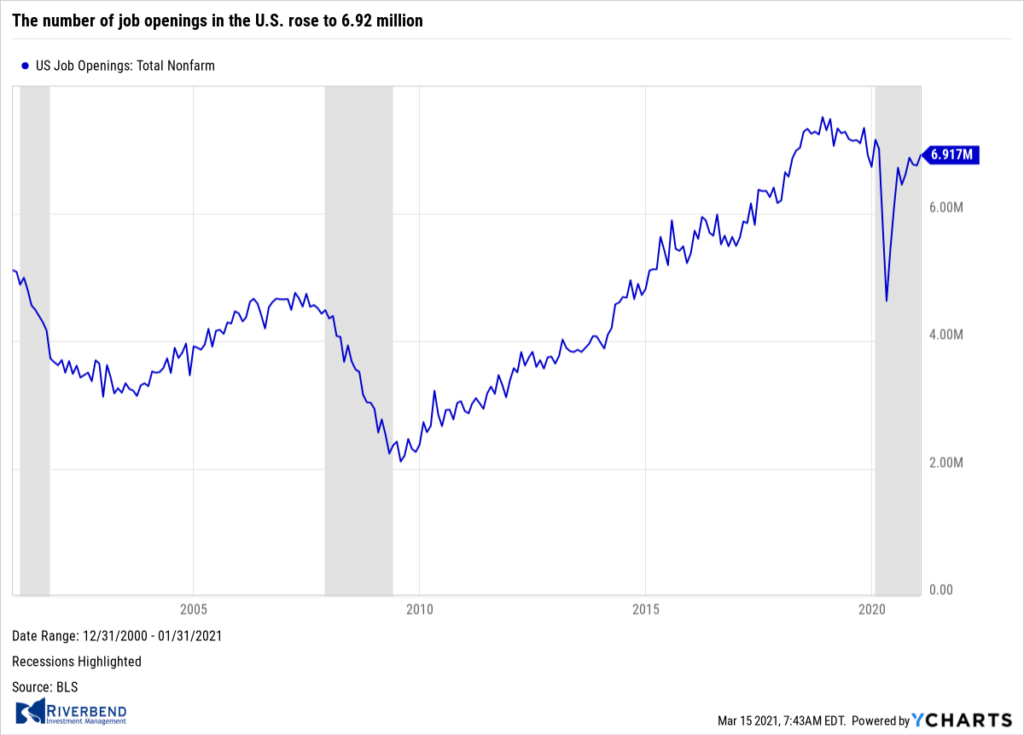 The number of job openings in the U.S. rose to 6.92 million in January, up from a revised 6.75 million in the previous month the Labor Department reported. Economists had expected job openings to rise to just 6.7 million. In the report, the highest numbers of job openings were in the education, services, and recreation sectors. In addition, the “quits rate”, closely watched because it’s assumed that workers would only quit a position for a more lucrative one, ticked down to 2.3% in January from 2.4% in the prior month.
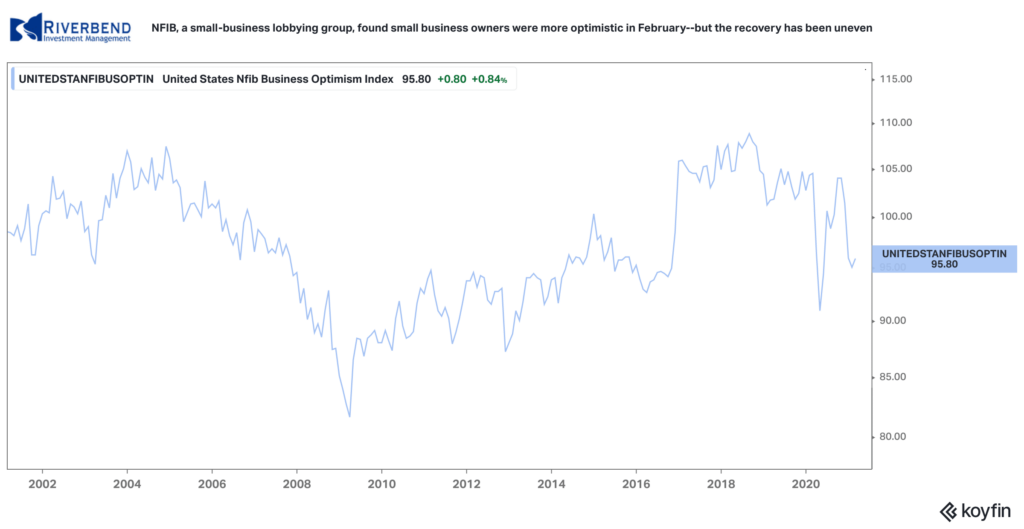 The National Federation of Independent Business (NFIB), a small-business lobbying group, found small business owners were more optimistic in February–but the recovery has been uneven. The NFIB reported its index rose 0.8 points to 95.8 in February. The reading fell short of the median forecast of 96.5.
In the report, companies said finding enough qualified workers was their biggest problem–even more than taxes or regulatory costs. More than half of the small businesses surveyed said they either hired or tried to hire workers last month, but many could not find suitable workers. Of note, the biggest share of small businesses in 12 years reported they are raising prices–a potential harbinger of coming inflation.
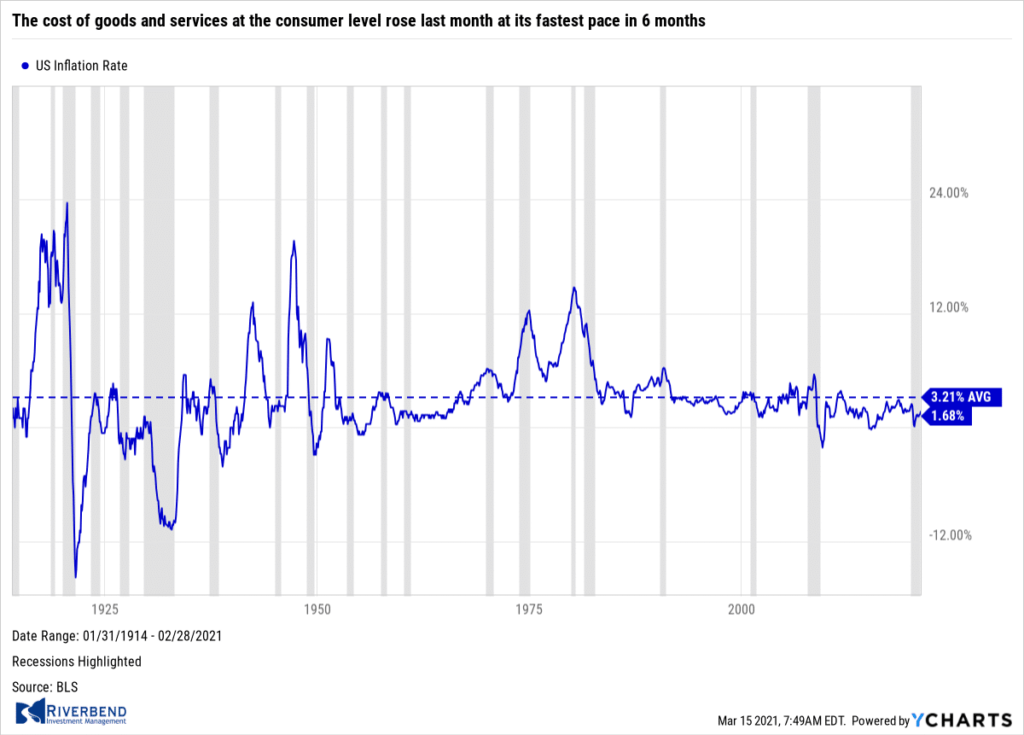 The cost of goods and services at the consumer level rose last month at its fastest pace in 6 months, predominantly due to higher prices at the gas pump. The Bureau of Labor Statistics reported the Consumer Price Index advanced 0.4% in February, matching estimates. The rate of inflation over the past year ticked up to 1.7% from 1.4%.
Economists are now expecting inflation to match or exceed its pre-pandemic level of 2.3% by the middle of the year as the U.S. recovery continues to gather momentum. The separate “core” measure of inflation that strips out the often-volatile food and energy categories, edged up a smaller 0.1%. The core rate has increased a more modest 1.3% in the past year, down from 1.4% in the prior month.
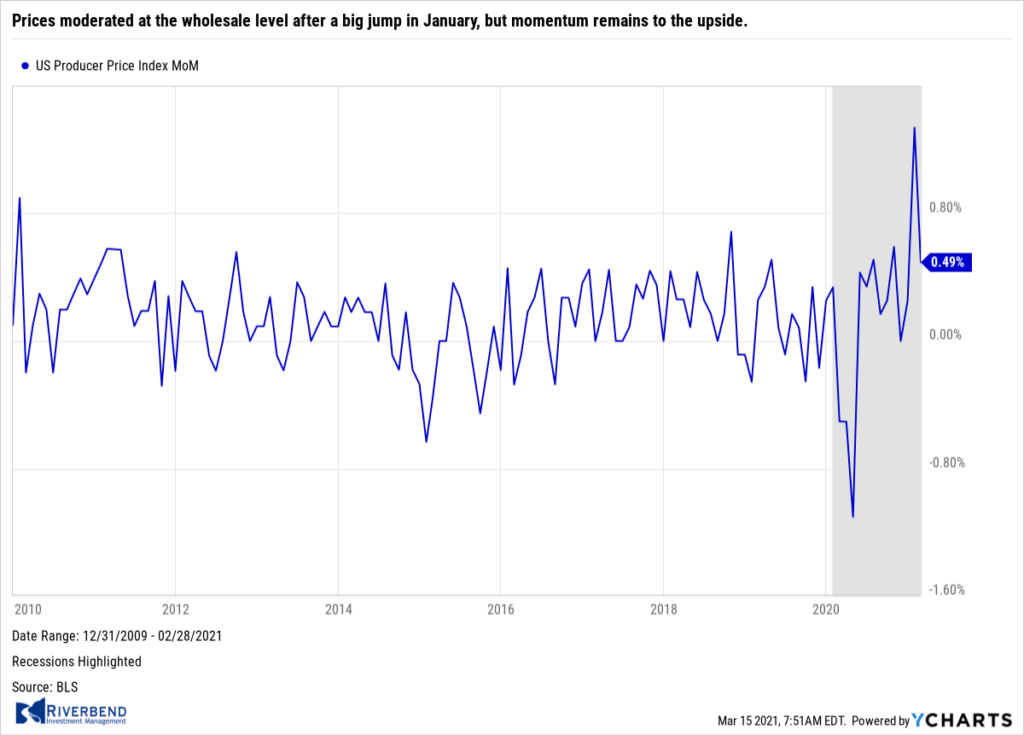 Prices moderated at the wholesale level after a big jump in January, but momentum remains to the upside. The Labor Department reported its Producer Price Index (PPI) for final demand rose 0.5% in February. The gain was in line with analysts’ forecasts. Wholesale inflation had jumped 1.3% in January, its biggest gain since 2009. The gain in February was driven by higher prices for energy, which climbed 6%.
In the 12 months through February, the PPI accelerated 2.8% after rising 1.7% in the prior month. The core PPI index rose 2.2% over the past 12 months, up 0.2%. Some economists anticipate the recent burst of government spending will cause the economy to overheat. Fed Chairman Jerome Powell has said he thinks the rise in prices will be “temporary”–and that it will take until the summer to know whether this is the case.
Chart of the Week: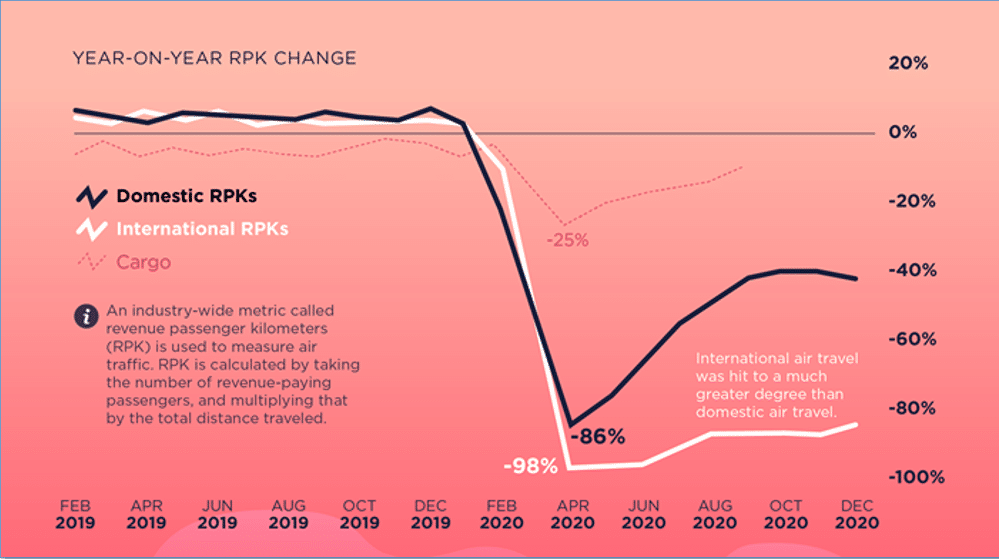
Source: VisualCapitalist.com
Air travel plummeted during the dark days of the Spring of 2020, dealing the air travel industry with the worst blow since World War II.
At the worst, domestic US air travel was down -86%, while international air travel was down -98%. Since then a rebound has taken shape, particularly for domestic US air travel, and at the turn of the year was down “just” 40%.
International air travel did not recover nearly to that degree, however, finishing the year still down more than 80% from pre-pandemic levels. Cargo fights, on the other hand, have recovered nearly all the way, and at their worst were down “only” 25%.
Riverbend Indicators Update:

Each week we post notable changes to the various market indicators we follow.
- As a reading of our Bull-Bear Indicator for U.S. Equities (comparative measurements over a rolling one-year timeframe), we remain in Cyclical Bull territory.
- Counting-up of the number of all our indicators that are ‘Up’ for U.S. Equities, the current tally is that four of four are Positive, representing a multitude of timeframes (two that can be solely days/weeks, or months+ at a time; another, a quarter at a time; and lastly, the {typically} years-long reading, that being the Cyclical Bull or Bear status).
Observations:
Last week, our short-term indicator turned positive after markets retreated from overbought levels the weeks before.
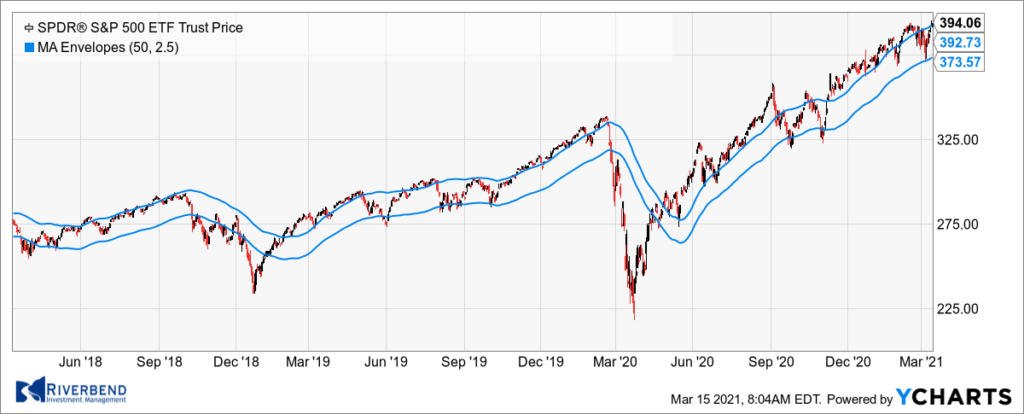
Currently, the upward trend of the market remains in good shape:
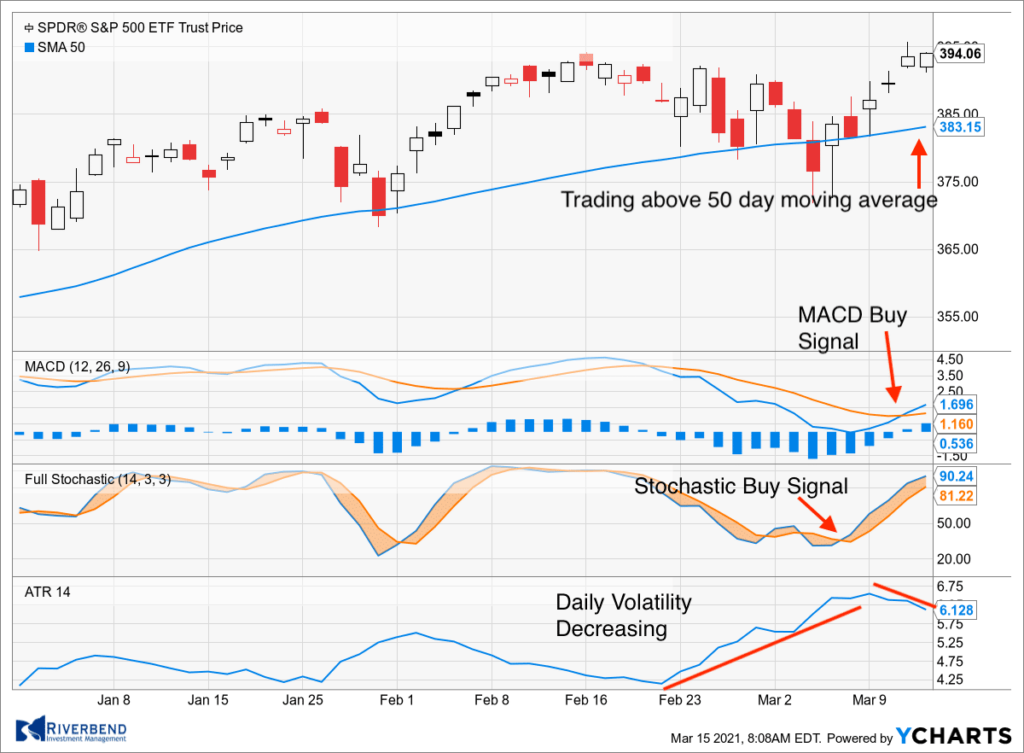
If we zoom in on the chart, we see multiple positives for the market:
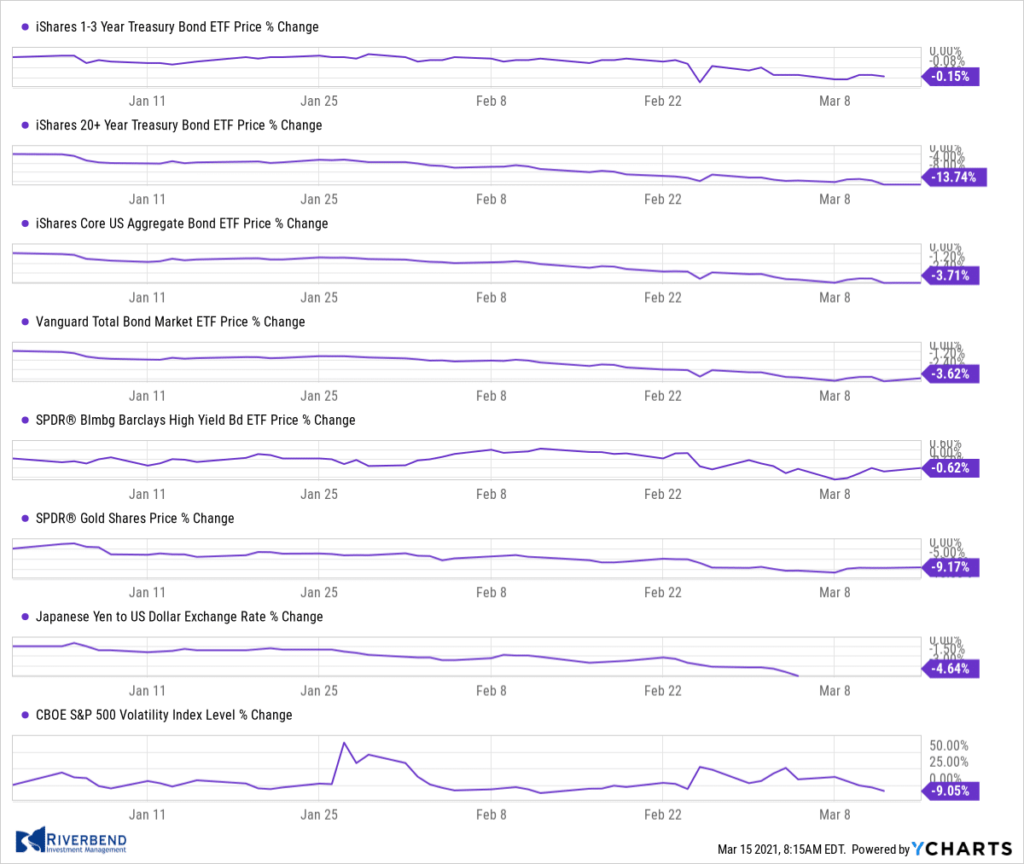
In addition, I am not seeing inflows into the so-called “safe haven” asset classes. These are areas of the market, where increased inflows occur when investors begin to worry about the market and exit equities.
Currently, all these asset classes are down for the year and continue to decline:
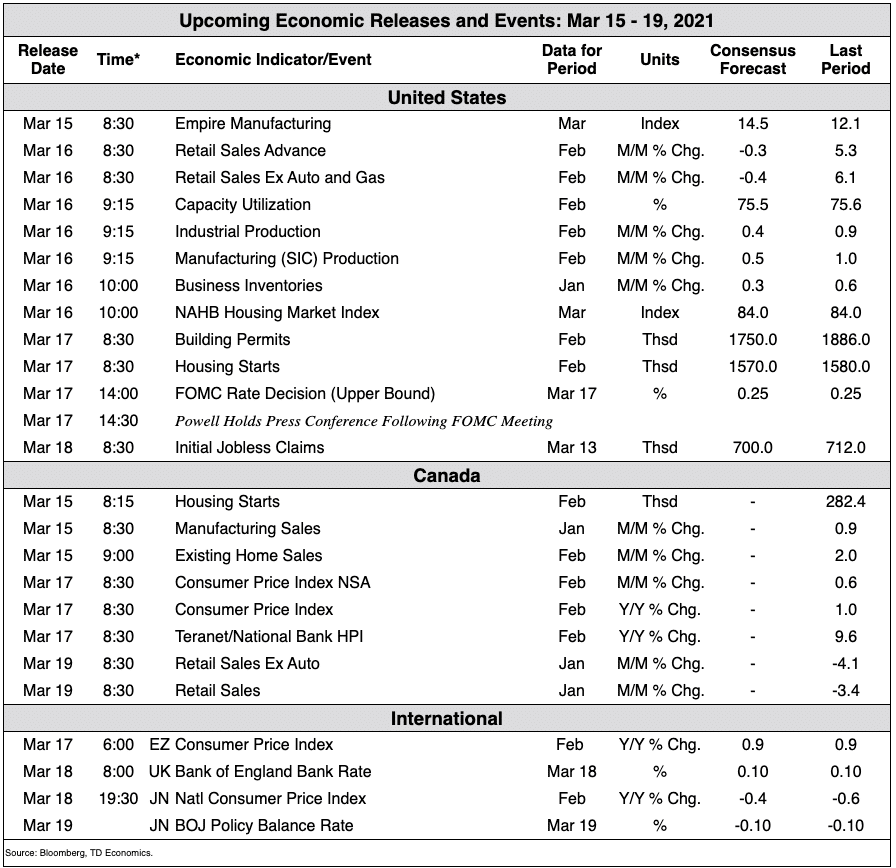
The Week Ahead:
(Sources: All index- and returns-data from Yahoo Finance; news from Reuters, Barron’s, Wall St. Journal, Bloomberg.com, ft.com, guggenheimpartners.com, zerohedge.com, ritholtz.com, markit.com, financialpost.com, Eurostat, Statistics Canada, Yahoo! Finance, stocksandnews.com, marketwatch.com, wantchinatimes.com, BBC, 361capital.com, pensionpartners.com, cnbc.com, FactSet.)
[/fusion_text][/fusion_builder_column][fusion_builder_column type=”1_6″ spacing=”” center_content=”no” link=”” target=”_self” min_height=”” hide_on_mobile=”small-visibility,medium-visibility,large-visibility” class=”” id=”” hover_type=”none” border_size=”0″ border_color=”” border_style=”solid” border_position=”all” box_shadow=”no” box_shadow_blur=”0″ box_shadow_spread=”0″ box_shadow_color=”” box_shadow_style=”” background_type=”single” gradient_start_position=”0″ gradient_end_position=”100″ gradient_type=”linear” radial_direction=”center” linear_angle=”180″ background_color=”” background_image=”” background_image_id=”” background_position=”left top” background_repeat=”no-repeat” background_blend_mode=”none” animation_type=”” animation_direction=”left” animation_speed=”0.3″ animation_offset=”” filter_type=”regular” filter_hue=”0″ filter_saturation=”100″ filter_brightness=”100″ filter_contrast=”100″ filter_invert=”0″ filter_sepia=”0″ filter_opacity=”100″ filter_blur=”0″ filter_hue_hover=”0″ filter_saturation_hover=”100″ filter_brightness_hover=”100″ filter_contrast_hover=”100″ filter_invert_hover=”0″ filter_sepia_hover=”0″ filter_opacity_hover=”100″ filter_blur_hover=”0″ last=”no”][/fusion_builder_column][/fusion_builder_row][/fusion_builder_container][fusion_builder_container hundred_percent=”no” hundred_percent_height=”no” hundred_percent_height_scroll=”no” hundred_percent_height_center_content=”yes” equal_height_columns=”no” menu_anchor=”” hide_on_mobile=”small-visibility,medium-visibility,large-visibility” status=”published” publish_date=”” class=”” id=”” border_size=”” border_color=”” border_style=”solid” margin_top=”” margin_bottom=”” padding_top=”” padding_right=”” padding_bottom=”” padding_left=”” gradient_start_color=”” gradient_end_color=”” gradient_start_position=”0″ gradient_end_position=”100″ gradient_type=”linear” radial_direction=”center” linear_angle=”180″ background_color=”” background_image=”” background_position=”center center” background_repeat=”no-repeat” fade=”no” background_parallax=”none” enable_mobile=”no” parallax_speed=”0.3″ background_blend_mode=”none” video_mp4=”” video_webm=”” video_ogv=”” video_url=”” video_aspect_ratio=”16:9″ video_loop=”yes” video_mute=”yes” video_preview_image=”” filter_hue=”0″ filter_saturation=”100″ filter_brightness=”100″ filter_contrast=”100″ filter_invert=”0″ filter_sepia=”0″ filter_opacity=”100″ filter_blur=”0″ filter_hue_hover=”0″ filter_saturation_hover=”100″ filter_brightness_hover=”100″ filter_contrast_hover=”100″ filter_invert_hover=”0″ filter_sepia_hover=”0″ filter_opacity_hover=”100″ filter_blur_hover=”0″][fusion_builder_row][/fusion_builder_row][/fusion_builder_container]


