U.S. Markets: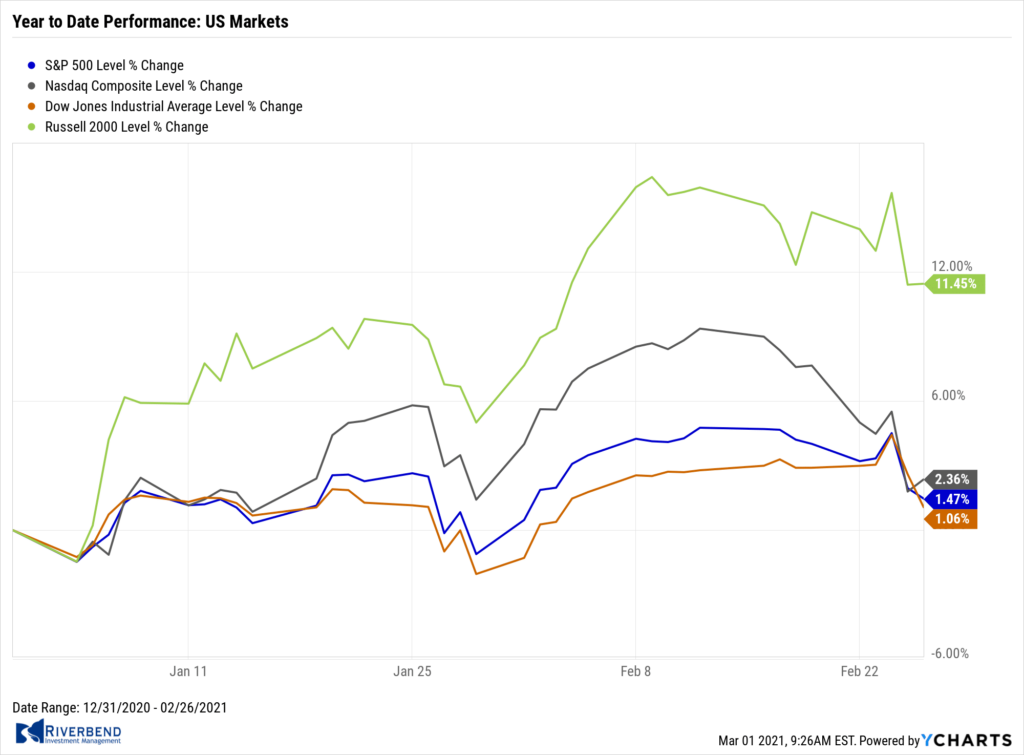
The major U.S. benchmarks pulled back sharply in response to a steep rise in longer-term treasury interest rates. The S&P 500 recorded its biggest weekly decline in a month, while the technology-heavy NASDAQ Composite suffered its worst drop since October.
The narrowly-focused Dow Jones Industrial Average shed 562 points finishing the week at 30,932, a decline of -1.8%. The NASDAQ Composite ended the week down -4.9%.
By market cap, the large cap S&P 500 declined -2.4%, while the mid cap S&P 400 and small cap Russell 2000 retreated -1.5% and ‑2.9%, respectively.
International Markets: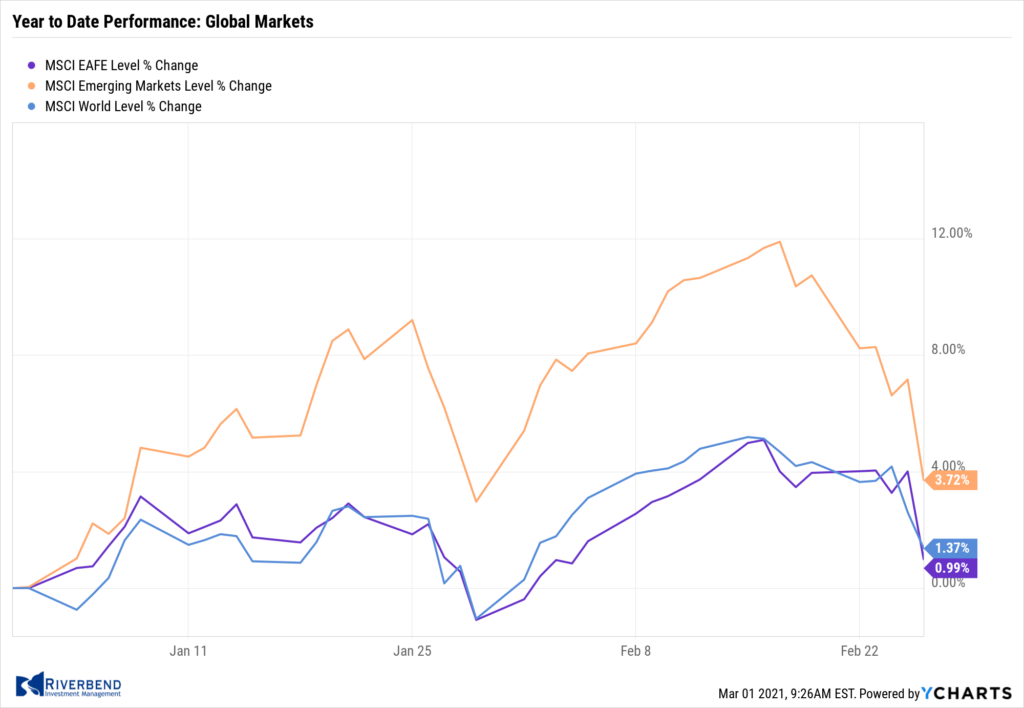
Major international markets sold off last week as well. Canada’s TSX declined ‑1.8%, while the United Kingdom’s FTSE ended down -2.1%.
On Europe’s mainland, France’s CAC 40 gave up -1.2% and Germany’s DAX shed -1.5%.
In Asia, China’s Shanghai Composite plunged -5.1%, and Japan’s Nikkei gave up -3.5%.
As grouped by Morgan Stanley Capital International, developed markets ended down -2.9%, while emerging markets dropped a rather large ‑6.6%.
Commodities: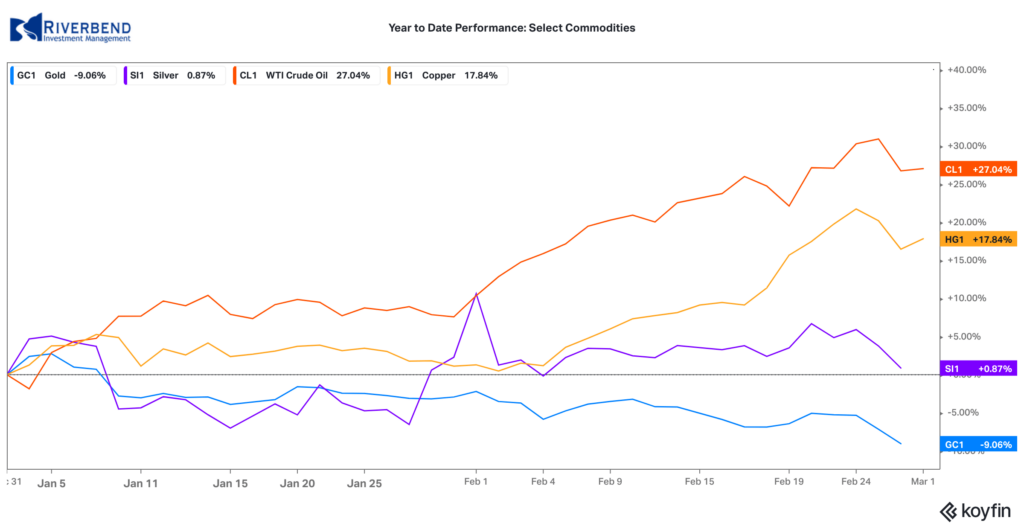
Precious metals were no port in the storm of declining equities markets, and sold off along with the broader indexes. Gold declined by -$48.60 to $1728.80 an ounce, a decline of -2.7%, while Silver fell -$0.81 to $26.44 an ounce, down -3.0%.
Energy continued its rise. West Texas Intermediate crude oil finished the week up 3.8% to $61.50 per barrel.
The industrial metal copper finished the week up 0.5%.
U.S. Economic News: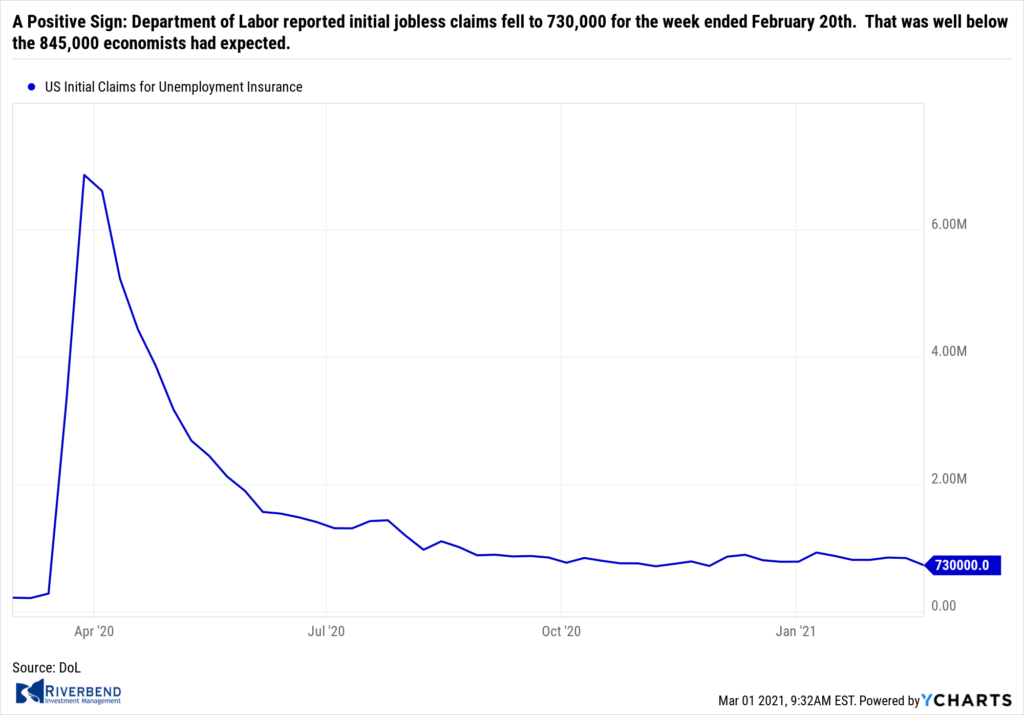
The number of Americans filing first-time unemployment benefits fell last week, but the labor market remains under pressure. The Department of Labor reported initial jobless claims fell to 730,000 for the week ended February 20th. That was well below the 845,000 economists had expected, and a sharp decline from the previous week. Despite the decline, jobless claims remain far above their levels from just before the onset of the coronavirus pandemic. Continuing claims decreased by 101,000 to 4.42 million, the lowest reading since March 21st of last year.
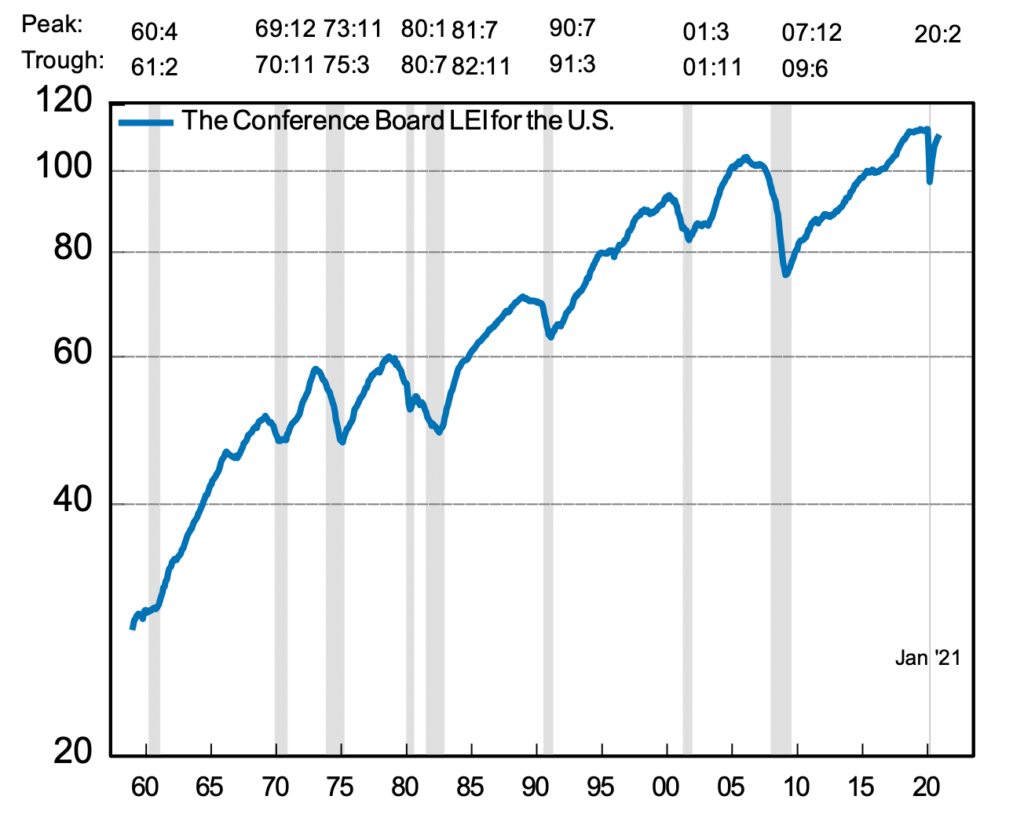 A recent Conference Board survey suggests that the U.S. economy is still growing and likely to accelerate in the next six months. The Conference Board reported its Leading Economic Index (LEI) rose 0.5% last month, following gains of 0.4% and 0.9% the prior two months.
The survey noted that as vaccinations accelerate, labor markets and overall growth are likely to continue improving. Ataman Ozyildirim, senior director of economic research at the board stated, “While the pace of increase in the U.S. LEI has slowed since mid-2020, January’s gains were broad-based and suggest economic growth should improve gradually over the first half of 2021.”
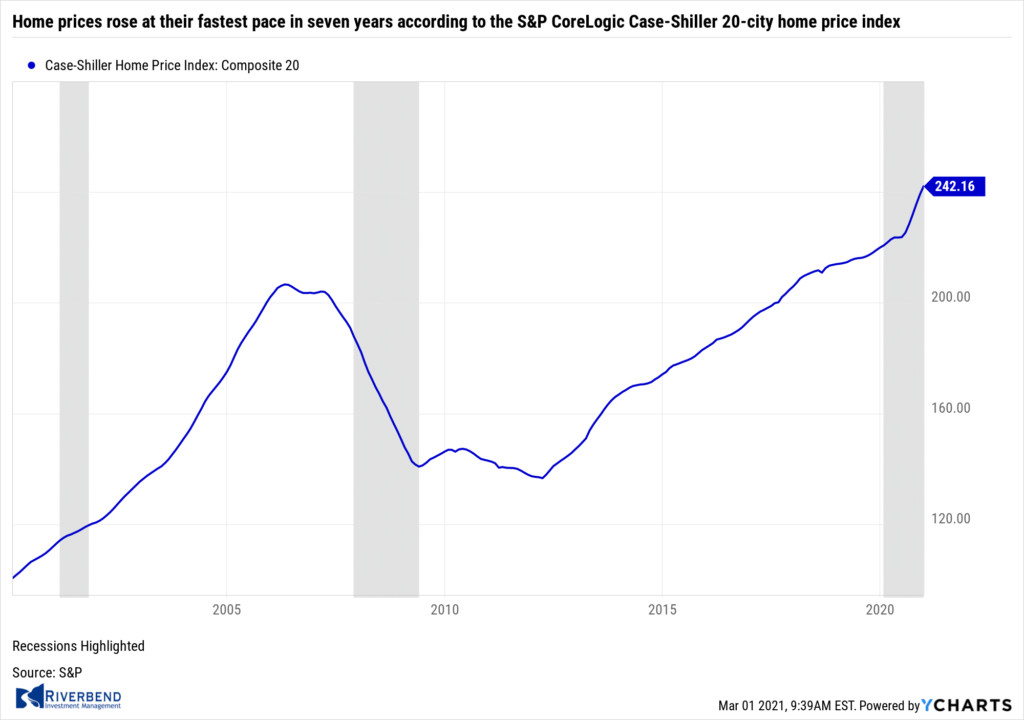 Home prices rose at their fastest pace in seven years according to a widely followed real estate barometer. The S&P CoreLogic Case-Shiller 20-city home price index posted a 10.1% annual gain in December—a 9.2% increase from the previous month. On a monthly basis, the index increased 0.8% between November and December.
Selma Hepp, deputy chief economist at CoreLogic noted it was the first time home prices saw a double-digit year-over-year increase since January 2014. Additionally, the broader S&P Corelogic Case-Shiller national price index, which covers the entire country, demonstrated a 10.4% gain year-over-year in December, up from 9.5% the prior month. Prices rose in 18 of the 20 large cities tracked by Case-Shiller. Phoenix, Ariz. experienced the largest price increase for the 19th consecutive month with a 14.4% increase, followed again by Seattle (13.6%) and San Diego (13%).
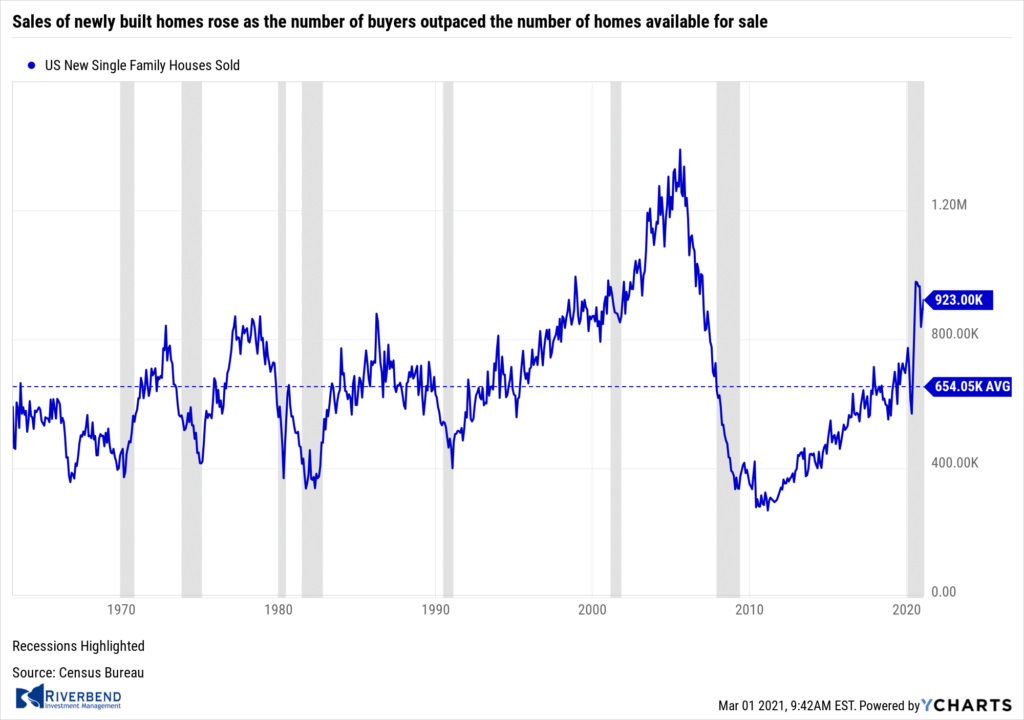 Sales of newly built homes rose as the number of buyers outpaced the number of homes available for sale. On an annual basis, sales of new homes were up 19% to 923,000 in January, according to data from the U.S. Census Bureau. That was 4.3% above the annual rate of 885,000 in December. The reading exceeded analyst expectations of 850,000.
In the details, new-home sales rose across most parts of the country led by a 12.6% increase in the Midwest. The Northeast was the only region where sales declined—dropping nearly 14%. Inventory dropped to just a four-month supply. A six-month supply of homes for sale is generally considered a “balanced” housing market. The median price of a new home was $346,400 in January, down 2% from December.
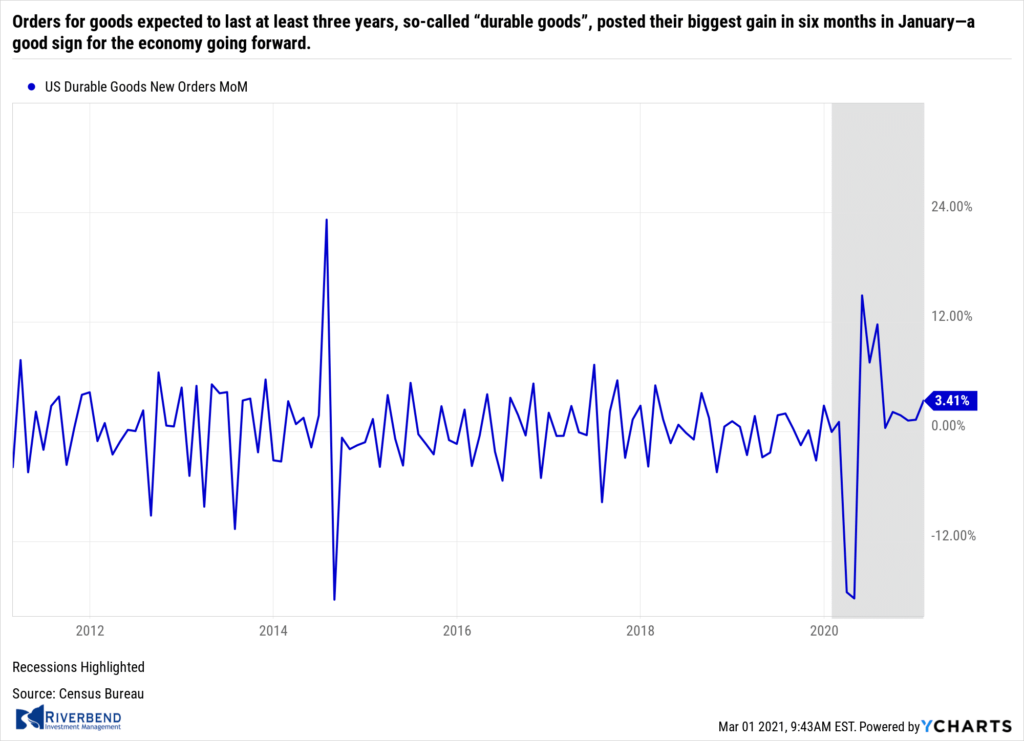 Orders for goods expected to last at least three years, so-called “durable goods”, posted their biggest gain in six months in January—a good sign for the economy going forward. The Census Bureau reported durable goods orders rose 3.4% last month. Economists had expected just a 1% advance. Orders have now returned to their pre-crisis levels, reflecting a shift among consumers towards the purchases of goods such as new cars, appliances, electronics and so forth.
The report shows the increase in orders was led by a large increase in orders for passenger jets and military hardware. Excluding transportation, durable-goods orders rose a more modest 1.4%. “Core orders”, which excludes the often volatile defense and transportation segments edged up 0.5% in January—its ninth consecutive increase.
In prepared remarks for the Senate Banking Committee, Federal Reserve Chair Jerome Powell said inflation and employment remain well below the Federal Reserve’s goals, meaning easy monetary policies are likely to stay in place.
In prepared remarks for the Senate Banking Committee, Federal Reserve Chair Jerome Powell said inflation and employment remain well below the Federal Reserve’s goals, meaning easy monetary policies are likely to stay in place. Despite a sharp rise in bond yields this year that has heightened concern over inflation, Powell said price pressures remain mostly muted and the economic outlook is still “highly uncertain”.
The economy is a long way from our employment and inflation goals, and it is likely to take some time for substantial further progress to be achieved,” the Fed chief said. The Fed last year revised its approach to inflation. In the past, it would levy preventive rate hikes when it saw unemployment drop, thinking that a stronger job market would push up prices. Now, it has adopted an approach in which it will allow inflation to average above 2% for a period of time before moving to tighten policy.
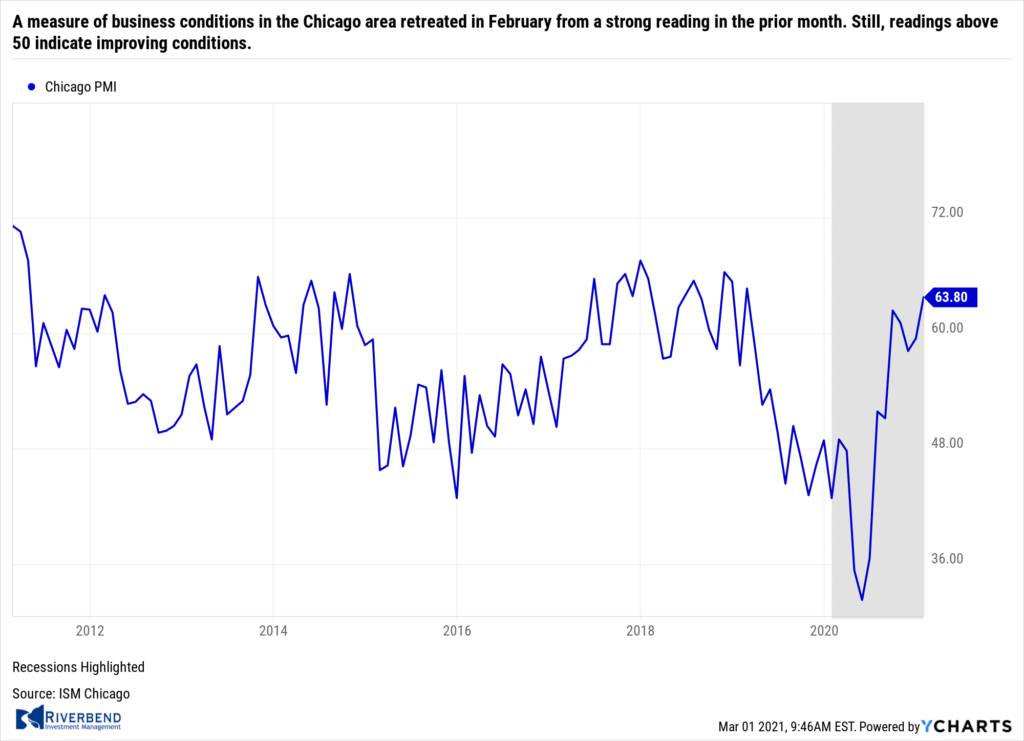 A measure of business conditions in the Chicago area retreated in February from a strong reading in the prior month. MNI Market News International reported its Chicago Business Barometer softened to 59.5 in February from a strong 63.8 reading in January. The January reading was its highest since July 2018. Economists had expected the index to slip, but only to 61. Still, readings above 50 indicate improving conditions.
The index, also known as the Chicago Purchasing Managers Index, is the last of the regional manufacturing indices before the closely-watched national ISM data for February is released next week. Lewis Alexander, chief economist at Nomura, expects a slight decline in the ISM manufacturing index to 58.5 in February. “While we think the manufacturing sector growth outlook remains firm, power outages [mostly in Texas and Plains states] and low temperatures led to temporary disruptions in production,” he said in a note to clients.
Chart of the Week: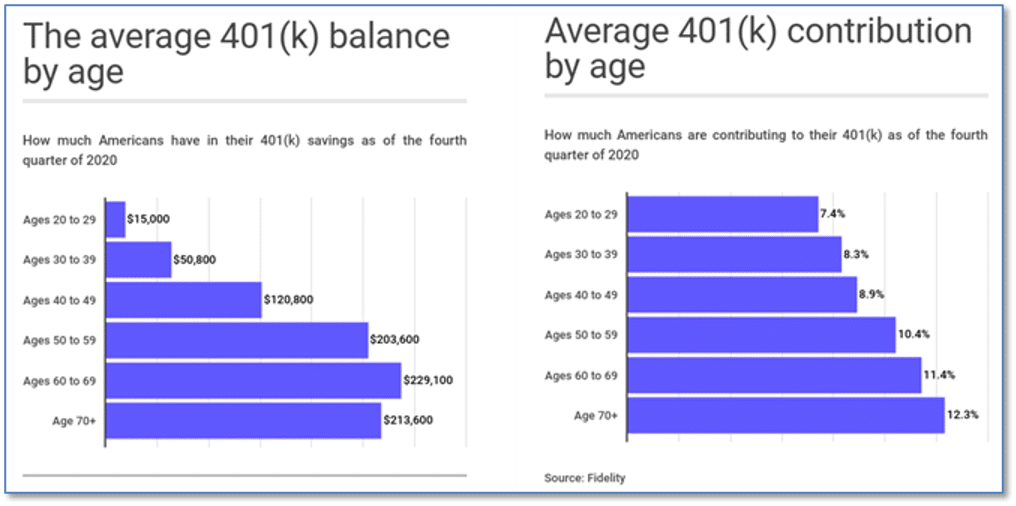
Finally, for most young people, retirement is pretty much the last thing on their minds as they enter the workforce. Still, almost everyone knows that the sooner saving for retirement is begun, the better off they’ll eventually be.
Last year was a tough year financially for most average Americans. Between March 2020 and January 2021, around 1.6 million people took money out of their 401(k) plans under the CARES Act. However, despite the volume of withdrawals, around a third of 401(k) savers managed to increase their savings.
So how much money does the average American now have in his/her retirement account? Fidelity provided CNBC with the average amount of money Americans have saved in retirement accounts as of the fourth quarter of 2020, as well as contribution by % of salary, broken out by age cohort.
Riverbend Indicators Update:

Each week we post notable changes to the various market indicators we follow.
- As a reading of our Bull-Bear Indicator for U.S. Equities (comparative measurements over a rolling one-year timeframe), we remain in Cyclical Bull territory.
- Counting-up of the number of all our indicators that are ‘Up’ for U.S. Equities, the current tally is that three of four are Positive, representing a multitude of timeframes (two that can be solely days/weeks, or months+ at a time; another, a quarter at a time; and lastly, the {typically} years-long reading, that being the Cyclical Bull or Bear status).
Observations:
Last week, one of our short-term market indicators turned negative. This indicator is based on the short-term overbought/oversold condition and tends to be a very volatile indicator.
However, when we do have an indicator turn negative, people often ask “Is this the start of a larger decline?”
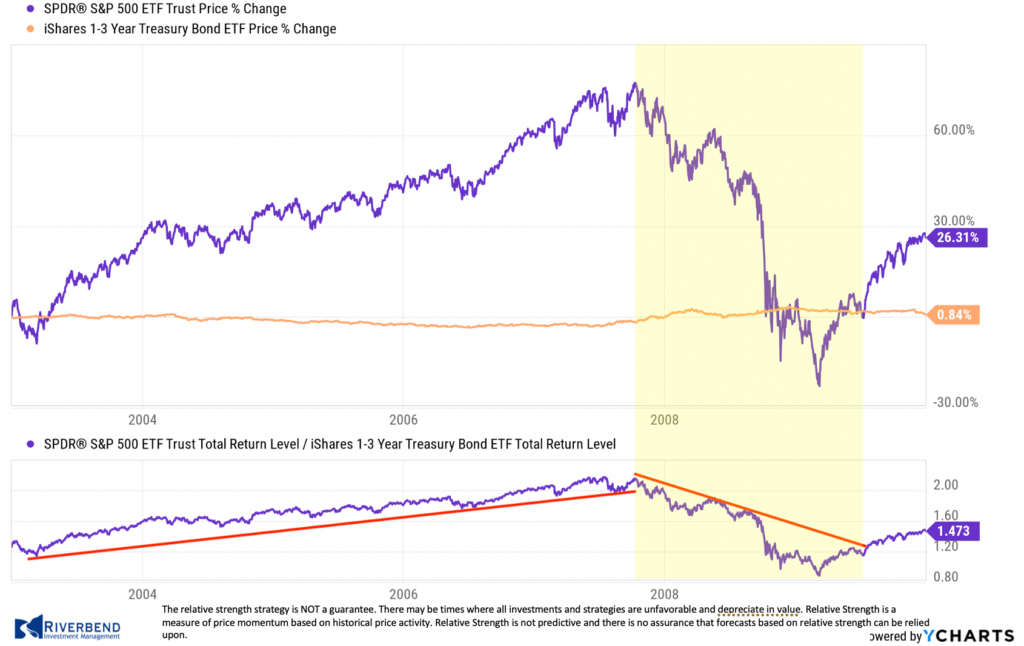
To answer that, I like to look at the relative strength relationship between stocks and bonds.
For those unfamiliar with relative strength, Investopedia defines it as:
Relative strength is a technique used in momentum investing and identifying value stocks. It consists of investing in securities that have performed well, relative to their market or benchmark.
We can see historically how this relationship breaks down during past bear markets:
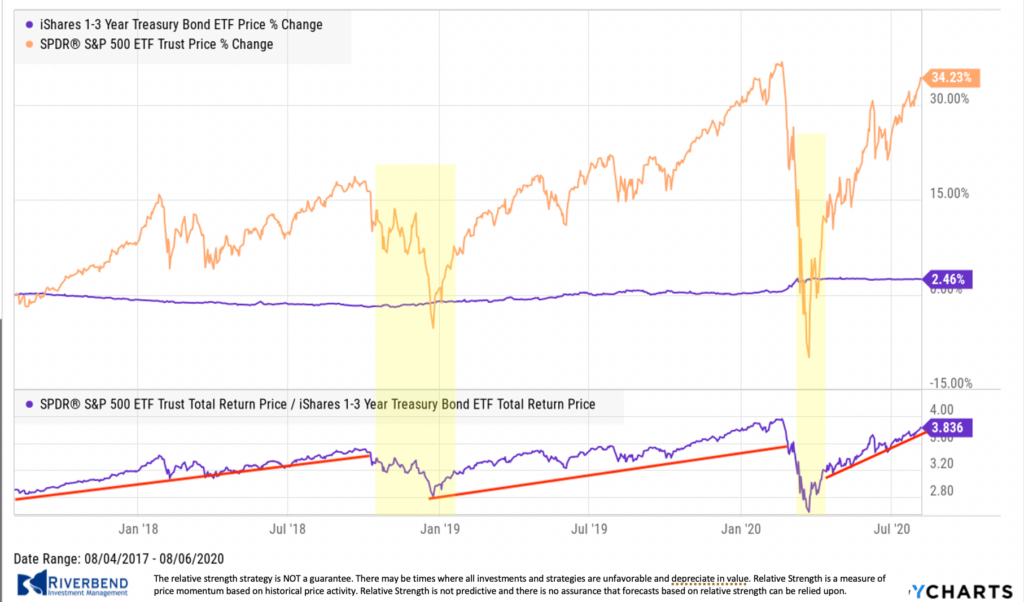
Currently, I am not seeing a breakdown in that relationship:
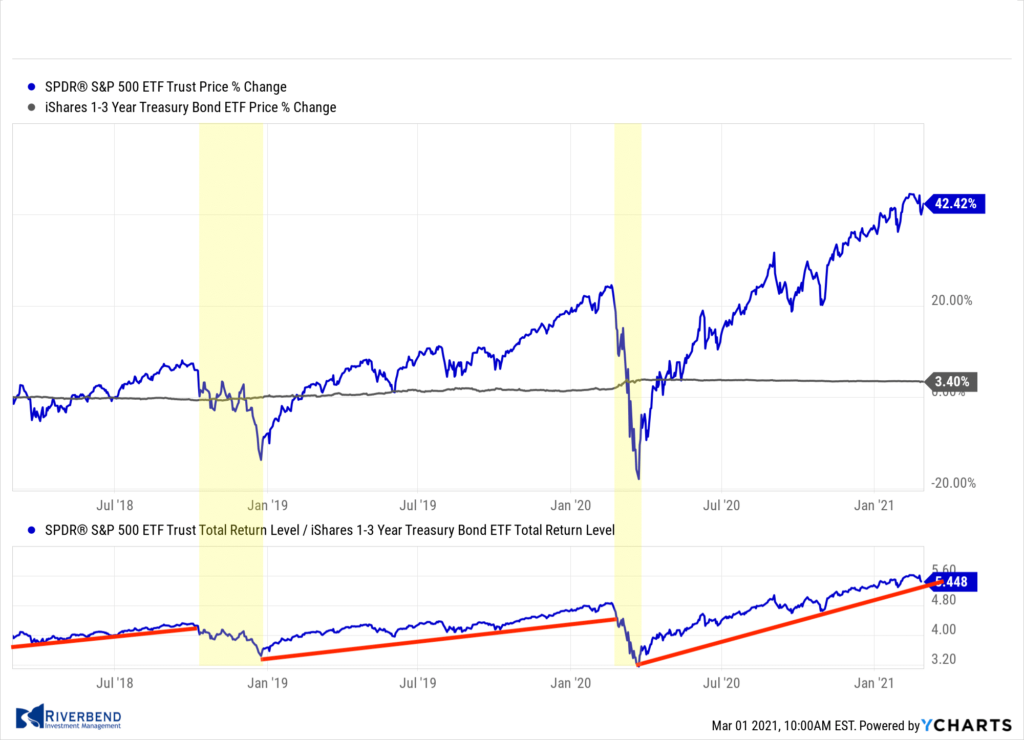
So for now, last week’s pullback in the market looks to be short-term profit-taking driven by the algorithms and we may see investors start “buying the dips” shortly.
The Week Ahead:
Monday:
- U.S. ISM Manufacturing PMI 58.7 exp, 58.7 prior
- U.S. Construction Spending m/m +0.7% exp, +1.0% prior
- ISM Manufacturing Prices 80.0 exp, 82.1 prior
Tuesday:
- German Retail Sales m/m +0.9% exp, -9.6% prior
- U.S. IBD/TIPP Economic Optimism 52.1 exp, 51.9 prior
- U.S. Wards Total Vehicles Sales 16.4 exp, 16.6 prior
- Fed Chair Powell Testifies
Wednesday:
- U.S. ADP Non-Farm Employment Change +170k exp, +174k prior
- U.S. ISM Services PMI 58.7 exp, 58.7 prior
Thursday:
- OPEC-JMMC Meetings
- U.S. Unemployment Claims N/A exp, 730k prior
- U.S. Factory Orders m/m +1.0% exp, +1.1% prior
Friday:
- U.S. Non-Farm Employment Change +133k exp, +49k prior
- U.S. Unemployment Rate 6.4% exp, 6.3% prior
- U.S. Consumer Credit m/m 13.5 bln exp, 9.7 bln prior
(Sources: All index- and returns-data from Yahoo Finance; news from Reuters, Barron’s, Wall St. Journal, Bloomberg.com, ft.com, guggenheimpartners.com, zerohedge.com, ritholtz.com, markit.com, financialpost.com, Eurostat, Statistics Canada, Yahoo! Finance, stocksandnews.com, marketwatch.com, wantchinatimes.com, BBC, 361capital.com, pensionpartners.com, cnbc.com, FactSet.)


