[fusion_builder_container hundred_percent=”no” equal_height_columns=”no” menu_anchor=”” hide_on_mobile=”small-visibility,medium-visibility,large-visibility” class=”” id=”” background_color=”” background_image=”” background_position=”center center” background_repeat=”no-repeat” fade=”no” background_parallax=”none” parallax_speed=”0.3″ video_mp4=”” video_webm=”” video_ogv=”” video_url=”” video_aspect_ratio=”16:9″ video_loop=”yes” video_mute=”yes” overlay_color=”” video_preview_image=”” border_size=”” border_color=”” border_style=”solid” padding_top=”” padding_bottom=”” padding_left=”” padding_right=””][fusion_builder_row][fusion_builder_column type=”1_6″ spacing=”” center_content=”no” link=”” target=”_self” min_height=”” hide_on_mobile=”small-visibility,medium-visibility,large-visibility” class=”” id=”” hover_type=”none” border_size=”0″ border_color=”” border_style=”solid” border_position=”all” border_radius=”” box_shadow=”no” dimension_box_shadow=”” box_shadow_blur=”0″ box_shadow_spread=”0″ box_shadow_color=”” box_shadow_style=”” padding_top=”” padding_right=”” padding_bottom=”” padding_left=”” margin_top=”” margin_bottom=”” background_type=”single” gradient_start_color=”” gradient_end_color=”” gradient_start_position=”0″ gradient_end_position=”100″ gradient_type=”linear” radial_direction=”center” linear_angle=”180″ background_color=”” background_image=”” background_image_id=”” background_position=”left top” background_repeat=”no-repeat” background_blend_mode=”none” animation_type=”” animation_direction=”left” animation_speed=”0.3″ animation_offset=”” filter_type=”regular” filter_hue=”0″ filter_saturation=”100″ filter_brightness=”100″ filter_contrast=”100″ filter_invert=”0″ filter_sepia=”0″ filter_opacity=”100″ filter_blur=”0″ filter_hue_hover=”0″ filter_saturation_hover=”100″ filter_brightness_hover=”100″ filter_contrast_hover=”100″ filter_invert_hover=”0″ filter_sepia_hover=”0″ filter_opacity_hover=”100″ filter_blur_hover=”0″ last=”no”][/fusion_builder_column][fusion_builder_column type=”2_3″ layout=”1_1″ background_position=”left top” background_color=”” border_size=”” border_color=”” border_style=”solid” border_position=”all” spacing=”yes” background_image=”” background_repeat=”no-repeat” padding_top=”” padding_right=”” padding_bottom=”” padding_left=”” margin_top=”0px” margin_bottom=”0px” class=”” id=”” animation_type=”” animation_speed=”0.3″ animation_direction=”left” hide_on_mobile=”small-visibility,medium-visibility,large-visibility” center_content=”no” last=”no” min_height=”” hover_type=”none” link=””][fusion_text]
U.S. Markets:
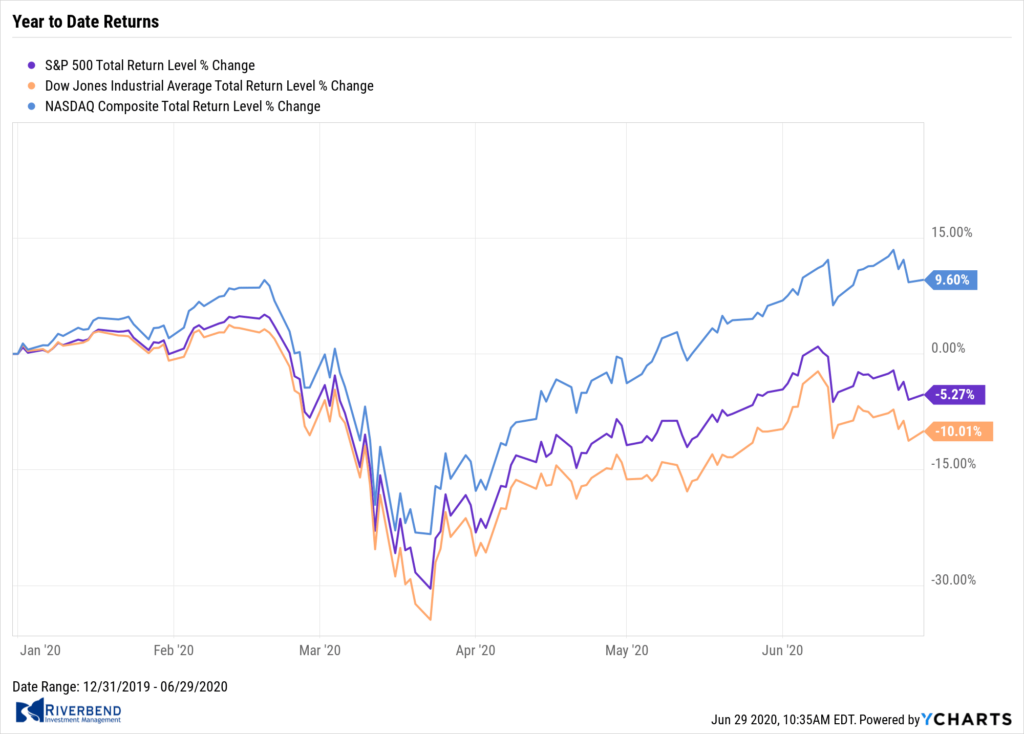
Worries over the resurgence of the coronavirus offset the enthusiasm over some positive U.S. economic reports; most U.S. markets gave back all of the previous week’s gains—and then some.
The Dow Jones Industrial Average fell 859 points finishing the week at 25,016—a decline of -3.3%. The technology-heavy Nasdaq Composite gave up half of last week’s gain declining -1.9%.
By market cap, the large cap S&P 500 retreated -2.9%, while the mid cap S&P 400 fell -3.7%, and the small cap Russell 2000 ended down -2.8%.
International Markets: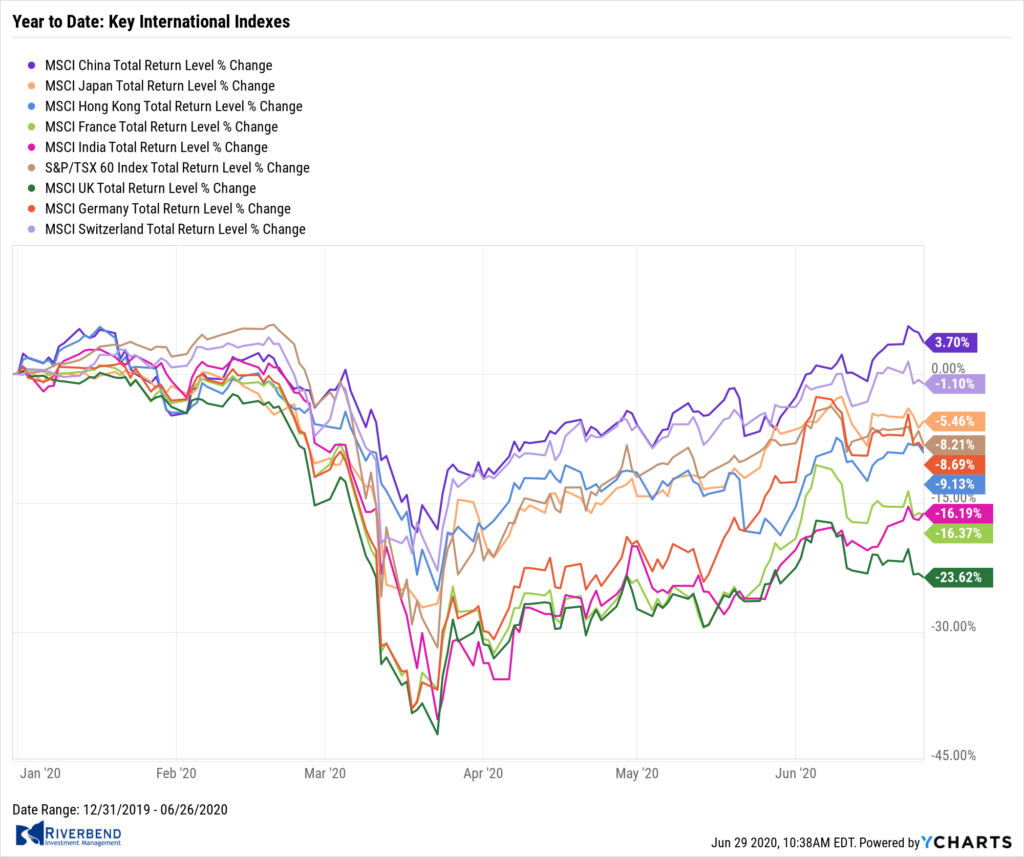
Major international markets finished mostly to the downside. Canada’s TSX fell -1.8%, while the UK’s FTSE 100 declined -2.1%.
On Europe’s mainland, France’s CAC 40 retreated -1.4%, Germany’s DAX gave up ‑2.0%, and Italy’s Milan FTSE ended down -2.5%.
In Asia, China’s Shanghai Composite managed a 0.4% gain, while Japan’s Nikkei ticked up 0.1%.
As grouped by Morgan Stanley Capital International, developed markets finished the week down -0.9%, while emerging markets rose a scant 0.1%.
Commodities: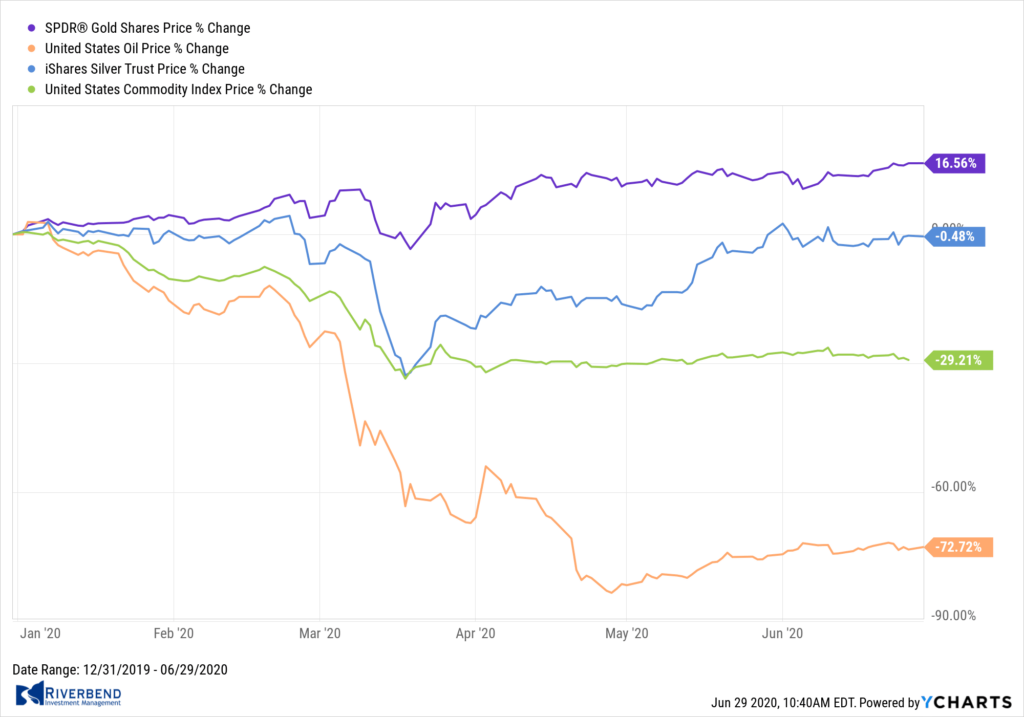
Precious metals finished the week up, thanks to the weakness in the equities markets. Gold rose 1.6% last week to $1780.30 per ounce, while Silver added 1.1% to $18.03.
Oil had its second down week in nine finishing down -3.4% to $38.49 per barrel of West Texas Intermediate crude.
The industrial metal copper, viewed by some analysts as a barometer of global economic health due to its wide variety of uses, rose for a sixth consecutive week finishing up 2.6%.
U.S. Economic News: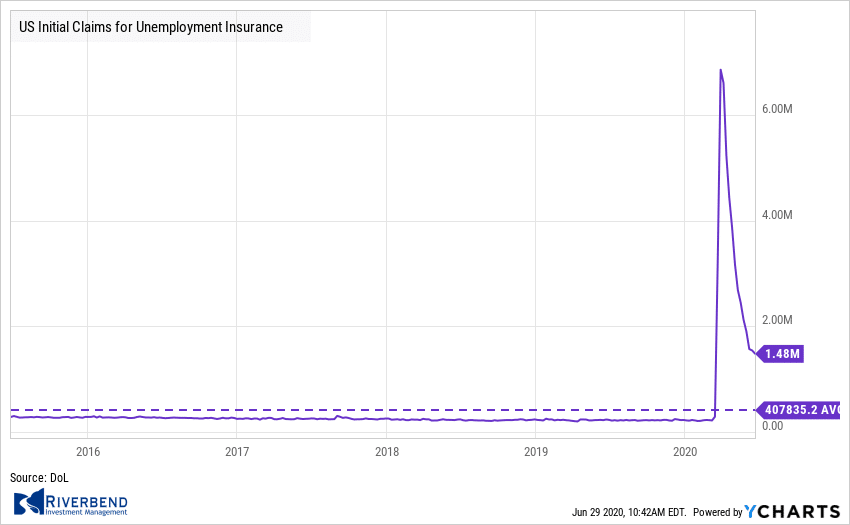
The number of Americans claiming first-time unemployment benefits fell last week, the 12th decline in a row. The Labor Department reported initial claims for unemployment insurance declined by 60,000 to 1.480 million. Economists had expected a reading of just 1.35 million.
Despite the improvement, claims remain far above the levels seen at the beginning of the year (between 200,000-300,000). Continuing claims, which counts the number of people already receiving benefits, declined for a third consecutive week. Continuing claims fell by 767,000 to 19.522 million, indicating the peak was likely seen in early May. More than 50 million applications for benefits have been filed in the past three months.
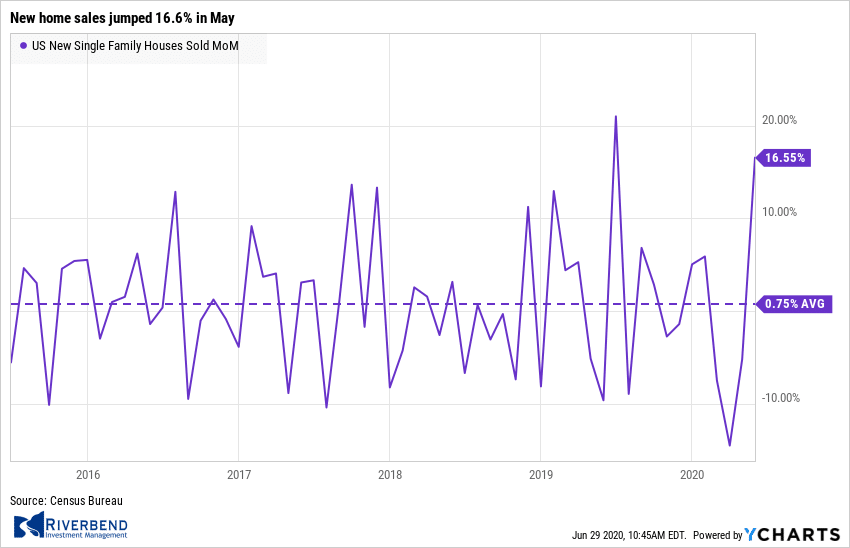 New home sales surged last month as pent-up demand to purchase a home was unleashed. New home sales jumped 16.6% in May, the government reported, the most in nearly a year and the second-largest gain since 1992 to a 676,000 unit annual rate. The reading exceeded the consensus forecast for an increase of 640,000.
Three of the four regions posted double-digit gains in May, however sales fell in the Midwest by 6.4%. The median sales price for new homes sold in May was $317,900. At the end of the month, there were 318,000 new homes estimated to be up for sale, which equates to a 5.6-month supply. A 6-month supply of homes is generally considered to be indicative of a balanced market.
Sales of previously-owned homes continued to slide in May as the coronavirus continued to weigh on the U.S. real-estate market. The National Association of Realtors (NAR) reported existing-home sales occurred at a seasonally-adjusted annualized pace of 3.91 million. The reading was a 9.7% decline from April, and its lowest level since in 10 years. Compared with the same time last year, sales were down almost 27%.
Lawrence Yun, chief economist for the NAR put his best construction on the report’s release writing, “Home sales will surely rise in the upcoming months with the economy reopening, and could even surpass one-year-ago figures in the second half of the year.” All regions reported a decrease, but sales fell most notably in the Northeast where they were down 13%.
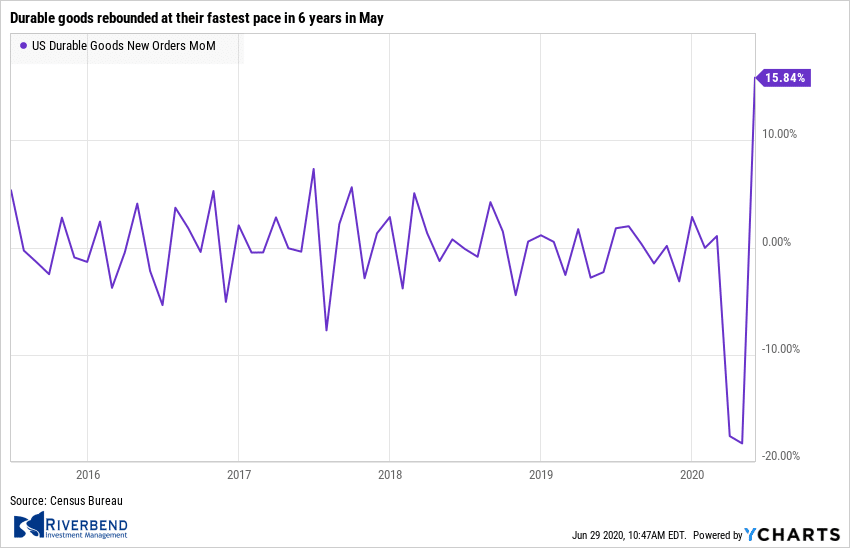 Orders for goods expected to last at least three years, so-called “durable goods”, rebounded at their fastest pace in 6 years in May. The Department of Commerce reported durable goods orders rose 15.8% last month. Economists had expected an increase of 9.8%.
The rebound in manufacturing and other key parts of the economy suggests the U.S. may have already exited what could turn out to be the shortest and deepest recession in American history. In the details, orders for automakers climbed 28% last month, although they still remain well below pre-crisis levels.
Of note, aircraft manufacturers (and Boeing in particular) got good news of sorts. The giant manufacturer reported essentially no new orders in May, but cancellations declined. That accounted for almost half of the increase in durable-goods orders last month. Stripping out cars and planes (ex-transportation), orders grew by 4%–the most in almost ten years.
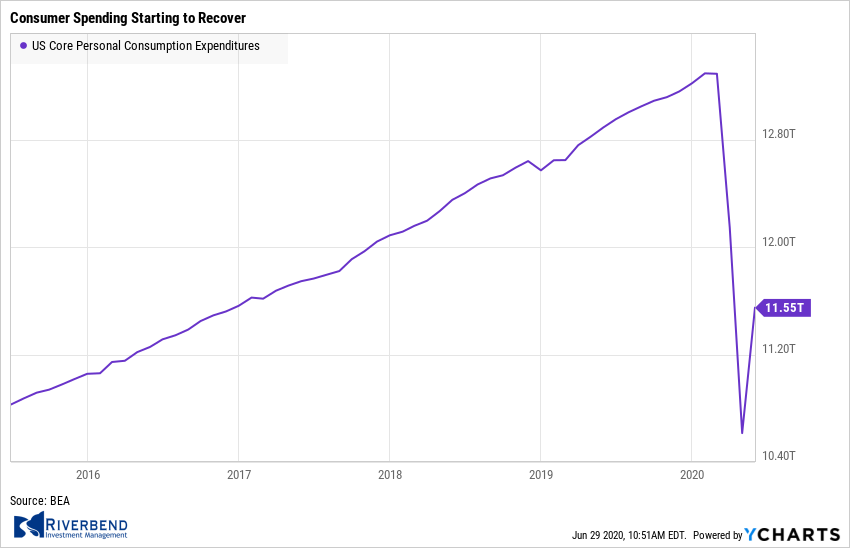 Consumer spending surged last month as the economy reopened, according to the latest report from the government. The Commerce Department reported its Personal Consumption Expenditures (PCE) index rebounded a record 8.2% in May. Analysts had expected an even larger 8.7% gain.
The index had nosedived in April by a revised -12.6% amid widespread shutdowns triggered by the COVID-19 outbreak. However, despite the positive report Tim Quinlan and Shannon Seery, economists at Wells Fargo, reminded investors, “Before we celebrate the return of the consumer prematurely, [keep in mind that] personal consumption expenditures are still down 11.7 percent from their February peak.”
A pair of economic reports from research firm Markit showed the economic downturn in the U.S. appears to be nearing its end. IHS Markit reported both its ‘services’ and ‘manufacturing’ flash Purchasing Managers’ Indexes (PMI) hit 4-month highs this month. The flash U.S. service sector PMI rose 9.2 points to 46.7 in June, while the manufacturing sector PMI advanced 9.8 points to 49.6.
Though both readings improved significantly, they remained below the crucial 50-level which indicates worsening conditions. The flash estimate is typically based on approximately 85%-90% of total survey responses each month. The composite index rose to 46.8 in June from 37 in the prior month, still in the sub-50 contraction territory.
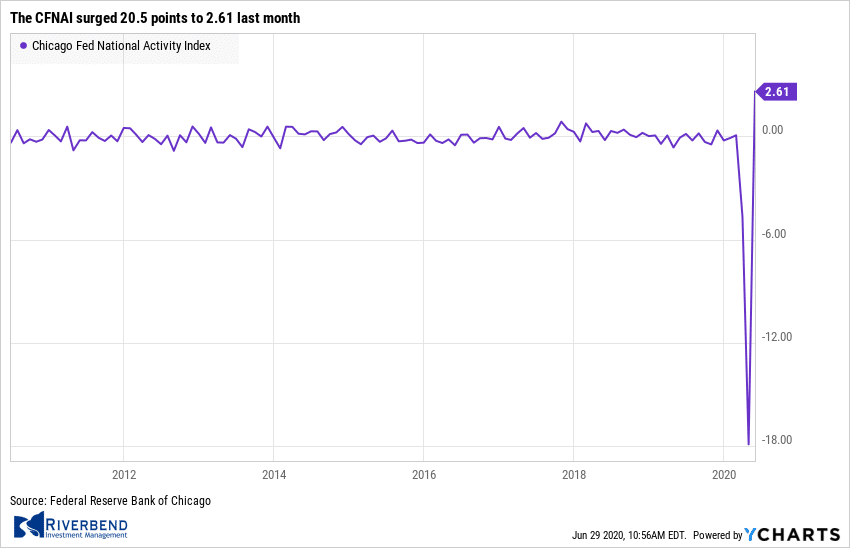 The Chicago Fed reported its National Activity Index (CFNAI) rebounded in May by both a record increase and to a record high level as the economy began reopening after the pandemic-related shutdown. The CFNAI surged 20.5 points to 2.61 last month. The index’s three-month moving average, used to smooth the monthly volatility, improved to a -6.65 reading from -7.5 in April.
The index is a weighted average of 85 economic indicators with 72 of its indicators improving in May while 13 deteriorated. A zero value for the index indicates the national economy is expanding at its historical trend rate of growth.
Chart of the Week:
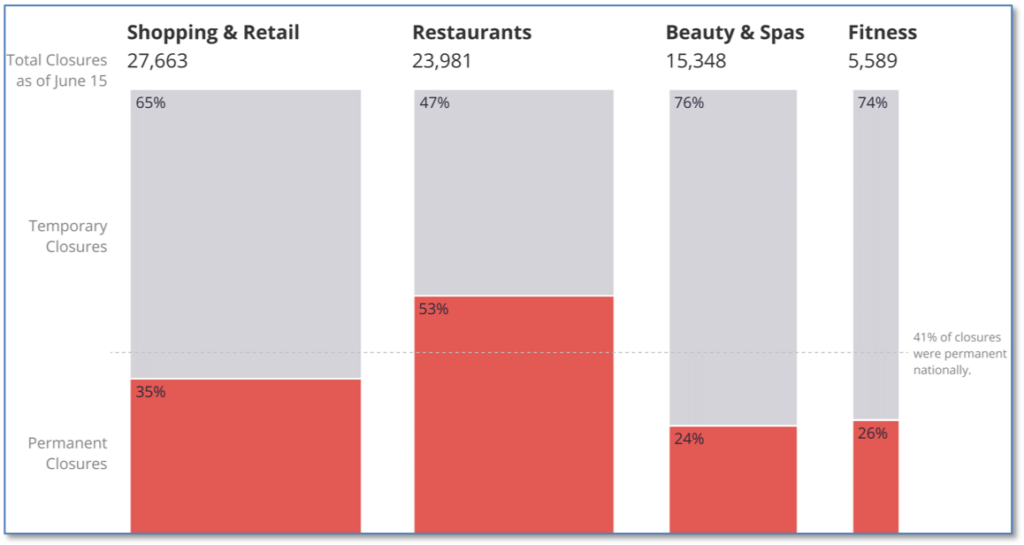
Can this be true? If so, the US economy may be in deeper trouble than most think.
Review website ‘Yelp’ reported that of all business closures since March 1, 41% are permanent closures.
The Restaurants category is the hardest hit, where Yelp said a whopping 53% are reported to be permanent closures. That was followed by Shopping & Retail at 35% permanent closures, Fitness at 26% permanent closures, and Beauty & Spas at 24% permanent closures. (chart from yelpeconomicaverage.com)
Riverbend Indicators Update:
Each week we post notable changes to the various market indicators we follow.

- As a reading of our Bull-Bear Indicator for U.S. Equities (comparative measurements over a rolling one-year timeframe), we remain in Cyclical Bull territory.
- Counting-up of the number of all our indicators that are ‘Up’ for U.S. Equities, the current tally is that three of four are Positive, representing a multitude of timeframes (two that can be solely days/weeks, or months+ at a time; another, a quarter at a time; and lastly, the {typically} years-long reading, that being the Cyclical Bull or Bear status).
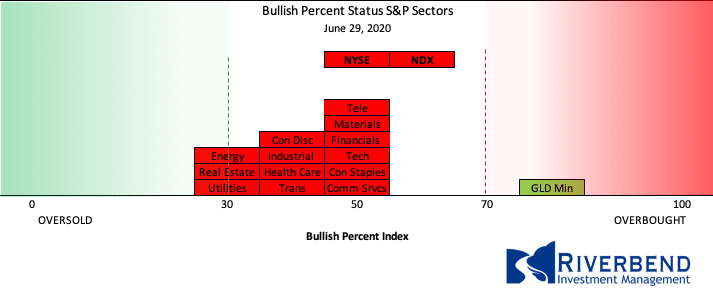
Of interest, individual sectors continue to pullback/pause after reaching very overbought conditions earlier this month:
The Week Ahead:
Monday:
U.S. Pending Home Sales 18.9%, -21.8% prior
China Manufacturing PMI 50.4 exp, 50.6 prior
Tuesday:
Eurozone CPI Flash Estimate y/y -0.1% exp, +0.1% prior
Chicago PMI 44.9 exp, 31.1 prior
U.S. CB Consumer Confidence 90.1 exp, 86.6 prior
Fed Chair Powell Testifies
China Caixin Manufacturing PMI 50.7 exp, 50.7 prior
Wednesday:
U.S. ISM Manufacturing PMI 49.0 exp, 43.1 prior
FOMC Meeting Minutes
Thursday:
Jobs Report U.S. Non-Farm Employment Change 3000k exp, 2509k prior
U.S. Unemployment Rate 12.5% exp, 13.3% prior U.S.
Average Hourly Earnings m/m -0.5% exp, -1.0% prior
Friday: Market Closed
[/fusion_text][/fusion_builder_column][/fusion_builder_row][/fusion_builder_container]


