[fusion_builder_container hundred_percent=”no” equal_height_columns=”no” menu_anchor=”” hide_on_mobile=”small-visibility,medium-visibility,large-visibility” class=”” id=”” background_color=”” background_image=”” background_position=”center center” background_repeat=”no-repeat” fade=”no” background_parallax=”none” parallax_speed=”0.3″ video_mp4=”” video_webm=”” video_ogv=”” video_url=”” video_aspect_ratio=”16:9″ video_loop=”yes” video_mute=”yes” overlay_color=”” video_preview_image=”” border_size=”” border_color=”” border_style=”solid” padding_top=”” padding_bottom=”” padding_left=”” padding_right=””][fusion_builder_row][fusion_builder_column type=”1_6″ spacing=”” center_content=”no” link=”” target=”_self” min_height=”” hide_on_mobile=”small-visibility,medium-visibility,large-visibility” class=”” id=”” hover_type=”none” border_size=”0″ border_color=”” border_style=”solid” border_position=”all” border_radius=”” box_shadow=”no” dimension_box_shadow=”” box_shadow_blur=”0″ box_shadow_spread=”0″ box_shadow_color=”” box_shadow_style=”” padding_top=”” padding_right=”” padding_bottom=”” padding_left=”” margin_top=”” margin_bottom=”” background_type=”single” gradient_start_color=”” gradient_end_color=”” gradient_start_position=”0″ gradient_end_position=”100″ gradient_type=”linear” radial_direction=”center” linear_angle=”180″ background_color=”” background_image=”” background_image_id=”” background_position=”left top” background_repeat=”no-repeat” background_blend_mode=”none” animation_type=”” animation_direction=”left” animation_speed=”0.3″ animation_offset=”” filter_type=”regular” filter_hue=”0″ filter_saturation=”100″ filter_brightness=”100″ filter_contrast=”100″ filter_invert=”0″ filter_sepia=”0″ filter_opacity=”100″ filter_blur=”0″ filter_hue_hover=”0″ filter_saturation_hover=”100″ filter_brightness_hover=”100″ filter_contrast_hover=”100″ filter_invert_hover=”0″ filter_sepia_hover=”0″ filter_opacity_hover=”100″ filter_blur_hover=”0″ last=”no”][/fusion_builder_column][fusion_builder_column type=”2_3″ layout=”1_1″ background_position=”left top” background_color=”” border_size=”” border_color=”” border_style=”solid” border_position=”all” spacing=”yes” background_image=”” background_repeat=”no-repeat” padding_top=”” padding_right=”” padding_bottom=”” padding_left=”” margin_top=”0px” margin_bottom=”0px” class=”” id=”” animation_type=”” animation_speed=”0.3″ animation_direction=”left” hide_on_mobile=”small-visibility,medium-visibility,large-visibility” center_content=”no” last=”no” min_height=”” hover_type=”none” link=””][fusion_text]
U.S. Markets:
U.S. stocks recorded gains this week that helped erase part of the previous week’s steep declines. The technology-heavy NASDAQ Composite fared the best, almost hitting the all-time intraday high it established on June 10th. Energy and health care stocks outperformed, while the real estate and utilities sectors lagged.
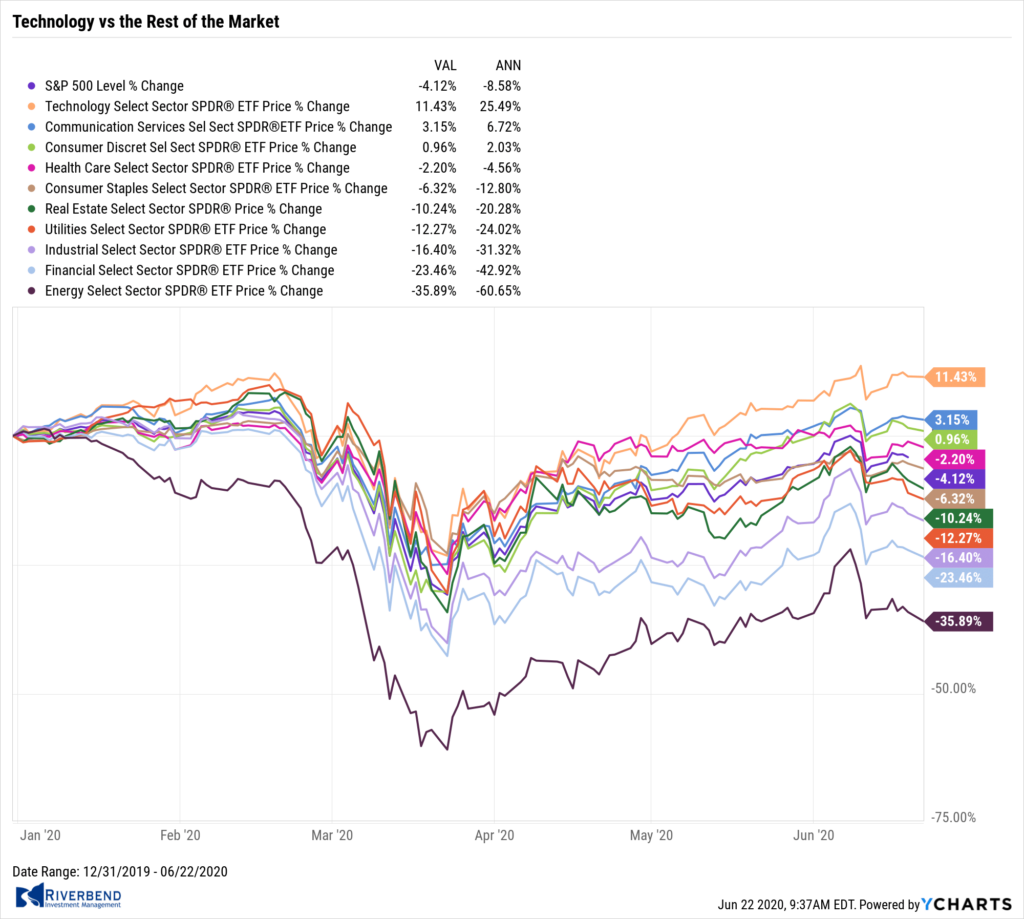
The Dow Jones Industrial Average rose 266 points to finish the week at 25,871, a gain of 1.0%. The NASDAQ Composite more than retraced last week’s decline, rising 3.7% to 9,946.
By market cap, the large cap S&P 500 added 1.9%, while the midcap S&P 400 and small cap Russell 2000 rose 1.4% and 2.2%, respectively.
International Markets:
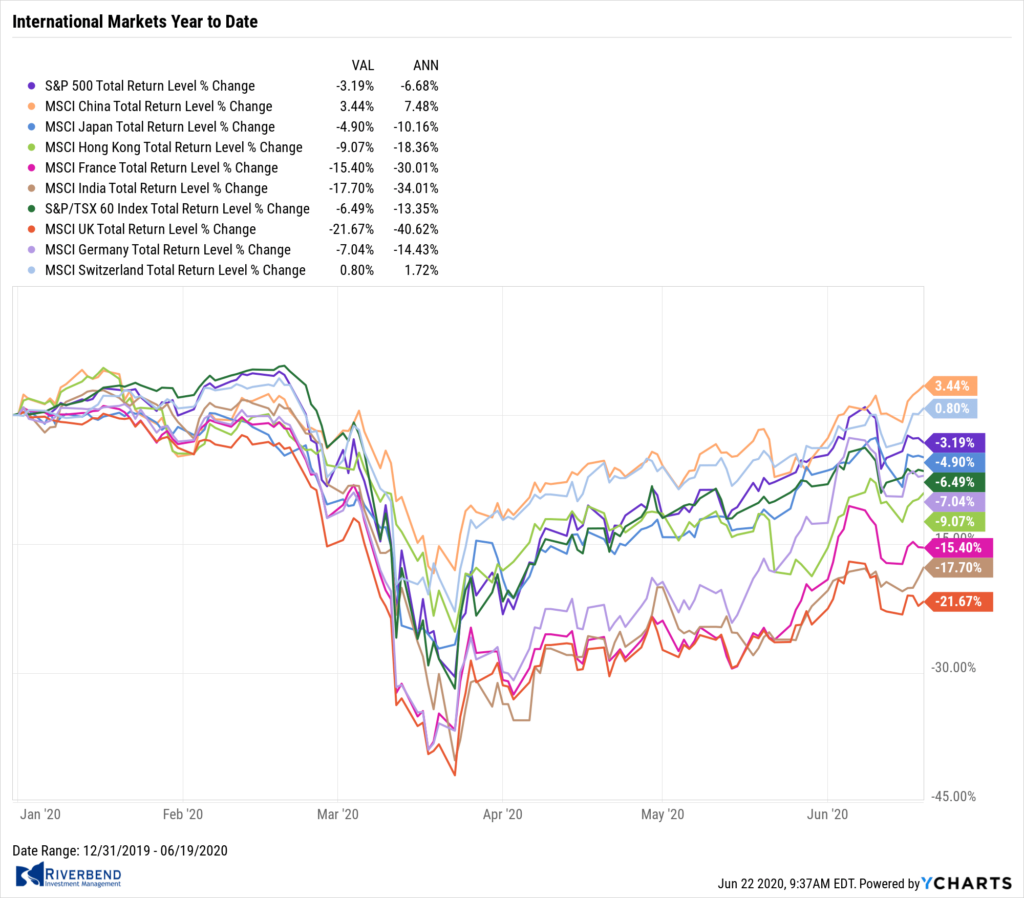
International markets were also a sea of green following last week’s sell-off. Canada’s TSX rose 1.4% while the United Kingdom’s FTSE 100 added 3.1%.
On Europe’s mainland, France’s CAC 40 rose 2.9% and Germany’s DAX gained 3.2%. In Asia, China’s Shanghai Composite rose 1.6% and Japan’s Nikkei finished up 0.8%.
As grouped by Morgan Stanley Capital International, developed markets rose 1.0% while emerging markets added 0.7%.
Commodities: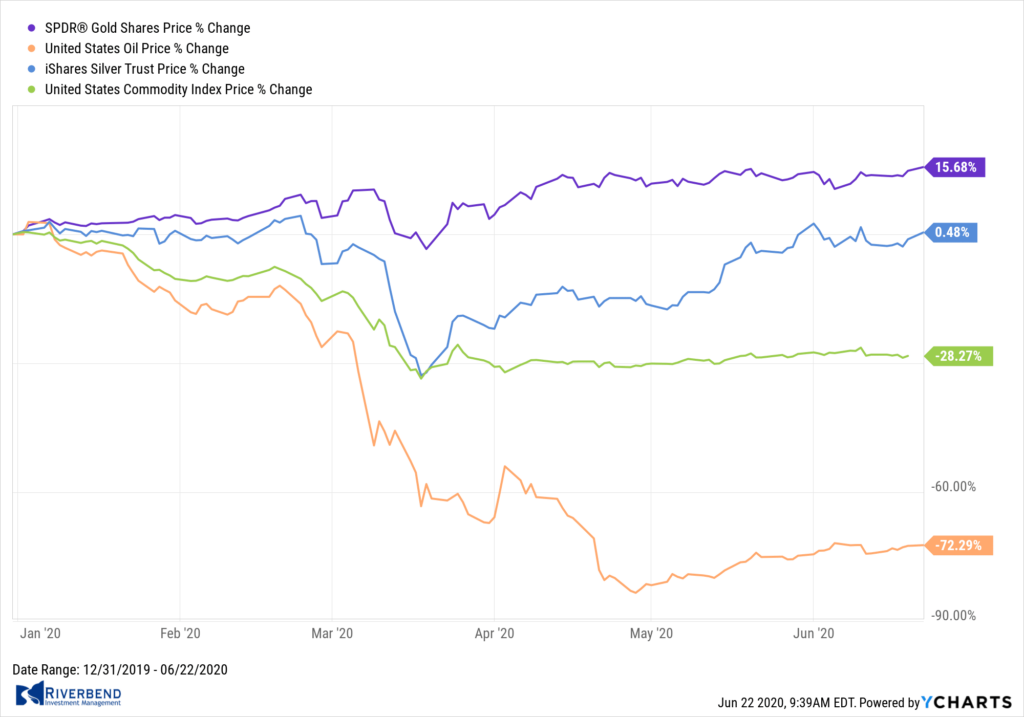
Precious metals also finished the week to the upside. Gold rose $15.70 to $1,753 an ounce, a gain of 0.9%. Silver added $0.36 to $17.85 an ounce, an increase of 2.1%.
Oil retraced last week’s decline by rising 9.9% to $39.83 per barrel of West Texas Intermediate crude oil.
The industrial metal copper, viewed by some analysts as a barometer of global economic health due to its wide variety of uses, finished the week up 0.4%–its fifth consecutive week of gains.
U.S. Economic News:
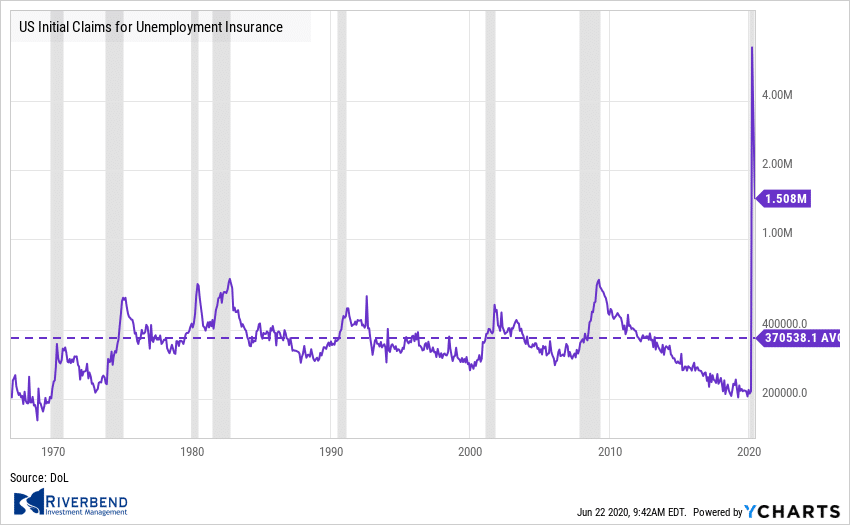
The number of Americans seeking first-time unemployment benefits dipped last week, but remained stubbornly high. The Labor Department reported initial claims for unemployment insurance fell by 58,000 last week to 1.508 million, its 11th straight decline. Economists had forecast 1.35 million new claims. Continuing claims, which counts the number of Americans already receiving benefits, fell by 62,000 to 20.544 million. That number is reported with a one-week delay.
Overall, about 49 million new jobless claims have been filed since the pandemic began, but, shocking as those numbers are, they don’t reveal much about how quickly the labor market is recovering. The more important figure to watch is continuing claims, and while they’ve begun to subside, they are not declining at a pace that indicates a rapid recovery in lost jobs.
Confidence among the nation’s home builders rebounded as the real estate market continued to show signs of recovery. The National Association of Home Builders’ (NAHB) monthly confidence index rose 21 points to a reading of 58 in June, the trade group reported.
It’s a marked rebound from April, when the index fell to its lowest level since June 2012. “Inventory is tight, mortgage applications are increasing, interest rates are low and confidence is rising,” said Dean Mon, chairman of the NAHB. “And buyer traffic more than doubled in one month even as builders report growing online and phone inquiries stemming from the outbreak.”
Index readings above 50 indicate improving confidence, while a figure below that threshold would signal the opposite. April was the first time since 2014 that the index has dropped below 50.
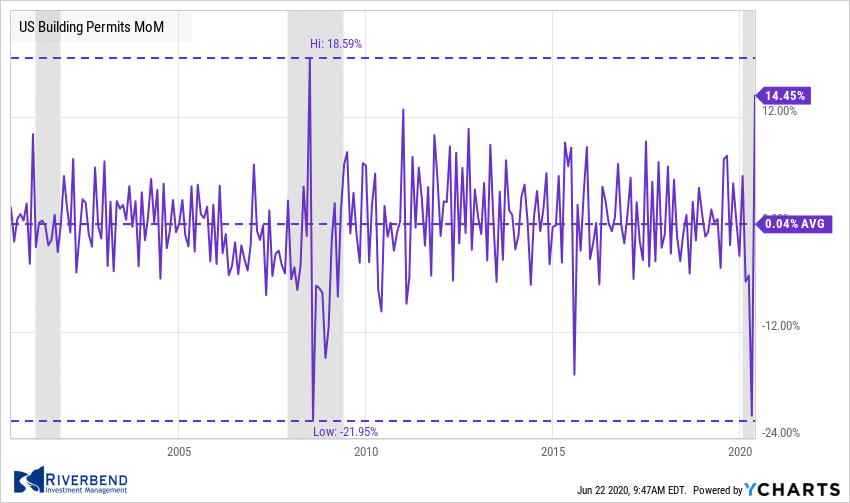
Construction of new houses rose 4.3% last month as ultra-low mortgage rates and a re-opening economy drew more buyers into the housing market. The Commerce Department reported housing starts climbed to an annual rate of 974,000 last month.
That is a significant improvement from the five-year low of 934,000 seen in April. However the reading missed economists’ forecasts of starts to rise to a 1.13 million annual rate. Although the increase was less than expected, a sharp rise in builder permits indicates construction is on track to expand more rapidly in the near future. Permits to build new houses jumped 14.4 % to a 1.22 million annual pace.
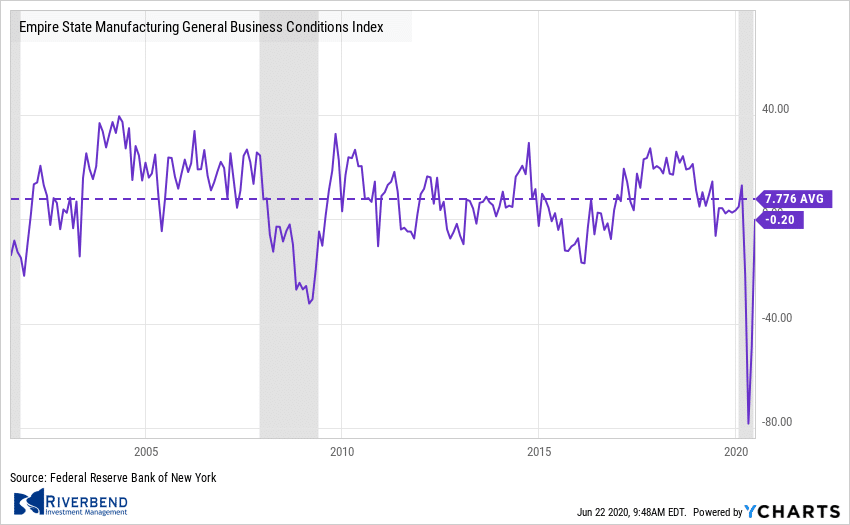 Manufacturing activity in the New York region increased by a record amount in June, well above expectations. The New York Fed reported its Empire State General Business Conditions Index increased 48.3 points to a reading of -0.2. Economists had expected a reading of -35.0.
It shows factory activity in the region has stabilized, following the record slump at the peak of the pandemic. The report is the first of six regional factory activity indexes and likely a harbinger of improving conditions across the country.
In the details of the report, the New Orders and Shipments indexes both bounced back from deeply negative territory and posting close to flat readings. Just as impressive was the surge in optimism, as the Expectations Index jumped 27.4 points to 56.5—its highest reading since October of 2009.
A similar report from the Philadelphia Fed also showed improving conditions. The Philly Fed’s regional business conditions index surged a record 70.6 points to 27.5 in June from a negative 43.1 the prior month. Economists had only expected a rebound to -20.
The index reached positive territory for the first time since February as factory activity in the region resumed following shutdowns. Nearly all individual activity indexes returned to growth mode, led by record or near-record jumps in new orders and shipments. Employment indicators continued to decline, but at slower rate. The Future Activity Index rose 16.6 points to 66.3, its highest level since June 1992.
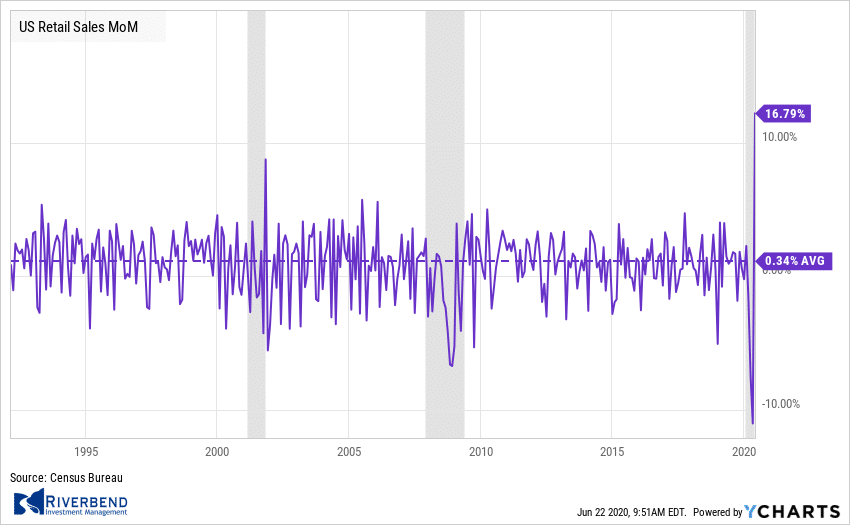 Sales at U.S. retailers surged to a new record last month, but the after-effects of the coronavirus continue to linger. The Commerce Department reported retail sales jumped a record 17.7% last month. Economists had forecast just a 7.7% increase. Sales had tumbled by a record 14.7% in April and 8.2% in March as the coronavirus pandemic spread across the country.
The rebound in sales largely reflects the loosening of restrictions on business activity after two months of stay-at-home orders to combat the spread. Yet, despite the rebound, sales were still 6% lower than at the same time last year.
Federal Reserve Chairman Jerome Powell was quick to point out that investors shouldn’t overreact to surprisingly good economic data like the May retail sales report. In testimony to the Senate Banking Committee, Powell acknowledged some economic indicators have pointed to stabilization in activity and others have even suggested “a modest rebound.”
“The levels of output and employment remain far below their pre-pandemic levels, and significant uncertainty remains about the timing and strength of the recovery,” Powell said. The Fed chairman added that until the coronavirus disease is contained, a full recovery is unlikely.
Chart of the Week:
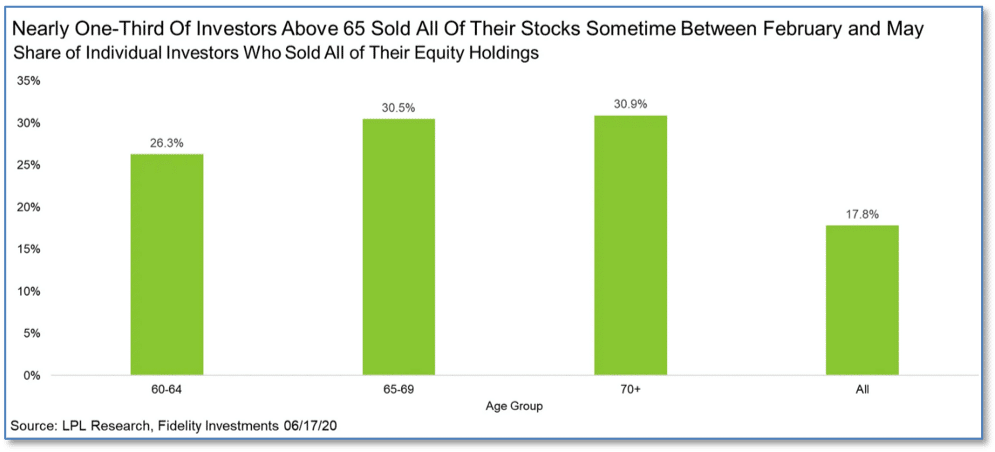
As the coronavirus spread across the nation, fear of its deadly effects hit unprecedented levels. That fear naturally carried over to the stock market where nearly a third of all investors 65 years old and older sold their entire equity holdings.
According to data from Fidelity Investments, nearly 18% of all investors sold their entire equity holdings between February and May. However, for those aged 65 and older, that percentage was nearly double at over 30%.
With stocks back near their highs, LPL Financial senior market strategist Ryan Detrick noted, “this is yet another reason to have a plan in place before trouble comes, as making decisions when under duress frequently leads to the exact wrong decision.”
Riverbend Indicators Update:

Each week we post notable changes to the various market indicators we follow.
Counting-up of the number of all our indicators that are ‘Up’ for U.S. Equities, the current tally is that three of four are Positive, representing a multitude of timeframes (two that can be solely days/weeks, or months+ at a time; another, a quarter at a time; and lastly, the {typically} years-long reading, that being the Cyclical Bull or Bear status).
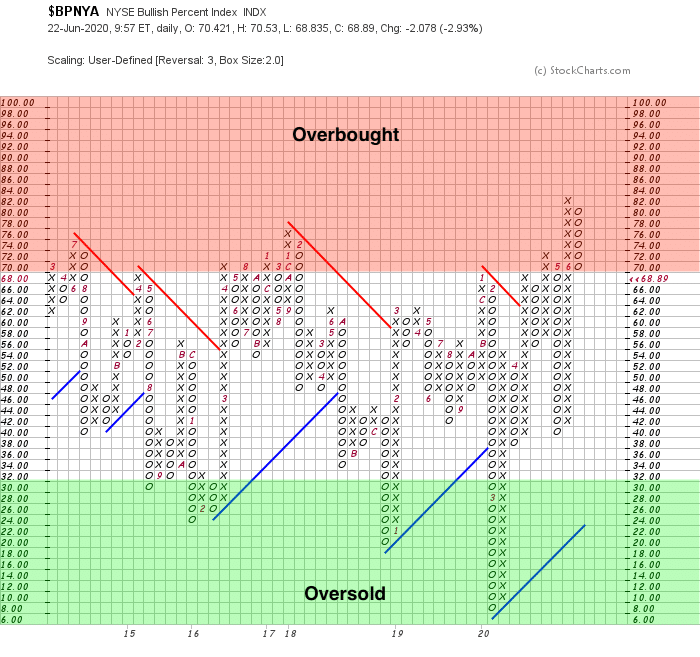
The NYSE Bullish Percent Indicator – which is viewed as overbought at levels of 70 or above – has started to pullback from very overbought conditions.
This may indicate the investors are starting to remove risk from their portfolios and are beginning to taking profits from the rising in stock prices since the March low.
The Week Ahead
Monday: U.S. Existing Home Sales 4.15 mln exp, 4.33 mln prior Australian Flash Manufacturing PMI N/A exp, 44.0prior
Tuesday: PMIs French Flash Services PMI 44.9 exp, 31.1 prior German Flash Manufacturing PMI 41.5 exp, 36.6 prior U.S. Flash Manufacturing PMI 50.0 exp, 39.8 prior U.S. Flash Services PMI 46.9 exp, 37.5 prior
Wednesday: U.S. HPI m/m +0.0% exp, +0.1% prior
Thursday: U.S. Core Durable Goods Orders m/m +2.5% exp, -7.7% prior U.S. Unemployment Claims 1300k exp, 1508k prior
Friday: U.S. Personal Spending m/m +8.9% exp, -13.6% prior U.S. Personal Income m/m -6.0% exp, +10.5% Revised UoM Consumer Sentiment 79.1 exp, 78.9 prior
(Sources: All index- and returns-data from Yahoo Finance; news from Reuters, Barron’s, Wall St. Journal, Bloomberg.com, ft.com, guggenheimpartners.com, zerohedge.com, ritholtz.com, markit.com, financialpost.com, Eurostat, Statistics Canada, Yahoo! Finance, stocksandnews.com, marketwatch.com, wantchinatimes.com, BBC, 361capital.com, pensionpartners.com, cnbc.com, FactSet.)
[/fusion_text][/fusion_builder_column][/fusion_builder_row][/fusion_builder_container][fusion_builder_container hundred_percent=”no” hundred_percent_height=”no” hundred_percent_height_scroll=”no” hundred_percent_height_center_content=”yes” equal_height_columns=”no” menu_anchor=”” hide_on_mobile=”small-visibility,medium-visibility,large-visibility” status=”published” publish_date=”” class=”” id=”” border_size=”” border_color=”” border_style=”solid” margin_top=”” margin_bottom=”” padding_top=”” padding_right=”” padding_bottom=”” padding_left=”” gradient_start_color=”” gradient_end_color=”” gradient_start_position=”0″ gradient_end_position=”100″ gradient_type=”linear” radial_direction=”center” linear_angle=”180″ background_color=”” background_image=”” background_position=”center center” background_repeat=”no-repeat” fade=”no” background_parallax=”none” enable_mobile=”no” parallax_speed=”0.3″ background_blend_mode=”none” video_mp4=”” video_webm=”” video_ogv=”” video_url=”” video_aspect_ratio=”16:9″ video_loop=”yes” video_mute=”yes” video_preview_image=”” filter_hue=”0″ filter_saturation=”100″ filter_brightness=”100″ filter_contrast=”100″ filter_invert=”0″ filter_sepia=”0″ filter_opacity=”100″ filter_blur=”0″ filter_hue_hover=”0″ filter_saturation_hover=”100″ filter_brightness_hover=”100″ filter_contrast_hover=”100″ filter_invert_hover=”0″ filter_sepia_hover=”0″ filter_opacity_hover=”100″ filter_blur_hover=”0″][fusion_builder_row][/fusion_builder_row][/fusion_builder_container]


