[fusion_builder_container hundred_percent=”no” equal_height_columns=”no” menu_anchor=”” hide_on_mobile=”small-visibility,medium-visibility,large-visibility” class=”” id=”” background_color=”” background_image=”” background_position=”center center” background_repeat=”no-repeat” fade=”no” background_parallax=”none” parallax_speed=”0.3″ video_mp4=”” video_webm=”” video_ogv=”” video_url=”” video_aspect_ratio=”16:9″ video_loop=”yes” video_mute=”yes” overlay_color=”” video_preview_image=”” border_size=”” border_color=”” border_style=”solid” padding_top=”” padding_bottom=”” padding_left=”” padding_right=””][fusion_builder_row][fusion_builder_column type=”1_6″ spacing=”” center_content=”no” link=”” target=”_self” min_height=”” hide_on_mobile=”small-visibility,medium-visibility,large-visibility” class=”” id=”” hover_type=”none” border_size=”0″ border_color=”” border_style=”solid” border_position=”all” border_radius=”” box_shadow=”no” dimension_box_shadow=”” box_shadow_blur=”0″ box_shadow_spread=”0″ box_shadow_color=”” box_shadow_style=”” padding_top=”” padding_right=”” padding_bottom=”” padding_left=”” margin_top=”” margin_bottom=”” background_type=”single” gradient_start_color=”” gradient_end_color=”” gradient_start_position=”0″ gradient_end_position=”100″ gradient_type=”linear” radial_direction=”center” linear_angle=”180″ background_color=”” background_image=”” background_image_id=”” background_position=”left top” background_repeat=”no-repeat” background_blend_mode=”none” animation_type=”” animation_direction=”left” animation_speed=”0.3″ animation_offset=”” filter_type=”regular” filter_hue=”0″ filter_saturation=”100″ filter_brightness=”100″ filter_contrast=”100″ filter_invert=”0″ filter_sepia=”0″ filter_opacity=”100″ filter_blur=”0″ filter_hue_hover=”0″ filter_saturation_hover=”100″ filter_brightness_hover=”100″ filter_contrast_hover=”100″ filter_invert_hover=”0″ filter_sepia_hover=”0″ filter_opacity_hover=”100″ filter_blur_hover=”0″ last=”no”][/fusion_builder_column][fusion_builder_column type=”2_3″ layout=”1_1″ background_position=”left top” background_color=”” border_size=”” border_color=”” border_style=”solid” border_position=”all” spacing=”yes” background_image=”” background_repeat=”no-repeat” padding_top=”” padding_right=”” padding_bottom=”” padding_left=”” margin_top=”0px” margin_bottom=”0px” class=”” id=”” animation_type=”” animation_speed=”0.3″ animation_direction=”left” hide_on_mobile=”small-visibility,medium-visibility,large-visibility” center_content=”no” last=”no” min_height=”” hover_type=”none” link=””][fusion_text]
U.S. Markets: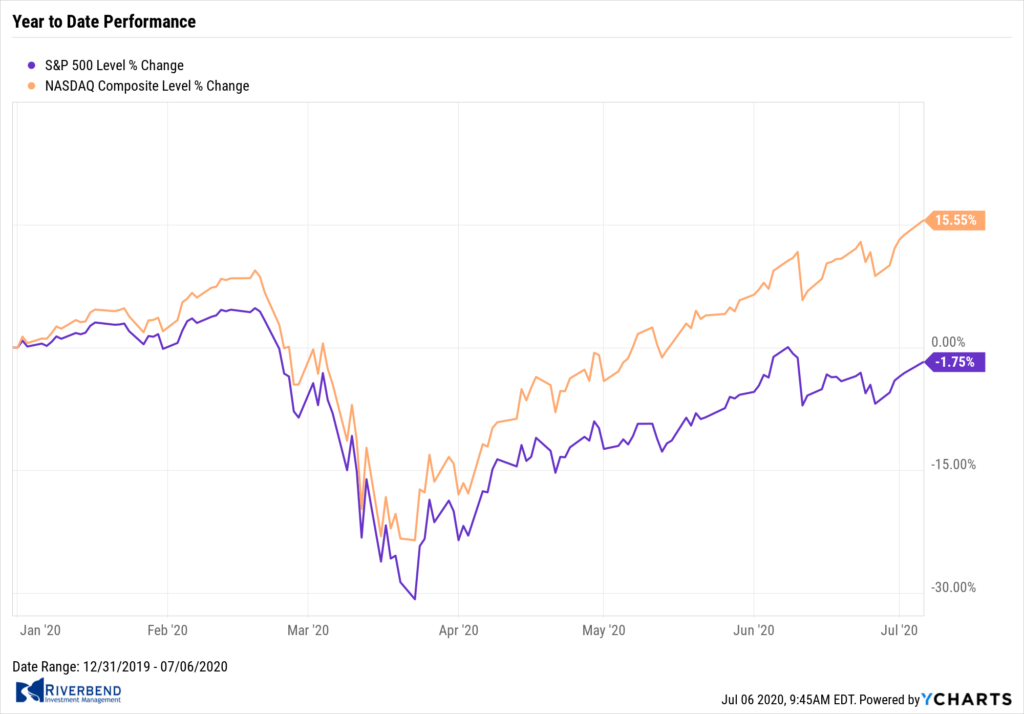
U.S. stocks recorded solid gains for the holiday-shortened week, helping to lift the technology-heavy NASDAQ Composite Index to a record intraday high. The large cap S&P 500 hit its highest level since mid-June.
The week closed out the best quarter for the Dow Jones Industrial Average and the S&P 500 since 1987 and 1988, respectively. The Dow Jones Industrial Average added 812 points to finish the week at 25,827, a gain of 3.2%. The NASDAQ added 450 points and finished at 10,208, a 4.6% increase.
By market cap, large caps led the way with the S&P 500 adding 4.0%, while the mid cap S&P 400 and small cap Russell 2000 rose 3.5% and 3.8%, respectively.
International Markets: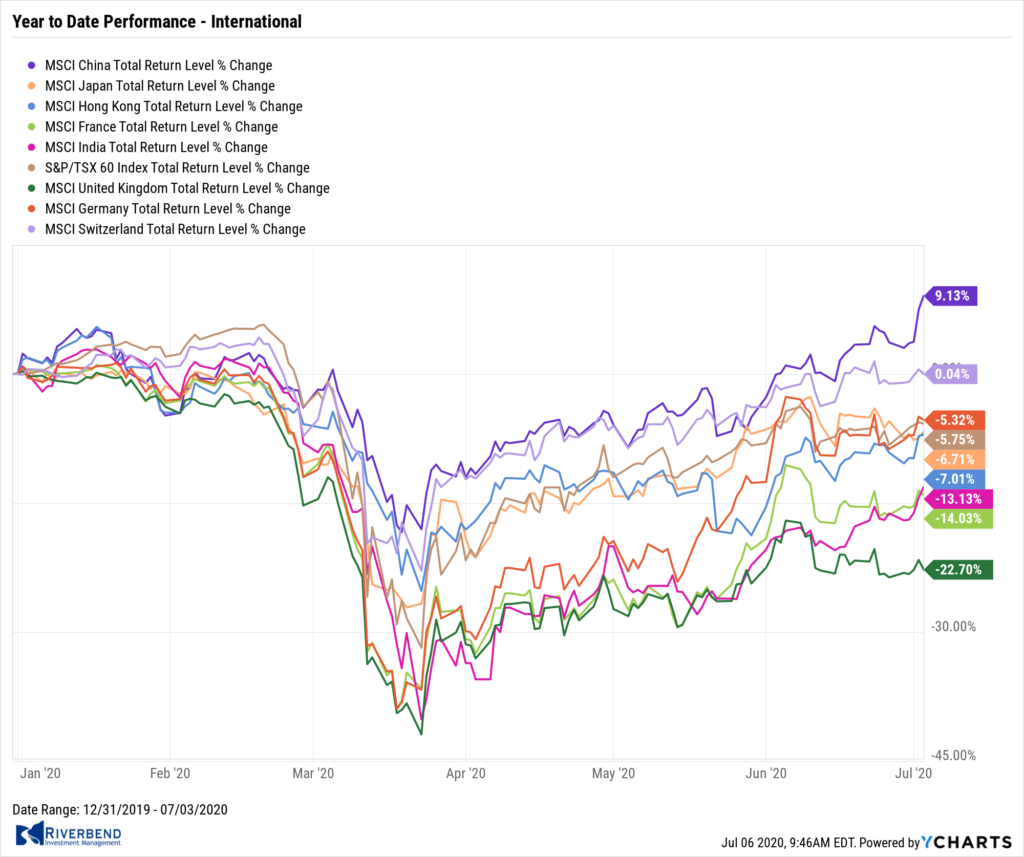
Canada’s TSX retraced last week’s entire decline and then some by advancing 2.7%. The United Kingdom’s FTSE finished essentially flat, down just 2 points.
On Europe’s mainland, France’s CAC 40 and Germany’s DAX rose 2.0% and 3.6%, respectively. In Asia, China’s Shanghai Composite surged 5.8%, while Japan’s Nikkei finished down ‑0.9%.
As grouped by Morgan Stanley Capital International, developed markets added 2.1% while emerging markets gained 3.6%.
Commodities: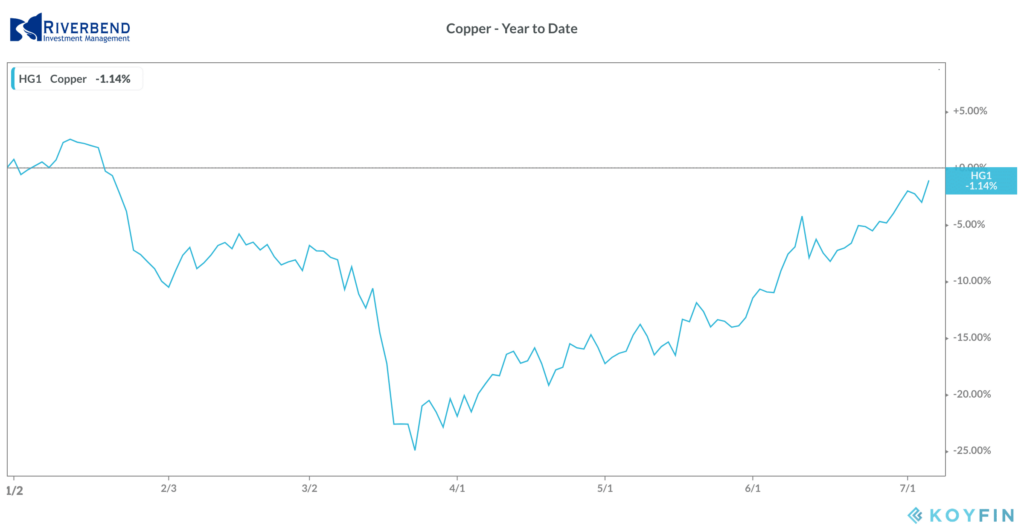
Gold rose for a fourth consecutive week, closing at $1790 an ounce and notching a gain of 0.5%. Silver added 1.6% to finish the week at $18.32 ounce.
Oil retraced the prior week’s entire decline, rising 5.6% and finishing the week at $40.65 per barrel of West Texas Intermediate crude.
Copper, viewed by some analysts as a barometer of global economic health due to its wide variety of industrial uses, rose for a seventh consecutive week, up 2.6%.
U.S. Economic News: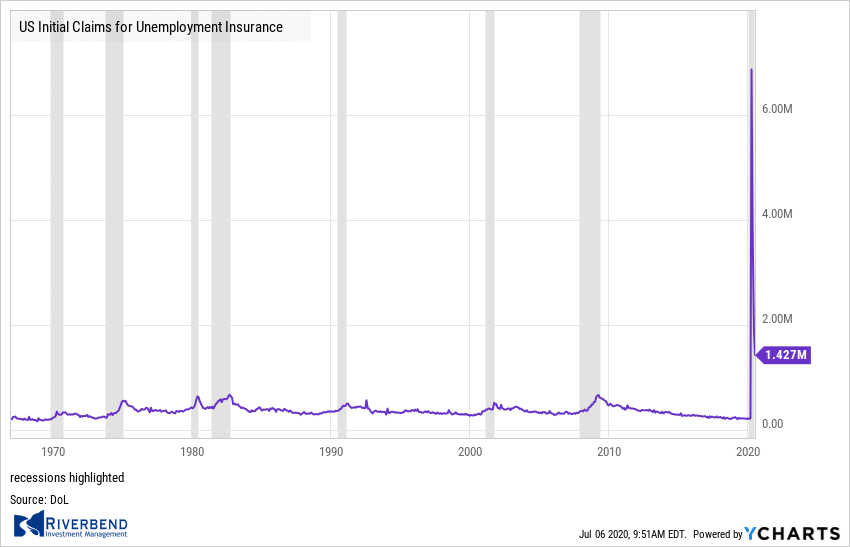
The number of Americans filing first-time unemployment benefits continued to slow last week, but remained above the consensus expectation. Initial claims for unemployment insurance fell by 55,000 to 1.427 million. Economists had expected a reading of 1.380 million. It was the 13th consecutive decline, as labor market conditions continued to improve with the reopening of the economy.
 Continuing claims for unemployment benefits, which counts the number of Americans already receiving benefits, rose by 59,000 to 19.290 million. The unemployment rate fell to 11.1% in June from 13.3% in the prior month. More than 50 million new claims have been filed since mid-March. Before the pandemic, claims averaged around 225,000 per week.
Another 4.8 million Americans went back to work in June sending the unemployment rate down to 11.1%, the Bureau of Labor Statistics reported. The increase in new jobs exceeded economists’ forecasts of 3.7 million. Millions of people have returned to work since the states began to reopen in May.
However, the survey used to compile the report took place before the latest wave of new coronavirus cases erupted. The U.S. lost more than 22 million jobs during the height of the pandemic and has restored about 7.5 million of them in the past two months. Analysts were quick to caution against expecting these strong numbers to continue.
Sal Guatieri, senior economist at BMO Capital Markets wrote in a note to clients, “The end of the lockdowns has allowed for a faster than expected recovery in jobs in the past two months, but more recent events and data suggest much tougher slogging ahead.”
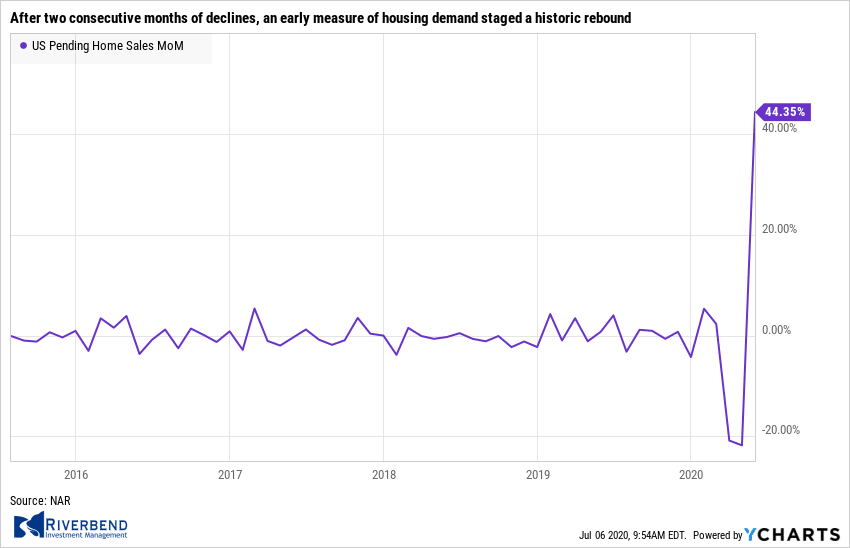 After two consecutive months of declines, an early measure of housing demand staged a historic rebound. The National Association of Realtors (NAR) reported its index of pending home sales soared 44.3% in May—its largest monthly percentage increase on record. The result led many analysts to conclude that the worst may have already come for the real-estate market.
Lawrence Yun, chief economist for the NAR, stated “This has been a spectacular recovery for contract signings, and goes to show the resiliency of American consumers and their evergreen desire for homeownership.” The index measures real-estate transactions for previously-owned homes where a contract was signed but the sale had not yet closed. Analysts use the pending home sales data to get an “early read” on actual sales in the near future.
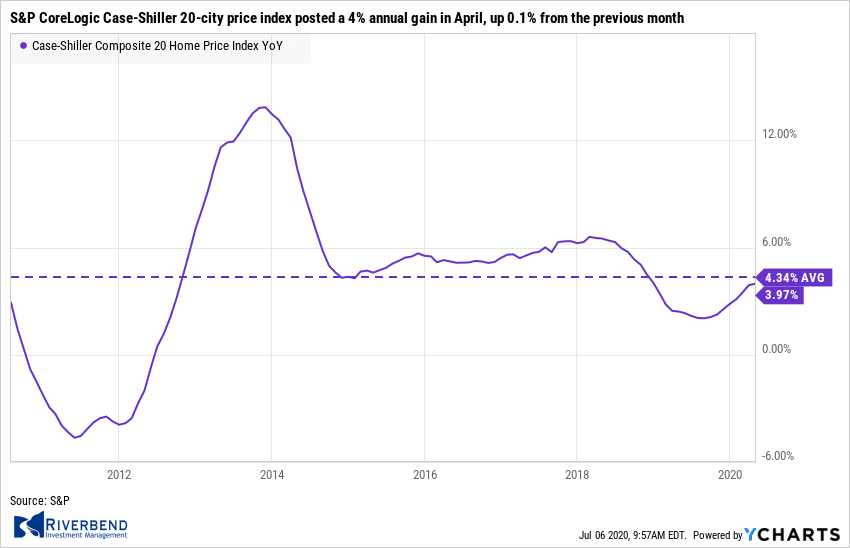 Home-prices have maintained a steady upward trajectory according to data from S&P CoreLogic. The S&P CoreLogic Case-Shiller 20-city price index posted a 4% annual gain in April, up 0.1% from the previous month. On a monthly basis, the index increased 0.9% between March and April.
Phoenix continued to lead the country with an 8.8% annual price gain in April. Seattle was next, with a 7.3% gain, followed by Minneapolis, where home prices rose 6.4% over the past year. Prices were weaker in the Northeast. Overall, the pace of price growth increased in 12 of the 19 cities Case-Shiller analyzed (Detroit wasn’t included because transaction records were unavailable, the report noted).
Confidence among the nation’s consumers jumped to a 3-month high, but remains well below pre-pandemic levels.
Confidence among the nation’s consumers jumped to a 3-month high, but remains well below pre-pandemic levels. The Conference Board reported its index of consumer confidence rose to 98.1 in June. Economists had expected a reading of 90.8.
However there’s one potentially big caveat. The cutoff date for the survey was June 18th, shortly before states such as Texas and Arizona re-imposed new restrictions after a new outbreak of COVID-19 cases. The level of confidence remains well below pre-crisis levels after steep declines in March and April.
The index had stood near a 20-year high at 132.6 in February before the pandemic shut down swaths of the economy. It fell to a low of 85.7 in April.
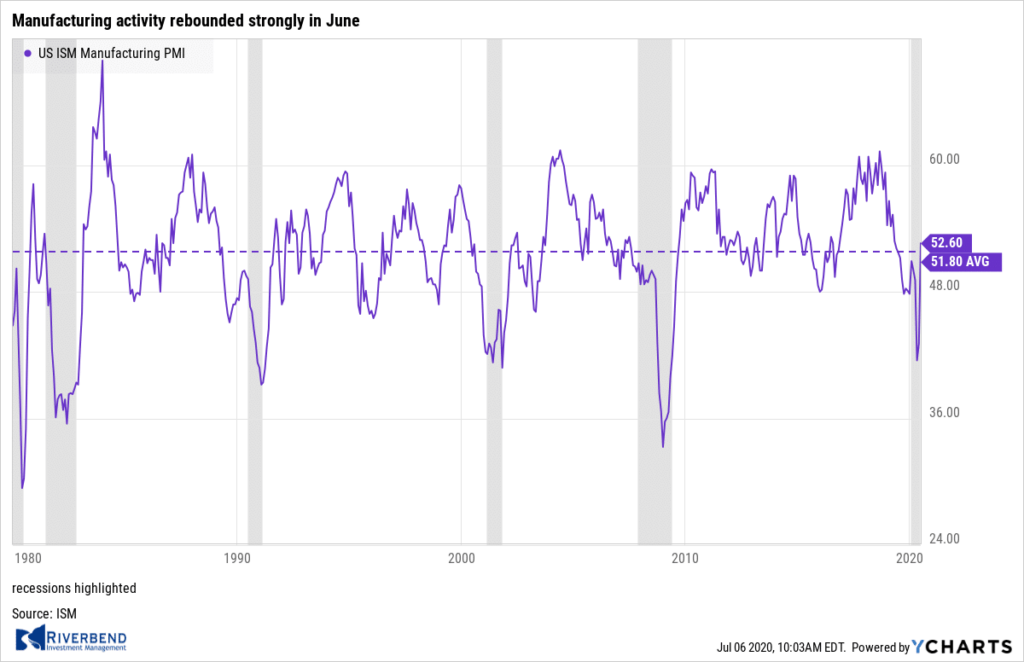 Manufacturing activity rebounded strongly in June according to the Institute for Supply Management (ISM). ISM reported its Manufacturing Index surged 9.5 points in June to 52.6. Economists had expected a reading of 49.5. It was the biggest jump since August 1980 and to the highest level in over a year as factory activity returned to growth mode after the COVID shutdown.
In the details, thirteen of the eighteen ISM industries grew indicating a broadening expansion. Most ISM components increased led by near-record jumps in new orders and production. Supplier deliveries slowed at a slower pace, which was a positive development as it reflected diminishing supply chain issues.
Chart of the Week:
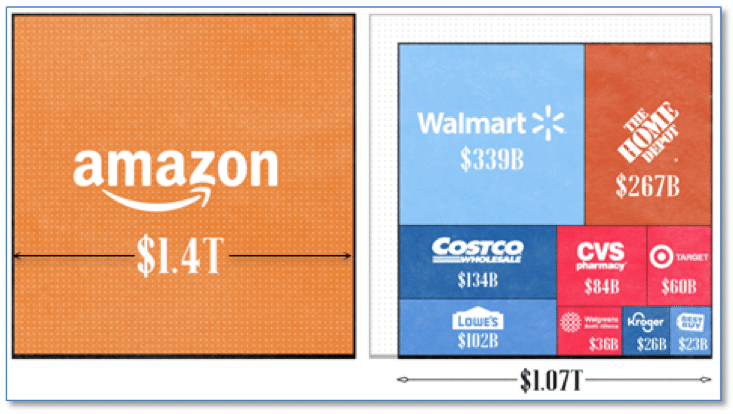 As America celebrates its Independence Day, more and more Americans are dependent on Amazon.
The e‑commerce behemoth’s stock sits at all-time highs, and its president Jeff Bezos is (by far) the richest man in the world. Everyone knows that Amazon is big in the retail space, but just how big may surprise many.
VisualCapitalist created an infographic showing Amazon’s valuation compared to the country’s nine next-largest retailers.
In short, the market valuation of all of the next nine companies, from Costco to Walmart, added together still lag Amazon’s by almost half a trillion dollars.
Riverbend Indicators Update:

Each week we post notable changes to the various market indicators we follow.
As a reading of our Bull-Bear Indicator for U.S. Equities (comparative measurements over a rolling one-year timeframe), we remain in Cyclical Bull territory.
Counting-up of the number of all our indicators that are ‘Up’ for U.S. Equities , the current tally is that all four are Positive, representing a multitude of timeframes (two that can be solely days/weeks, or months+ at a time; another, a quarter at a time; and lastly, the {typically} years-long reading, that being the Cyclical Bull or Bear status).
The Week Ahead:
Monday: U.S. ISM Non-Manufacturing PMI 50.0 exp, 45.4 prior Reserve Bank of Australia Rate Statement
Tuesday: German Industrial Production m/m +10.1 exp, -17.9% prior U.S. IBD/TIPP Economic Optimism 48.2 exp, 47.0 prior JOLTS Job Openings 4.80 mln 5.05 mln prior
Wednesday: U.S. 10-yr Note Auction 0.83 WI, 2.3 b/c U.S. Consumer Credit -15.0 bln exp, -68.86 bln prior
Thursday: U.S. Unemployment Claims N/A exp, 1427k prior U.S. Final Wholesale Inventories m/m -1.2% exp, -1.2% prior U.S. 30-yr Bond Auction 1.45 WI, 2.3 b/c
Friday: U.S. PPI m/m +0.4% exp, +0.4%prior U.S. Core PPI m/m +0.1% exp, -0.1% prior
(Sources: All index- and returns-data from Yahoo Finance; news from Reuters, Barron’s, Wall St. Journal, Bloomberg.com, ft.com, guggenheimpartners.com, zerohedge.com, ritholtz.com, markit.com, financialpost.com, Eurostat, Statistics Canada, Yahoo! Finance, stocksandnews.com, marketwatch.com, wantchinatimes.com, BBC, 361capital.com, pensionpartners.com, cnbc.com, FactSet.)
Cover photo by Daan Huttinga on Unsplash
[/fusion_text][/fusion_builder_column][/fusion_builder_row][/fusion_builder_container]


