[fusion_builder_container hundred_percent=”no” equal_height_columns=”no” menu_anchor=”” hide_on_mobile=”small-visibility,medium-visibility,large-visibility” class=”” id=”” background_color=”” background_image=”” background_position=”center center” background_repeat=”no-repeat” fade=”no” background_parallax=”none” parallax_speed=”0.3″ video_mp4=”” video_webm=”” video_ogv=”” video_url=”” video_aspect_ratio=”16:9″ video_loop=”yes” video_mute=”yes” overlay_color=”” video_preview_image=”” border_size=”” border_color=”” border_style=”solid” padding_top=”” padding_bottom=”” padding_left=”” padding_right=””][fusion_builder_row][fusion_builder_column type=”1_1″ layout=”1_1″ background_position=”left top” background_color=”” border_size=”” border_color=”” border_style=”solid” border_position=”all” spacing=”yes” background_image=”” background_repeat=”no-repeat” padding_top=”” padding_right=”” padding_bottom=”” padding_left=”” margin_top=”0px” margin_bottom=”0px” class=”” id=”” animation_type=”” animation_speed=”0.3″ animation_direction=”left” hide_on_mobile=”small-visibility,medium-visibility,large-visibility” center_content=”no” last=”no” min_height=”” hover_type=”none” link=””][fusion_text]
U.S. Markets: 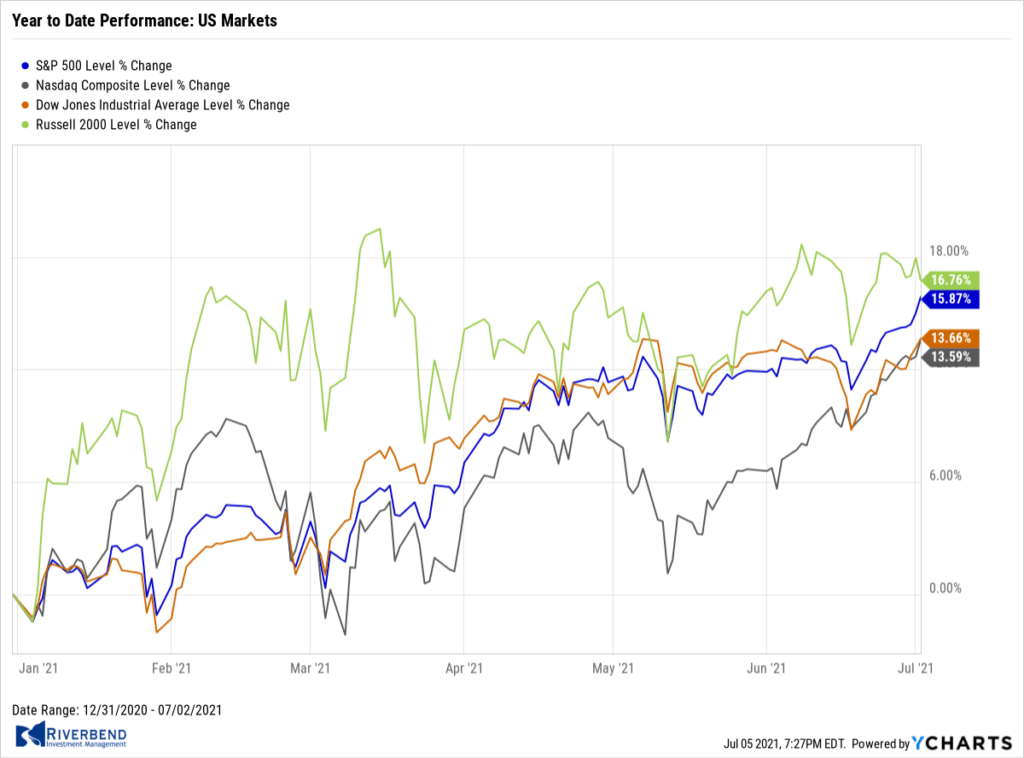
The benchmark S&P 500 large cap index and technology-heavy NASDAQ Composite moved to new highs and closed out a fifth consecutive quarterly advance this week.
The Dow Jones Industrial Average added 353 points finishing the week at 34,786, a gain of 1%. The NASDAQ, likewise, finished the week up 1.9%.
By market cap, the S&P 500 added 1.7%, while the mid cap S&P 400 and small cap Russell 2000 retreated -0.6% and -1.2%, respectively.
International Markets: 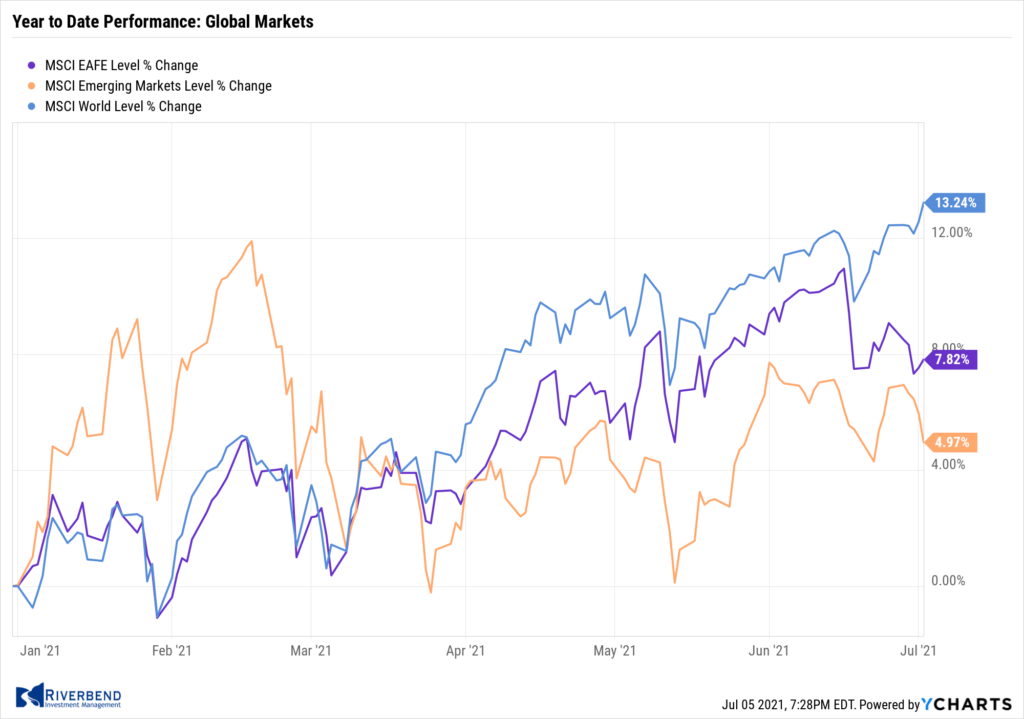
In international markets, Canada’s TSX closed essentially unchanged, while the United Kingdom’s FTSE 100 ticked down -0.2%.
On Europe’s mainland France’s CAC 40 gave up -1.1%, while Germany’s DAX rose 0.3%.
China’s Shanghai Composite declined -2.5% and Japan’s Nikkei retreated -1.0%.
As grouped by Morgan Stanley Capital International, developed markets declined -0.8% and emerging markets fell -1.3
Commodities: 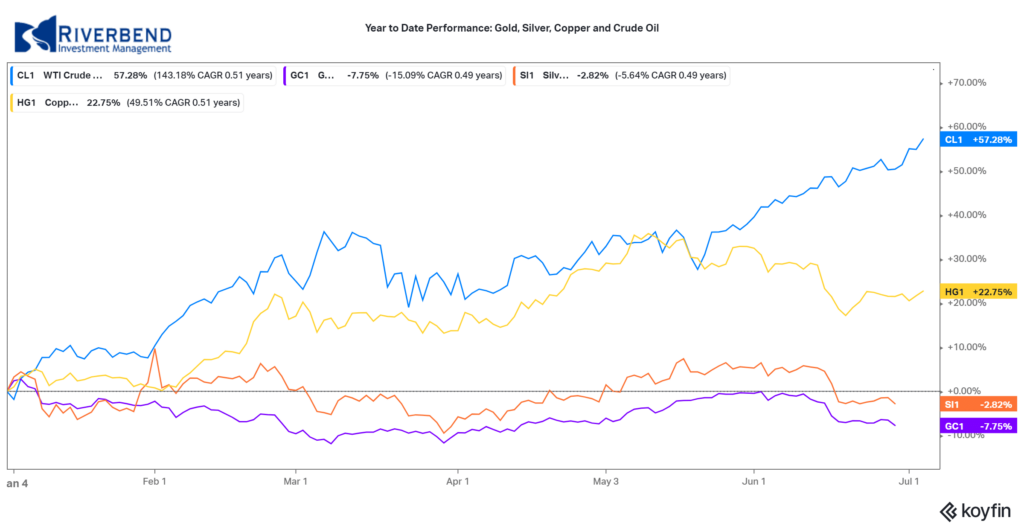
Precious metals finished the week to the upside, with Gold rising 0.3% to $1783.30 an ounce and Silver adding 1.6% to $26.50.
Oil had its sixth consecutive week of positive closes finishing the week up 1.5% to $75.16 per barrel for West Texas Intermediate crude.
The industrial metal copper, viewed by some analysts as a barometer of world economic health due to its wide variety of uses, ended the week down -0.4%.
U.S. Economic News: 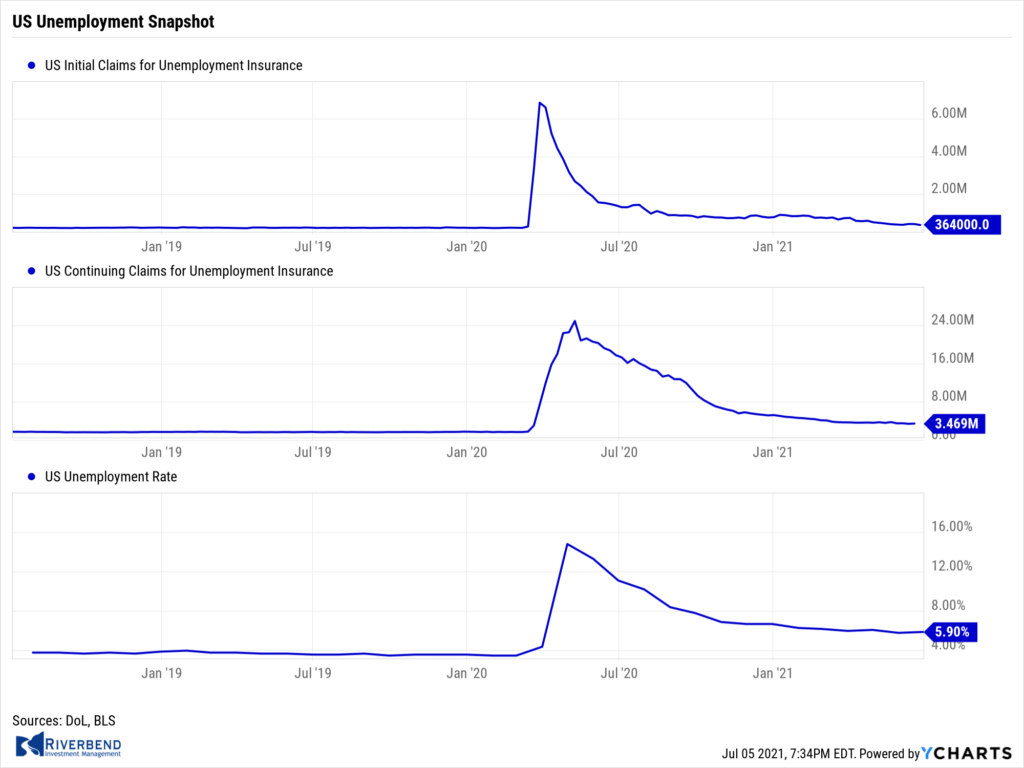
The number of Americans filing for first-time unemployment benefits sank to a pandemic low as extra benefits began to phase out. The Labor Department reported new applications for unemployment benefits fell by 51,000 last week to a new pandemic low of 364,000, further evidence of the rapid economic rebound and more aggressive efforts by companies to hire workers. The decline in new claims was bigger than expected. Economists had expected a reading of 390,000. (Of note, the enhanced federal benefits due to the coronavirus are set to expire in all states in September).
New jobless claims posted the biggest decline in Pennsylvania, and fell sharply in Kentucky, California, Texas, Illinois, Michigan and Ohio. Meanwhile, continuing claims, which counts the number of people already receiving benefits rose by 56,000 to 3.47 million. Continuing claims had dropped to a pandemic low the prior week.
The U.S. added the most new jobs in almost a year in June as the economy perked up and companies rushed to hire more workers. The Bureau of Labor Statistics reported the U.S. created 850,000 new jobs. Economists had forecast just 706,000 new jobs. Most of the new jobs were in service-oriented positions such as restaurants, hotels, and retailers. Government payrolls also rose by 188,000, but that was largely the result of pandemic-related effects on education.
The unemployment rate, meanwhile, rose slightly to 5.9% from 5.8%. Despite the robust economic recovery and record number of job openings, unemployment remains quite high. Some 26 states will stop giving out extra federal benefits of up to $300 a week by early July in an effort to nudge people to return to work.
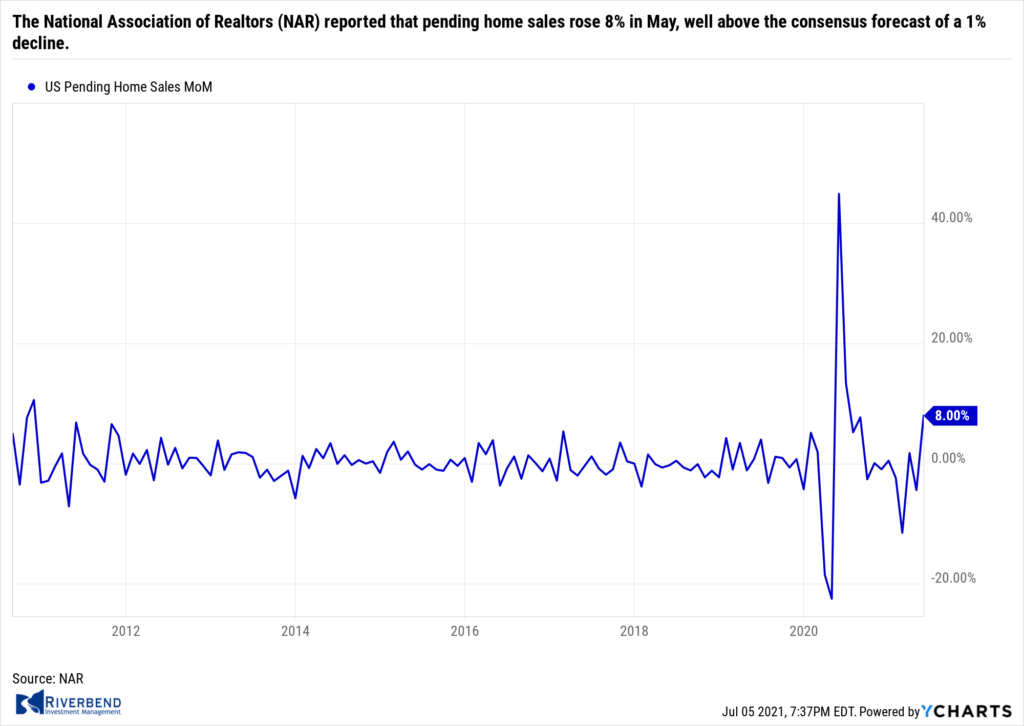
The National Association of Realtors (NAR) reported that pending home sales rose 8% in May, well above the consensus forecast of a 1% decline. Compared with the same time last year, pending home sales were up 13.1%, but at that time last year home sales activity had fallen amid the onset of the COVID-19 pandemic.
Lawrence Yun, chief economist at NAR stated, “May’s strong increase in transactions–following April’s decline, as well as a sudden erosion in home affordability–was indeed a surprise.” In the report, all regions saw an uptick in sales, led by a 15.5% surge in the Northeast. The South saw the smallest increase, with a 4.9% uptick.
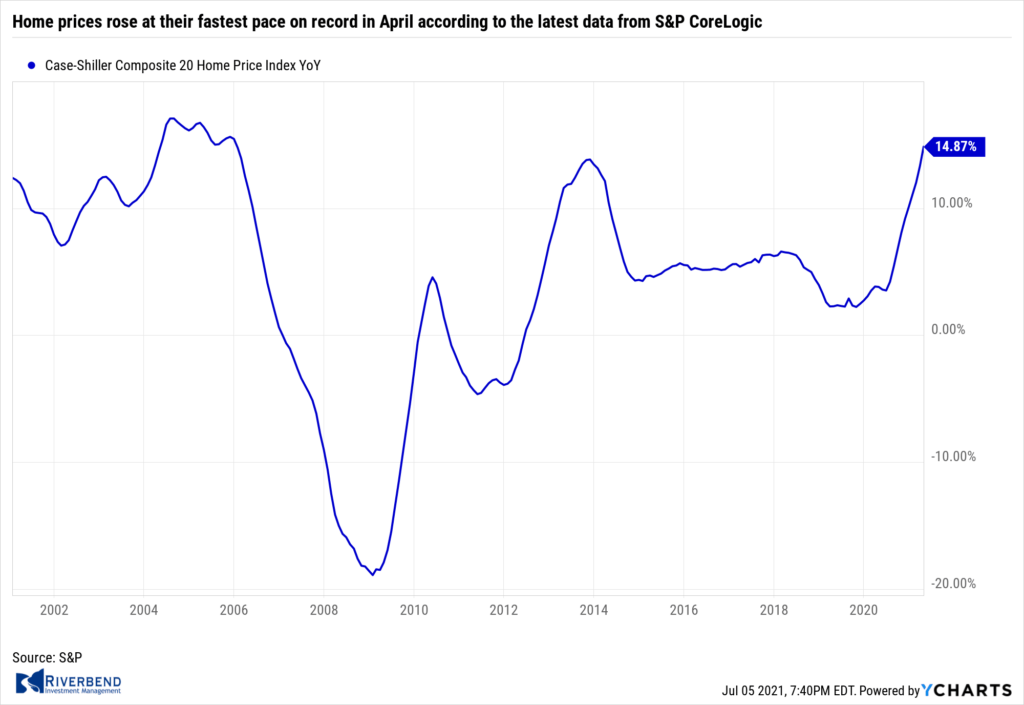
Home prices rose at their fastest pace on record in April according to the latest data from S&P CoreLogic. S&P’s Case-Shiller National Home Price index increased 14.6% over the past year—the highest year-over-year reading in more than 30 years of data. The separate 20-city index, which gauges home prices across a group of major cities across the country, increased at an even higher 14.9%, well over the 13.3% growth recorded the month prior. Comparisons between April 2020 and April 2021 are skewed due to the onset of the coronavirus pandemic, but even given that, home prices have been on a tear.
CoreLogic deputy chief economist Selma Hepp stated, “Pressures on home prices that have built over the last year culminated in the strongest home-price growth since the beginning of the data series in 1987.” As in recent months, Phoenix, San Diego and Seattle experienced the largest gains over the past year, with home prices in all three of these cities rising 20% from last April. Overall, there were five cities where home prices rose by record amounts: Charlotte, Cleveland, Dallas, Denver and Seattle.
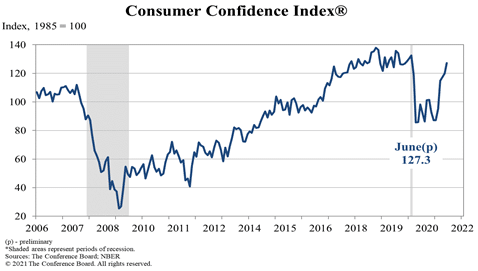 Confidence among the nation’s consumers surged in June, hitting its highest level since before the onset of the pandemic. The Conference Board reported its Consumer Confidence index rose over 7 points to 127.3, reflecting the growing sense that fears of COVID are fading away and people can get on with their lives. Economists had expected a reading of just 118.7. The index has risen for six consecutive months. The U.S. economy is surging again given the massive government stimulus and number of new jobs available.
In the details, the part of the survey that asks how consumers feel about the economy right now shot up by almost 10 points to 157.3 – more than double the pandemic low of 68.4 in May 2020. Consumers were optimistic about the future, too. A measure of how Americans view the next six months rose to 107 from 100.9 – almost back to pre-crisis levels.
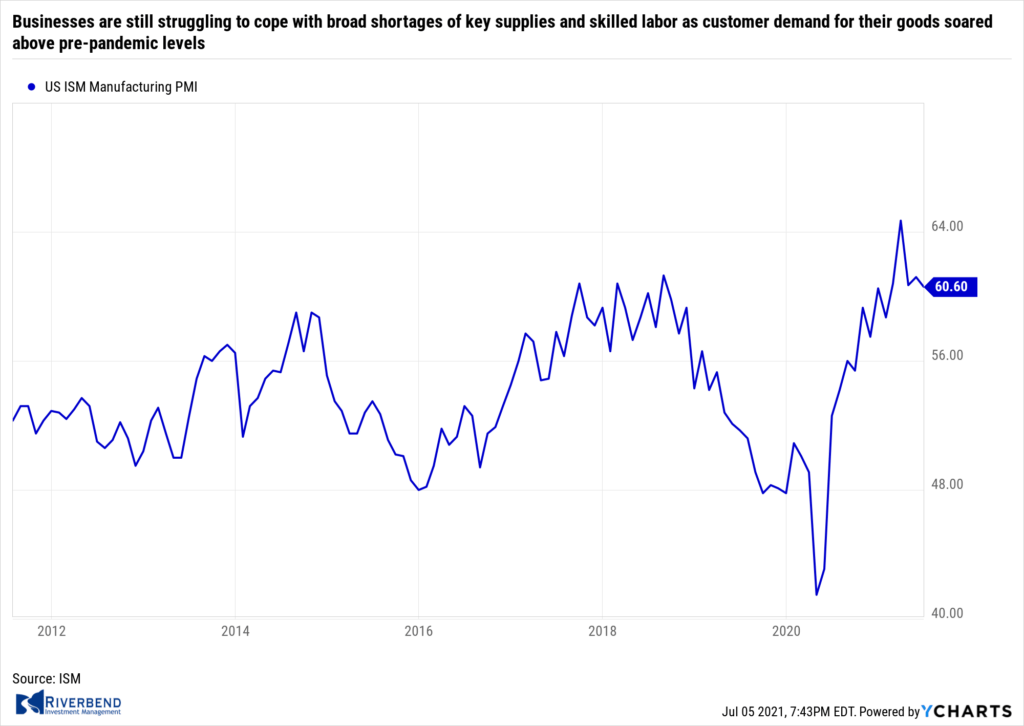
A survey of U.S. manufacturers slipped in May, according to the Institute for Supply Management (ISM). The ISM reported manufacturing activity dropped to 60.6 in June from 61.2 in May. Businesses are still struggling to cope with broad shortages of key supplies and skilled labor as customer demand for their goods soared above pre-pandemic levels. Although readings above 60 are considered exceptional, companies still had lots of concerns as orders continue to roll in. The survey highlighted that prices for many materials have risen sharply, products aren’t getting delivered on time, and in some cases companies simply lack enough labor to make as much as they can sell.
Chart of the Week:
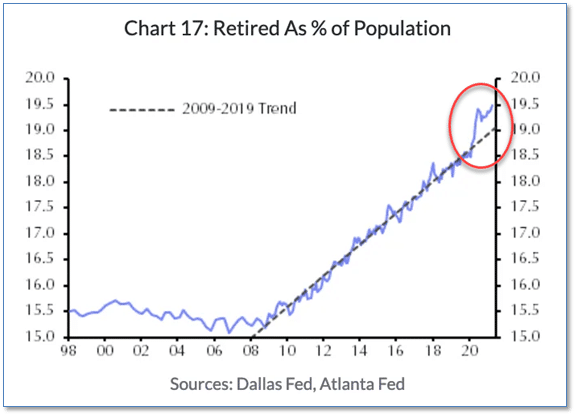
What if a large factor in the current worker shortage is…unexpectedly high retirements?
Oxford Economics and Capital Economics analysts have highlighted the huge jump in recent baby-boomer retirements, each one of which is another worker removed from the country’s workforce. Michael Pearce of Capital Economics writes “…that is equivalent to 2 million workers, which would explain more than half of the current shortfall in the labor force.”
Bob Schwartz of Oxford Economics notes that “…older households hold more wealth than younger ones, and the improved balance sheets of senior workers may well have tipped them over into retirement.” (Chart from Capital Economics)
Riverbend Indicators:

Each week we post notable changes to the various market indicators we follow.
- As a reading of our Bull-Bear Indicator for U.S. Equities (comparative measurements over a rolling one-year timeframe), we remain in Cyclical Bull territory.
- Counting up of the number of all our indicators that are ‘Up’ for U.S. Equities, the current tally is that four of four are Positive, representing a multitude of timeframes (two that can be solely days/weeks, or months+ at a time; another, a quarter at a time; and lastly, the {typically} years-long reading, that being the Cyclical Bull or Bear status).
The Week Ahead:
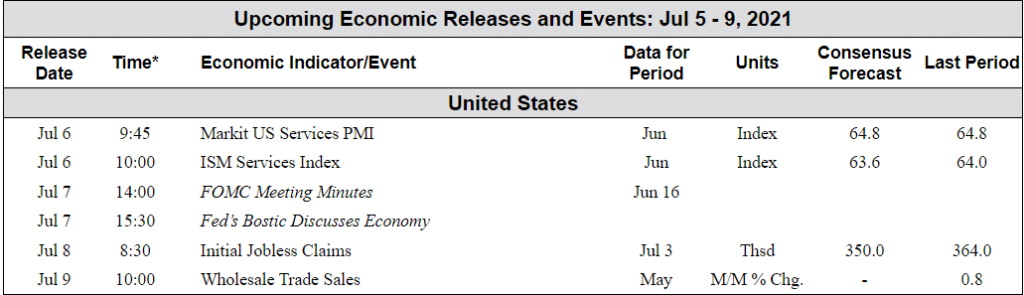
Source: Bloomberg
(Sources: All index- and returns-data from Yahoo Finance; news from Reuters, Barron’s, Wall St. Journal, Bloomberg.com, ft.com, guggenheimpartners.com, zerohedge.com, ritholtz.com, markit.com, financialpost.com, Eurostat, Statistics Canada, Yahoo! Finance, stocksandnews.com, marketwatch.com, wantchinatimes.com, BBC, 361capital.com, pensionpartners.com, cnbc.com, FactSet.)
[/fusion_text][/fusion_builder_column][/fusion_builder_row][/fusion_builder_container]


