[fusion_builder_container hundred_percent=”no” equal_height_columns=”no” menu_anchor=”” hide_on_mobile=”small-visibility,medium-visibility,large-visibility” class=”” id=”” background_color=”” background_image=”” background_position=”center center” background_repeat=”no-repeat” fade=”no” background_parallax=”none” parallax_speed=”0.3″ video_mp4=”” video_webm=”” video_ogv=”” video_url=”” video_aspect_ratio=”16:9″ video_loop=”yes” video_mute=”yes” overlay_color=”” video_preview_image=”” border_size=”” border_color=”” border_style=”solid” padding_top=”” padding_bottom=”” padding_left=”” padding_right=””][fusion_builder_row][fusion_builder_column type=”1_6″ spacing=”” center_content=”no” link=”” target=”_self” min_height=”” hide_on_mobile=”small-visibility,medium-visibility,large-visibility” class=”” id=”” hover_type=”none” border_size=”0″ border_color=”” border_style=”solid” border_position=”all” border_radius=”” box_shadow=”no” dimension_box_shadow=”” box_shadow_blur=”0″ box_shadow_spread=”0″ box_shadow_color=”” box_shadow_style=”” padding_top=”” padding_right=”” padding_bottom=”” padding_left=”” margin_top=”” margin_bottom=”” background_type=”single” gradient_start_color=”” gradient_end_color=”” gradient_start_position=”0″ gradient_end_position=”100″ gradient_type=”linear” radial_direction=”center” linear_angle=”180″ background_color=”” background_image=”” background_image_id=”” background_position=”left top” background_repeat=”no-repeat” background_blend_mode=”none” animation_type=”” animation_direction=”left” animation_speed=”0.3″ animation_offset=”” filter_type=”regular” filter_hue=”0″ filter_saturation=”100″ filter_brightness=”100″ filter_contrast=”100″ filter_invert=”0″ filter_sepia=”0″ filter_opacity=”100″ filter_blur=”0″ filter_hue_hover=”0″ filter_saturation_hover=”100″ filter_brightness_hover=”100″ filter_contrast_hover=”100″ filter_invert_hover=”0″ filter_sepia_hover=”0″ filter_opacity_hover=”100″ filter_blur_hover=”0″ last=”no”][/fusion_builder_column][fusion_builder_column type=”2_3″ layout=”1_1″ background_position=”left top” background_color=”” border_size=”” border_color=”” border_style=”solid” border_position=”all” spacing=”yes” background_image=”” background_repeat=”no-repeat” padding_top=”” padding_right=”” padding_bottom=”” padding_left=”” margin_top=”0px” margin_bottom=”0px” class=”” id=”” animation_type=”” animation_speed=”0.3″ animation_direction=”left” hide_on_mobile=”small-visibility,medium-visibility,large-visibility” center_content=”no” last=”no” min_height=”” hover_type=”none” link=””][fusion_text]
U.S. Markets: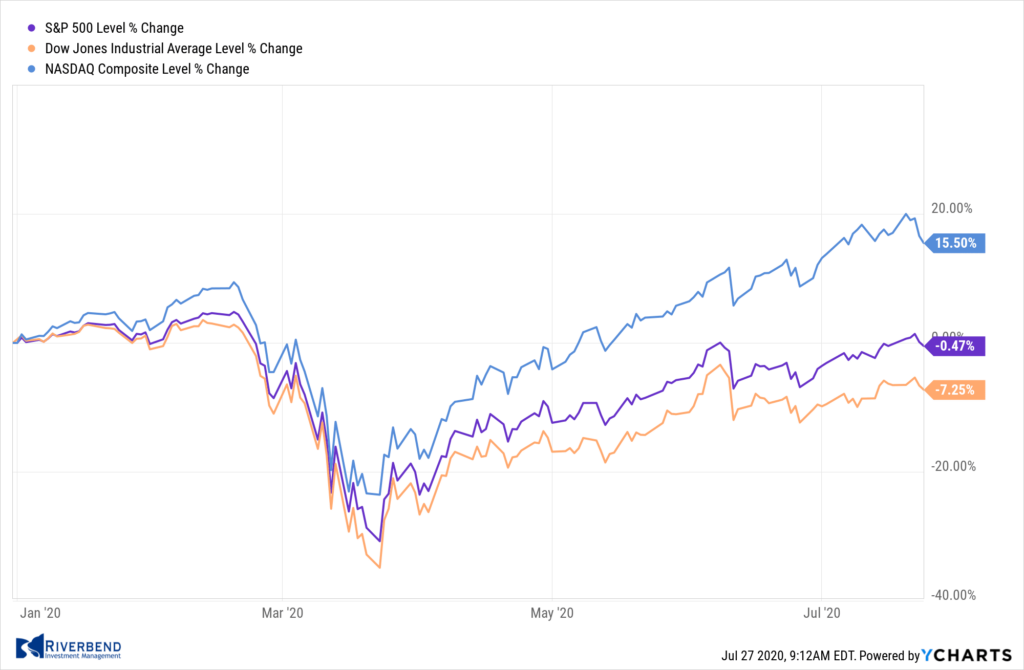
The major U.S. indexes finished the week mostly down after surrendering gains made early in the week. At its peak on Thursday the S&P 500 moved within about 3% of its all-time high set in February.
The Dow Jones Industrial Average gave up 202 points finishing the week at 26,470, a decline of -0.8%.
The technology-heavy NASDAQ Composite declined for a second consecutive week, ending down -1.3%.
By market cap, the indexes finished the week mixed. The large cap S&P 500 declined -0.3%, while the mid cap S&P 400 and small cap Russell 2000 rose 0.7% and declined -0.4%, respectively.
International Markets: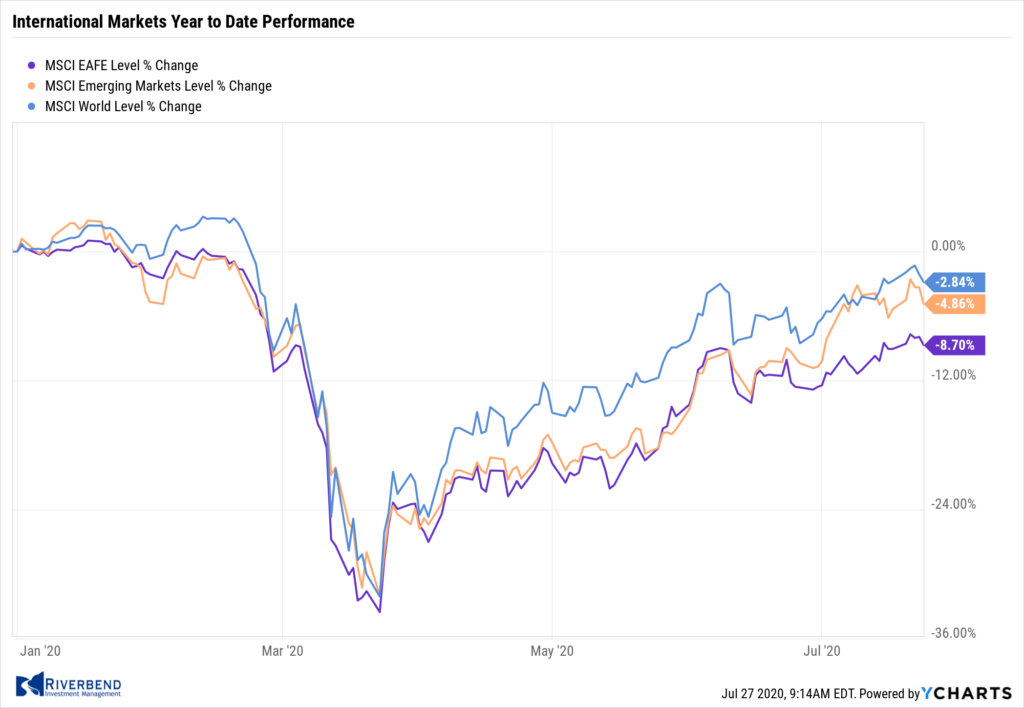
Canada’s TSX declined -0.8%, while the United Kingdom’s FTSE 100 retraced most of last week’s gain by giving up -2.6%.
On Europe’s mainland, major markets finished the week in the red. France’s CAC 40 fell -2.2%, Germany’s DAX declined -0.6%, and Italy’s Milan FTSE ended down -1.7%.
In Asia, China’s Shanghai Composite retreated ‑0.5% but Japan’s Nikkei rose 0.2%.
As grouped by Morgan Stanley Capital International, developed markets finished the week down -0.4%, while emerging markets rose 0.9%.
Commodities: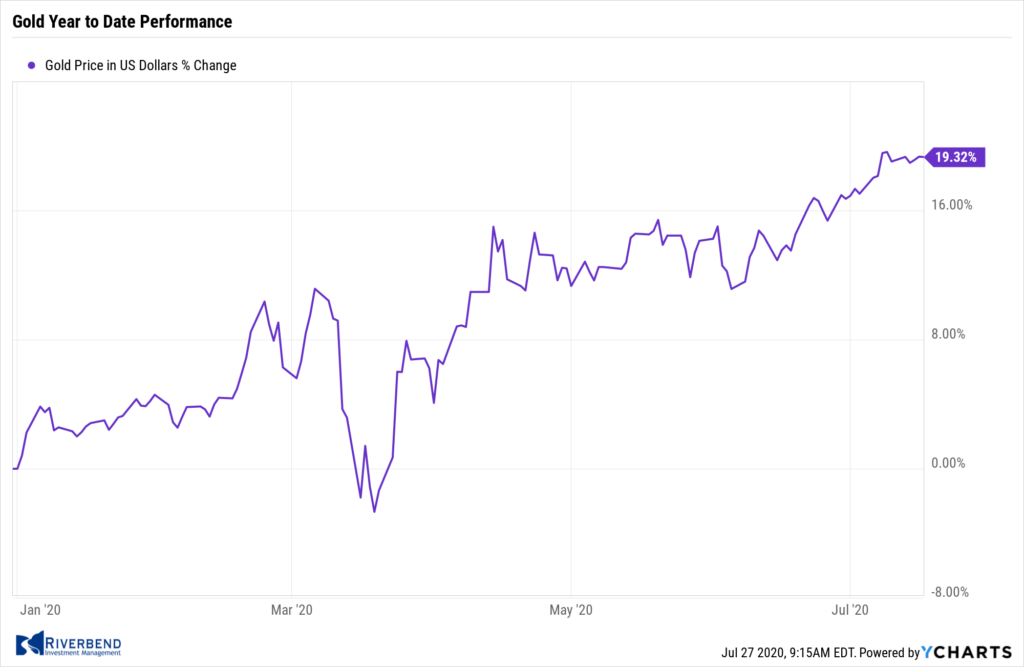
Precious metals surged last week as investors reacted to the flood of central bank stimulus in response to the ongoing coronavirus pandemic. Gold rose for a seventh consecutive week rising 4.8% to $1897 per ounce. Silver had its biggest move in years leaping 15.6% to $22.85 per ounce.
Oil rose for a second week, adding 1.3% to $41.29 per barrel of West Texas Intermediate crude.
The industrial metal copper, viewed by analysts as a barometer of world economic health due to its wide variety of uses, had its first down week in the last ten, declining -0.4%.
U.S. Economic News: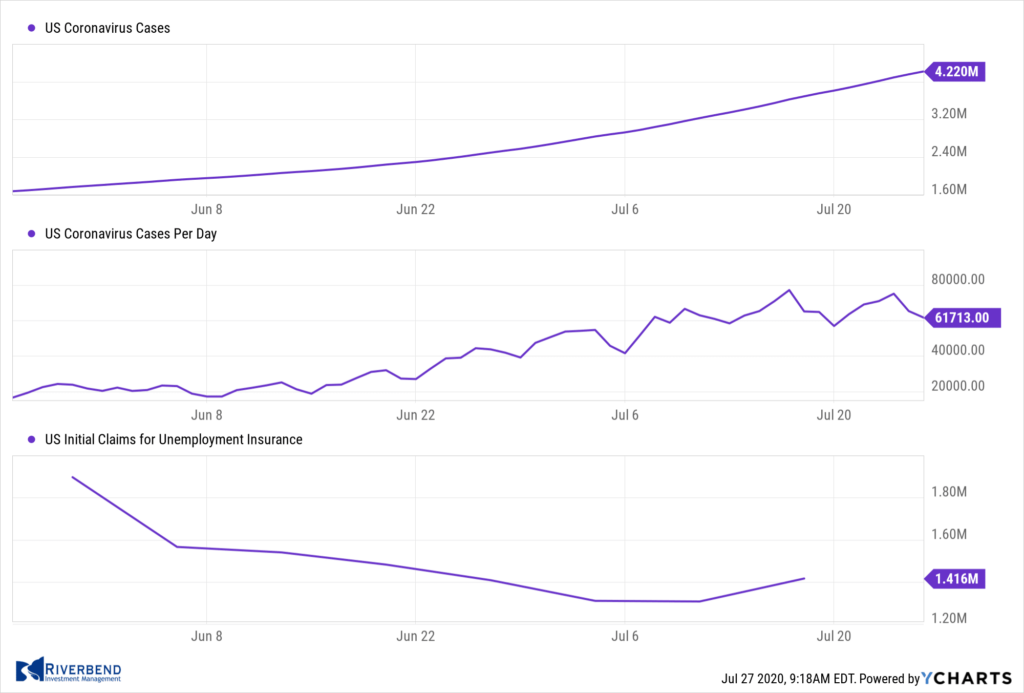
The Labor Department reported the number of Americans seeking first-time unemployment benefits increased by 109,000 last week to 1.416 million. Economists had expected 1.3 million new claims.
It was the first increase in 16 weeks, and a clear sign that the recent spike in COVID cases has resulted in another wave of layoffs. Continuing claims, which counts the number of people already collecting benefits, fell by 1.1 million to 16.197 million. That number is reported with a one-week delay.
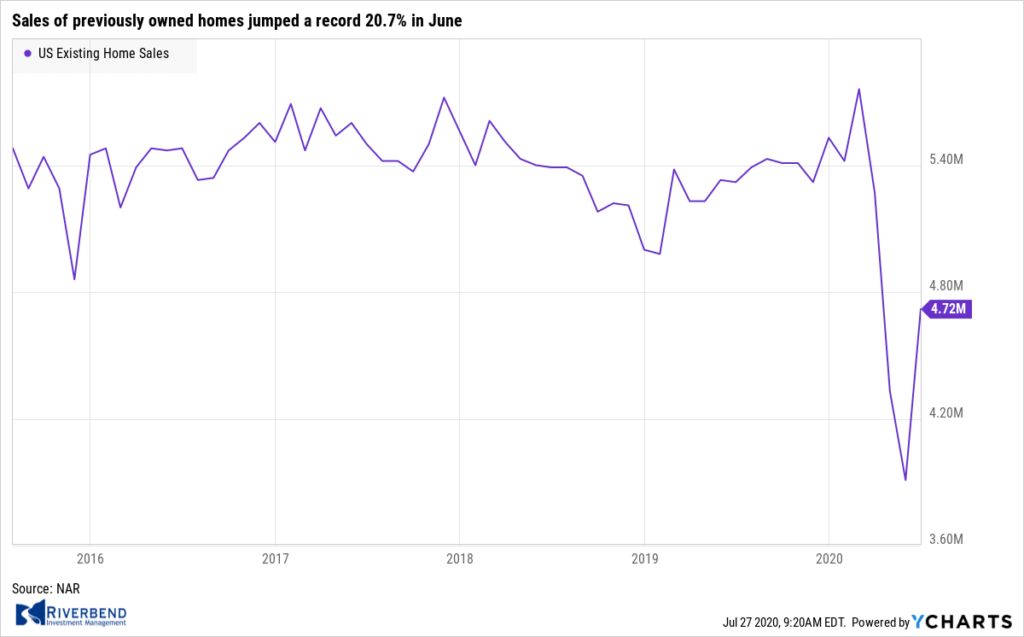 The National Association of Realtors (NAR) reported sales of previously owned homes jumped a record 20.7% in June to a 4.72-million-unit annual rate. Both single-family and condo/co-op sales posted record jumps. Furthermore, sales rose across all regions, led by the West.
The monthly increase reflects the pent-up demand from the pandemic and record low mortgage rates. Despite the increase, sales were still down 11.3% from the same time last year. Months of available supply went back down to 4.0 from 4.8 in June. Six months of inventory is generally considered to indicate a “balanced” housing market.
Sales of new homes jumped 13.8% last month to an annual rate of 776,000. The reading was its highest since July of 2007 and exceeded expectations for a reading of 702,000. The result followed a near 20% rebound the previous month resulting in the biggest back-to-back surge in sales since June 1980.
Year-over-year the momentum was weaker than before the pandemic, but remained up 6.9%. All four regions posted sales growth from the previous month, and three of the four regions were higher than a year ago. Months’ available supply slid from 5.5 months to 4.7—the thinnest inventory relative to demand in nearly four years.
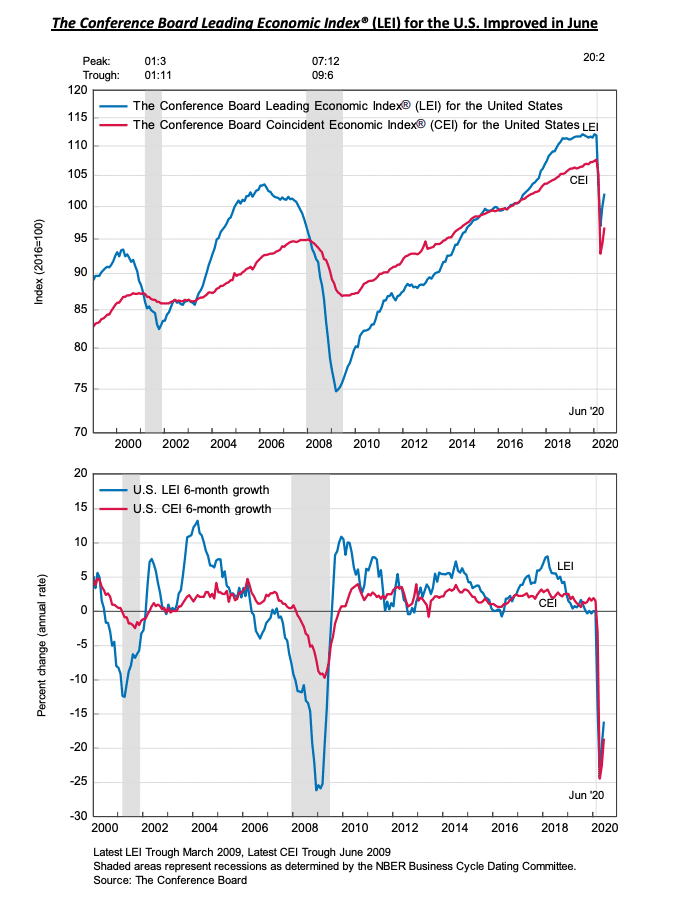 The Conference Board stated its leading economic indicators (LEI) index increased in June but the pace of its improvement slowed. The LEI rose 2% in June following a revised 3.2% increase in May and a 6.3% drop in April. The reading was below the consensus forecast of 2.4%.
Seven of its ten components made positive contributions. Despite the improvement, the indicator remains 8.9% below its pre-recession high. The six-month rate of change of the LEI improved to -8.4% from a low of -13.0% two months ago. The year-over-year change also ticked up to -8.6%. Both indicators suggest the negative economic momentum has diminished.
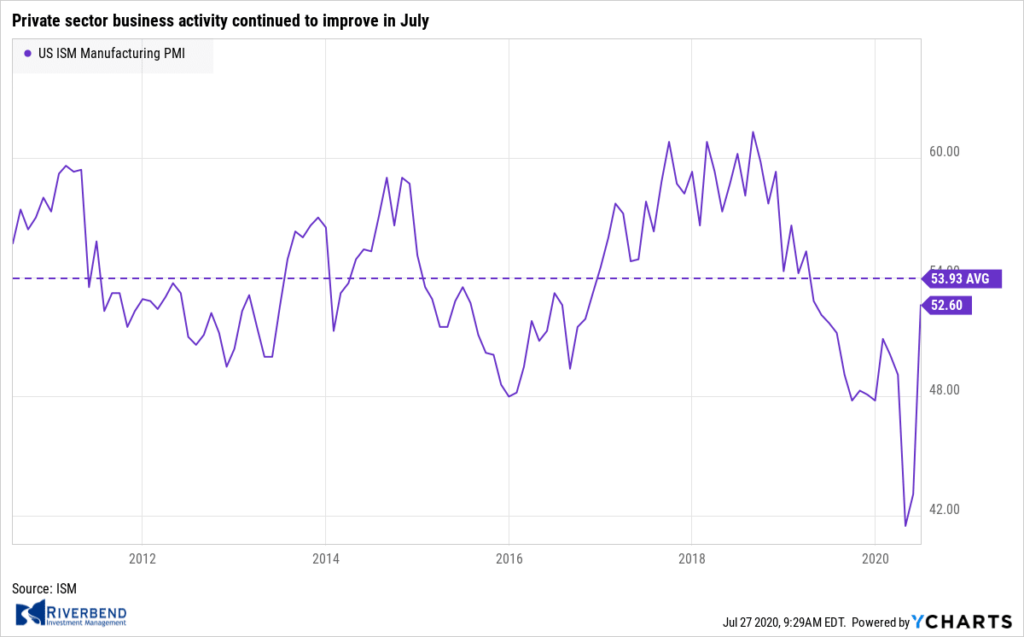 Research firm Markit reported private sector business activity continued to improve in July, a sign that the economic recovery is continuing at the start of the third quarter. Markit stated its flash Manufacturing Purchasing Managers’ Index (PMI) rose 1.5 points to 51.3—its highest level in six months, and in expansion for the first time since February.
Furthermore, its flash Services PMI increased 1.7 points to 49.6, also its best reading in six months, but still in contraction. Both manufacturers and service providers were more optimistic about the outlook over the coming year, linked to expectations that the pandemic situation will improve.
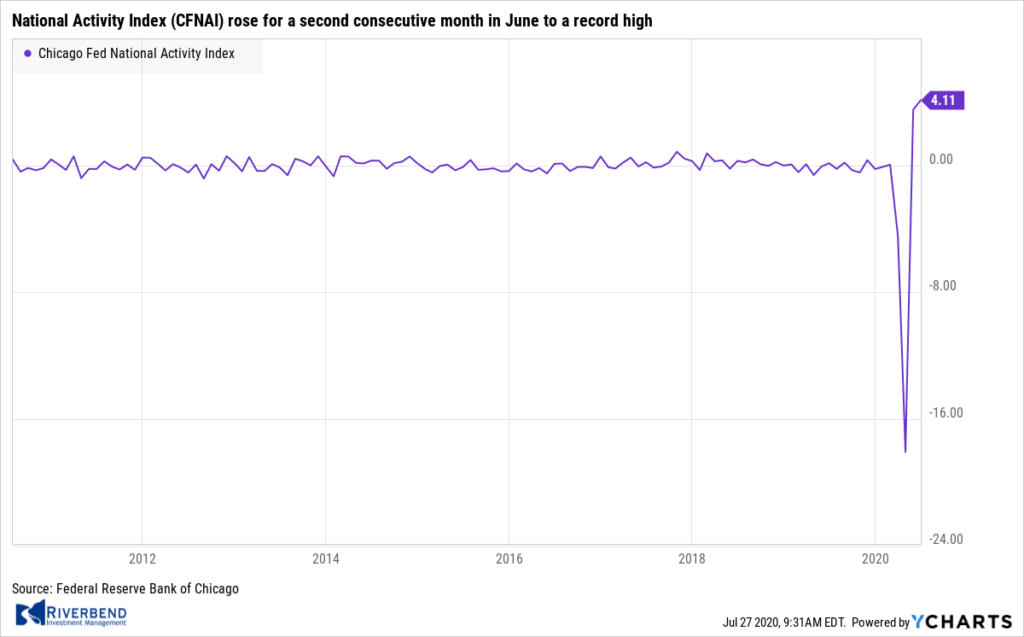 The Chicago Federal Reserve reported its National Activity Index (CFNAI) rose for a second consecutive month in June to a record high. The CFNAI gained 0.61 points to 4.11 showing that economic activity continued to recover after the initial rebound from the shutdown low in April. The increase in June was led by stronger production and employment-related indicators.
Of the 85 individual indicators, 54 made positive contributions to the index. As a result the Diffusion Index spiked 0.45 point, the most since August 1980. The three-month average of the CFNAI also improved but remained in deep negative territory at -3.49—its lowest reading since 1965.
Chart of the Week:
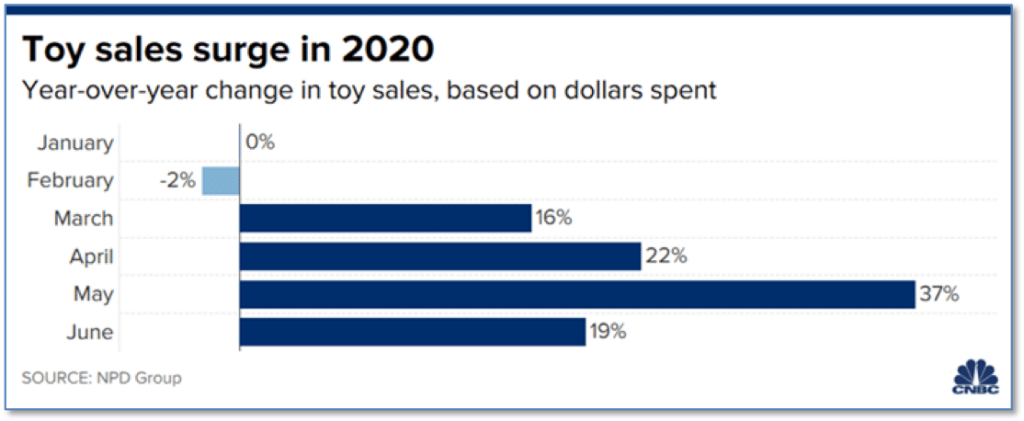
With a “heat dome” centered over the middle of the United States, it may not seem like “Christmas in July”. However, for the nation’s toy retailers Christmas has sure come early!
Toy sales were up a whopping 16% in the first half of the year compared to last as Americans did their best to occupy their time at home.
Juli Lennett, NPD Group toys industry analyst said “We would never see this kind of unprecedented growth – I’ve never seen it in my life.” Lennett expects toy sales will continue to climb in stride with the rise in coronavirus cases and get another boost from the strong possibility that schools around the country will return to online-based learning, delay school openings or stagger student schedules. (Chart from cnbc.com, data from NPD Group)
Riverbend Indicators Update:

Each week we post notable changes to the various market indicators we follow.
As a reading of our Bull-Bear Indicator for U.S. Equities (comparative measurements over a rolling one-year timeframe), we remain in Cyclical Bull territory.
Counting-up of the number of all our indicators that are ‘Up’ for U.S. Equities, the current tally is that four of four are Positive, representing a multitude of timeframes (two that can be solely days/weeks, or months+ at a time; another, a quarter at a time; and lastly, the {typically} years-long reading, that being the Cyclical Bull or Bear status).
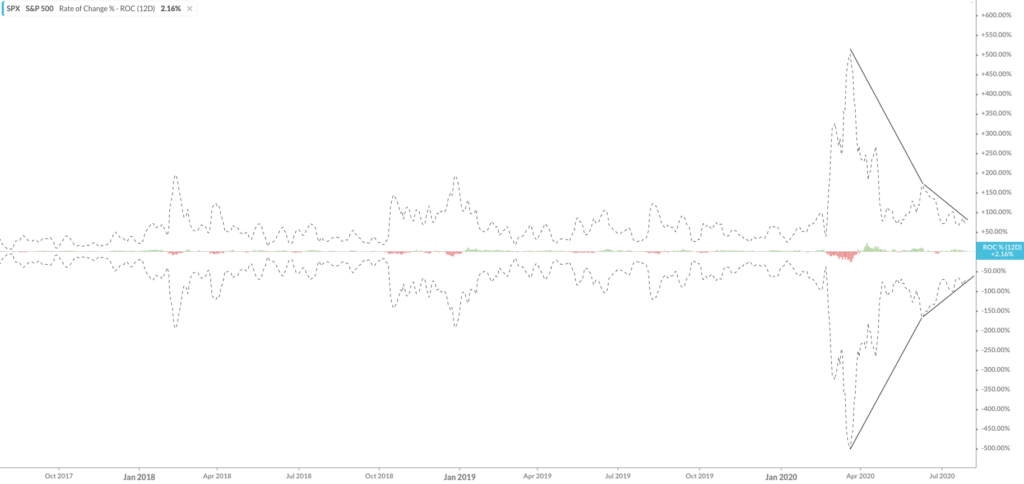
In addition, day to day volatility in the market continues to decrease. Despite the news surrounding an uptick in COVID case, the markets seem to be entering the usual summer slumber:
The Week Ahead:
Monday: U.S. Core Durable Goods Orders m/m +3.5% exp, +3.7% prior
Tuesday: U.S. CB Consumer Confidence 94.0 exp, 98.1 prior
Wednesday: U.S. Pending Home Sales m/m +15.6% exp, 44.3% prior FOMC Rate Decision and Press Conference
Thursday: German Prelim GDP q/q -9.0% exp, -2.2% prior U.S. Unemployment Claims 1.458 mln exp, 1.341 mln prior U.S. Advance GDP q/q -35.0% exp, -5.0% prior Chinese Manufacturing PMI 50.8 exp, 50.9 prior
Earnings: AMZN, AAPL, GOOG
Friday: U.S. Personal Spending m/m +5.3% exp, +8.2% prior Chicago PMI 44.5 exp, 36.6 prior
(Sources: All index- and returns-data from Yahoo Finance; news from Reuters, Barron’s, Wall St. Journal, Bloomberg.com, ft.com, guggenheimpartners.com, zerohedge.com, ritholtz.com, markit.com, financialpost.com, Eurostat, Statistics Canada, Yahoo! Finance, stocksandnews.com, marketwatch.com, wantchinatimes.com, BBC, 361capital.com, pensionpartners.com, cnbc.com, FactSet.)
[/fusion_text][/fusion_builder_column][/fusion_builder_row][/fusion_builder_container][fusion_builder_container hundred_percent=”no” hundred_percent_height=”no” hundred_percent_height_scroll=”no” hundred_percent_height_center_content=”yes” equal_height_columns=”no” menu_anchor=”” hide_on_mobile=”small-visibility,medium-visibility,large-visibility” status=”published” publish_date=”” class=”” id=”” border_size=”” border_color=”” border_style=”solid” margin_top=”” margin_bottom=”” padding_top=”” padding_right=”” padding_bottom=”” padding_left=”” gradient_start_color=”” gradient_end_color=”” gradient_start_position=”0″ gradient_end_position=”100″ gradient_type=”linear” radial_direction=”center” linear_angle=”180″ background_color=”” background_image=”” background_position=”center center” background_repeat=”no-repeat” fade=”no” background_parallax=”none” enable_mobile=”no” parallax_speed=”0.3″ background_blend_mode=”none” video_mp4=”” video_webm=”” video_ogv=”” video_url=”” video_aspect_ratio=”16:9″ video_loop=”yes” video_mute=”yes” video_preview_image=”” filter_hue=”0″ filter_saturation=”100″ filter_brightness=”100″ filter_contrast=”100″ filter_invert=”0″ filter_sepia=”0″ filter_opacity=”100″ filter_blur=”0″ filter_hue_hover=”0″ filter_saturation_hover=”100″ filter_brightness_hover=”100″ filter_contrast_hover=”100″ filter_invert_hover=”0″ filter_sepia_hover=”0″ filter_opacity_hover=”100″ filter_blur_hover=”0″][fusion_builder_row][/fusion_builder_row][/fusion_builder_container]


