[fusion_builder_container hundred_percent=”no” equal_height_columns=”no” menu_anchor=”” hide_on_mobile=”small-visibility,medium-visibility,large-visibility” class=”” id=”” background_color=”” background_image=”” background_position=”center center” background_repeat=”no-repeat” fade=”no” background_parallax=”none” parallax_speed=”0.3″ video_mp4=”” video_webm=”” video_ogv=”” video_url=”” video_aspect_ratio=”16:9″ video_loop=”yes” video_mute=”yes” overlay_color=”” video_preview_image=”” border_size=”” border_color=”” border_style=”solid” padding_top=”” padding_bottom=”” padding_left=”” padding_right=””][fusion_builder_row][fusion_builder_column type=”1_6″ spacing=”” center_content=”no” link=”” target=”_self” min_height=”” hide_on_mobile=”small-visibility,medium-visibility,large-visibility” class=”” id=”” hover_type=”none” border_size=”0″ border_color=”” border_style=”solid” border_position=”all” border_radius=”” box_shadow=”no” dimension_box_shadow=”” box_shadow_blur=”0″ box_shadow_spread=”0″ box_shadow_color=”” box_shadow_style=”” padding_top=”” padding_right=”” padding_bottom=”” padding_left=”” margin_top=”” margin_bottom=”” background_type=”single” gradient_start_color=”” gradient_end_color=”” gradient_start_position=”0″ gradient_end_position=”100″ gradient_type=”linear” radial_direction=”center” linear_angle=”180″ background_color=”” background_image=”” background_image_id=”” background_position=”left top” background_repeat=”no-repeat” background_blend_mode=”none” animation_type=”” animation_direction=”left” animation_speed=”0.3″ animation_offset=”” filter_type=”regular” filter_hue=”0″ filter_saturation=”100″ filter_brightness=”100″ filter_contrast=”100″ filter_invert=”0″ filter_sepia=”0″ filter_opacity=”100″ filter_blur=”0″ filter_hue_hover=”0″ filter_saturation_hover=”100″ filter_brightness_hover=”100″ filter_contrast_hover=”100″ filter_invert_hover=”0″ filter_sepia_hover=”0″ filter_opacity_hover=”100″ filter_blur_hover=”0″ last=”no”][/fusion_builder_column][fusion_builder_column type=”2_3″ layout=”1_1″ background_position=”left top” background_color=”” border_size=”” border_color=”” border_style=”solid” border_position=”all” spacing=”yes” background_image=”” background_repeat=”no-repeat” padding_top=”” padding_right=”” padding_bottom=”” padding_left=”” margin_top=”0px” margin_bottom=”0px” class=”” id=”” animation_type=”” animation_speed=”0.3″ animation_direction=”left” hide_on_mobile=”small-visibility,medium-visibility,large-visibility” center_content=”no” last=”no” min_height=”” hover_type=”none” link=””][fusion_text]
U.S. Markets: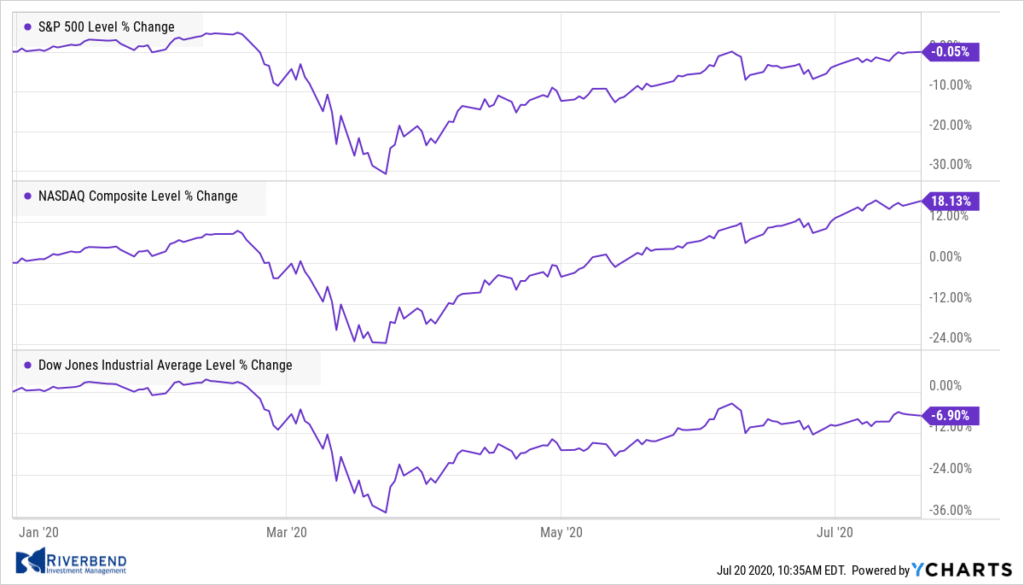
The major U.S. indexes ended the week mixed. Nothing “mixed” about the benchmark large cap S&P 500 index, however, which marked its third consecutive week of gains and reached levels not seen since the market sell-off began in late February. The Dow Jones Industrial Average rose nearly 600 points to finish the week at 26,672, a gain of 2.3%. The technology-heavy NASDAQ Composite retreated -1.1% following back-to-back weekly gains of more than 4%.
By market cap, the large cap S&P 500 added 1.2%, while the mid cap S&P 400 and small cap Russell 2000 each gained 3.6%.
International Markets: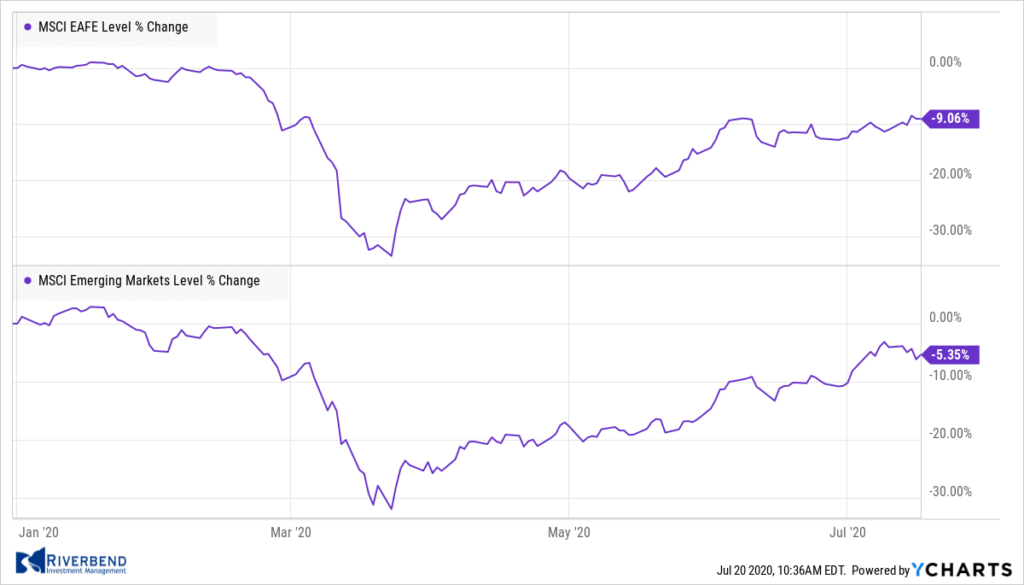
Major international markets were also mixed. Canada’s TSX rose 2.6% along with the United Kingdom’s FTSE 100 which rose 3.2%. France’s CAC added 2.0% and Germany’s DAX finished up 2.3%.
In Asia, China’s Shanghai Composite retreated -5.0%, following last week’s monstrous 9.5% gain. Japan’s Nikkei ended the week up 1.8%.
As grouped by Morgan Stanley Capital International, developed markets rose 1.9%, while emerging markets declined -1.1%.
Commodities: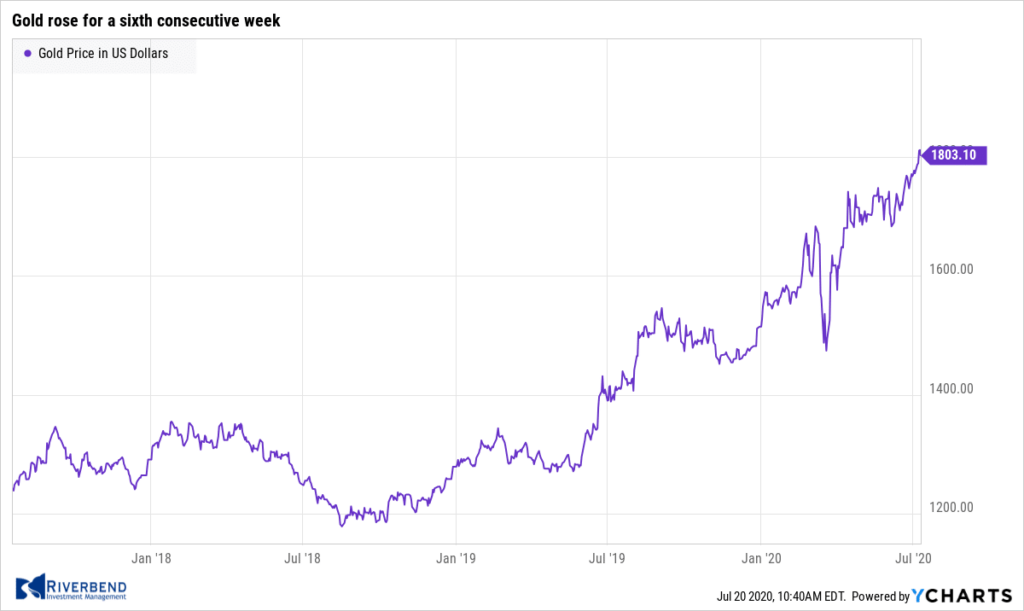
Gold continued its rally. The precious metal rose a sixth consecutive week, adding 0.5% to finish at $1,810.00 per ounce. Similarly, Silver finished up 3.7% to $19.76 per ounce.
Oil’s huge rally from the depths of April continued to sputter. West Texas Intermediate crude rose 0.5% to $40.75 per barrel.
The industrial metal copper, known as “Dr. Copper” by some analysts for its alleged ability to forecast global economic trends, closed up for a ninth consecutive week, rising 0.24%.
U.S. Economic News: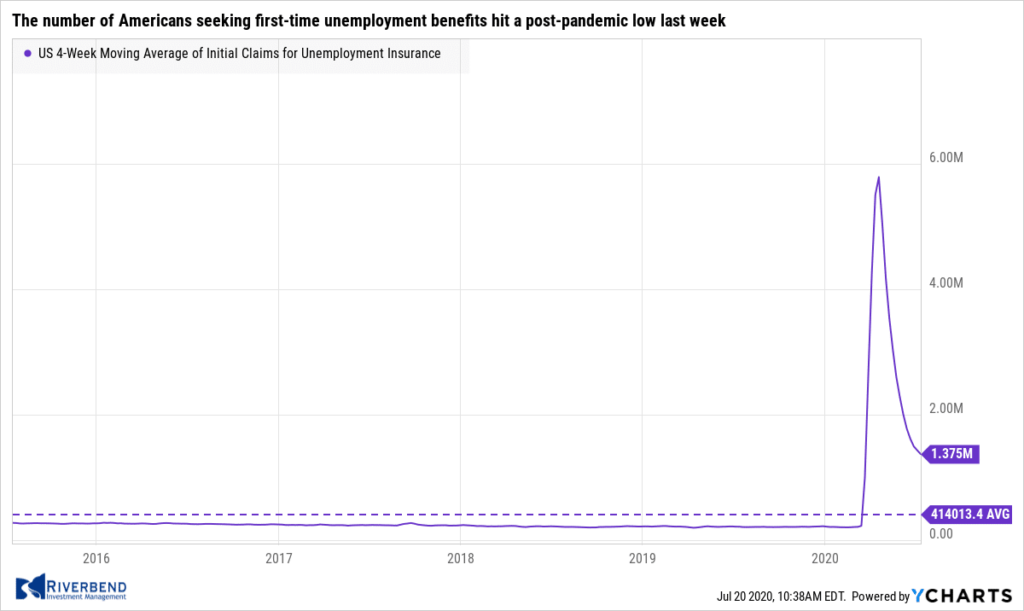
The number of Americans seeking first-time unemployment benefits hit a post-pandemic low last week, but layoffs are expected to rebound as states impose business restrictions. The Labor Department reported initial jobless claims fell by 10,000 to 1.3 million. Economists had expected 1.24 million new claims. Continuing claims, which counts the number of people already receiving benefits fell by 422,000 to 17.34 million. That reading is the lowest since mid-April. Ian Shepherdson, chief economist at Pantheon Macroeconomics wrote in a note, “The trend in initial jobless claims has now just about stopped falling. Next week could easily see an increase, for the first time since March, in the wake of the continued gradual re-imposition of restrictions across the South and parts of the West.”
Confidence among the nation’s home builders rose in July as Americans look to leave the big cities in favor of the suburbs.
The National Association of Home Builders (NAHB) reported its monthly confidence index rose 14 points to a reading of 72 in July. Readings above 50 indicate improving confidence, while numbers below represent a declining outlook. In April, the index had fallen to its lowest level since June 2012. In the details of the report, expectations of current single-family home sales jumped 16 points to 79. Builders’ views on the traffic of prospective buyers moved 15 points higher to a reading of 58.
Expectations of home sales in the next six months improved by a smaller amount, rising only seven points to a reading of 75. NAHB Chairman Chuck Fowke, a custom home builder from Tampa, Fla, said in the report, “Builders are seeing strong traffic and lots of interest in new construction as existing home inventory remains lean.”
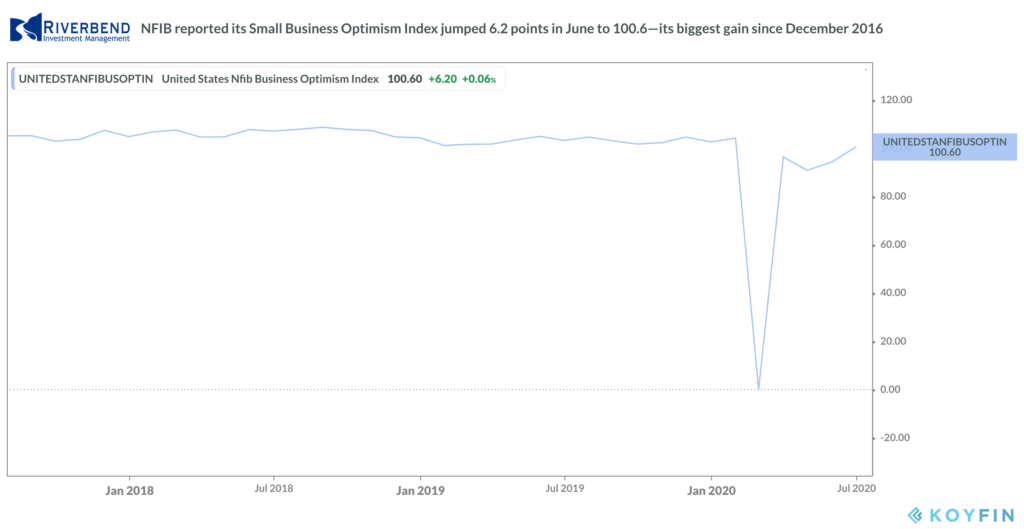 The nation’s small business owners grew more optimistic last month, however a fresh spike in coronavirus cases and tightening restrictions in states such as California and Texas may snuff out hopes for a faster economic recovery. The National Federation of Independent Business (NFIB) reported its Small Business Optimism Index jumped 6.2 points in June to 100.6—its biggest gain since December 2016.
The reading took the NFIB index closer to where it was in February, just before the start of the recession. The surge in optimism reflected the partial reopening of the economy and the impact of the “Paycheck Protection Program” loans. However, with the recent spike in COVID cases, analysts expect some of this optimism to reverse in the coming months.
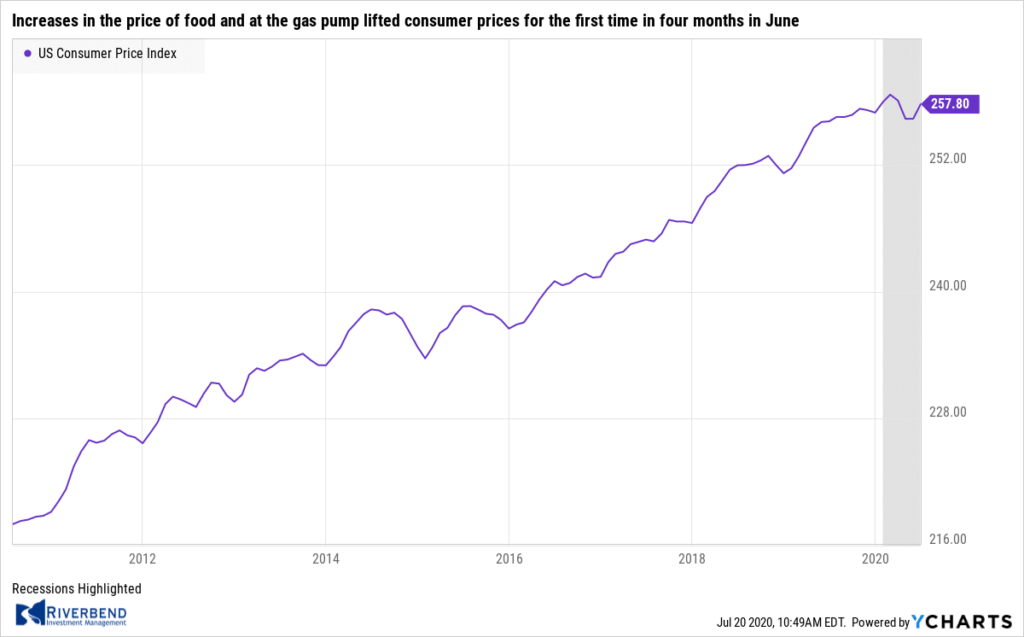 Increases in the price of food and at the gas pump lifted consumer prices for the first time in four months in June. The Bureau of Labor Statistics reported its Consumer Price Index (CPI) rebounded 0.6% last month. Economists had expected a reading of 0.5%. Energy prices surged the most in 11 years jumping 5.1%, while food prices advanced 0.6%. Gasoline is still fairly cheap, however, with prices down more than 23% compared to a year earlier. Core CPI, which excludes the volatile food and energy categories, rose 0.2% – also slightly above the consensus of 0.1%.
Year-over-year, core CPI eased to just 1.2%, its slowest pace since February 2011. Despite the Federal Reserve’s massive monetary stimulus in response to the coronavirus pandemic, analysts don’t expect inflation to become a problem anytime soon. Michael Gregory, Deputy Chief Economist at BMO Capital Markets wrote, “Inflation is not going to be an issue for a long while.”
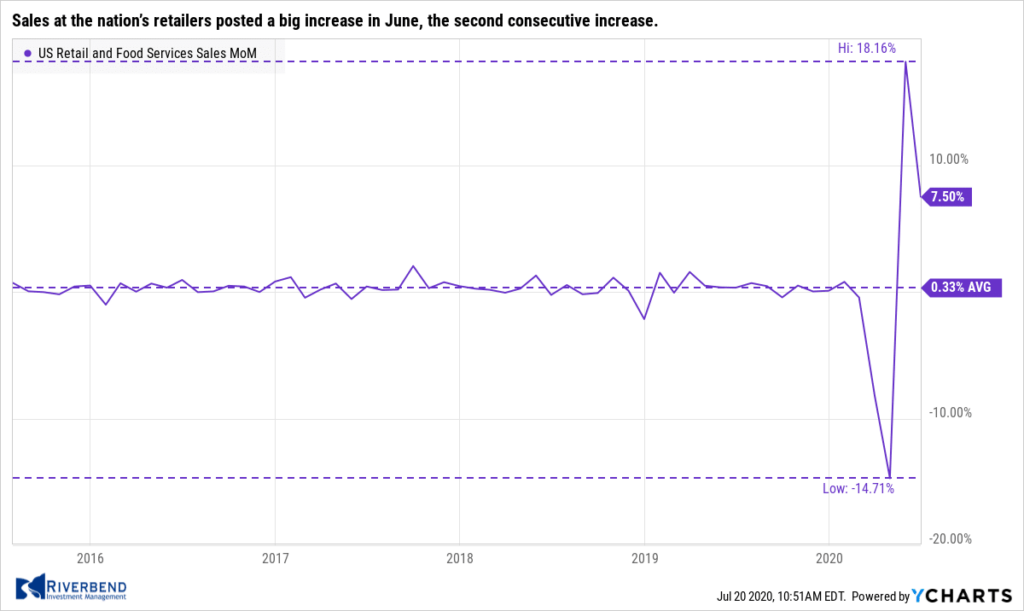 Sales at the nation’s retailers posted a big increase in June, the second consecutive increase. The Commerce Department reported retail sales climbed 7.5% last month, following a record 18.2% increase in May. Economists had expected a 5.4% increase. Sales, however, still have yet to return to pre-crisis trends. In the report, sales jumped 8.2% at auto dealers, which have gotten a big boost from plunging interest rates. Sales also increased 15.3% at gas stations largely because of a steady increase in the price of oil after it fell to an 18-year low earlier in the year. If autos and gasoline are stripped out, retail sales still rose a robust 6.7% last month.
The Federal Reserve’s Beige Book, a collection of anecdotal reports from each of the Federal Reserve’s member banks, showed economic activity increased in almost all districts.
The Federal Reserve’s Beige Book, a collection of anecdotal reports from each of the Federal Reserve’s member banks, showed economic activity increased in almost all districts. One caveat: business contacts remained highly uncertain about the outlook for the U.S. economy, as it was unclear how long the crisis would last. Overall, while the Beige Book was more positive than its prior report in May, there was no sense that the economy was out of the woods.
Tom Simons, economist at Jefferies wrote, “Although the early days of the “reopening” were quite strong and quite encouraging, that pace of activity is not sustainable. Getting back to any sense of a normal pace of economic activity is going to take a long time, and there is an enormous amount of slack that the economy needs to absorb before any sort of policy response is warranted.”
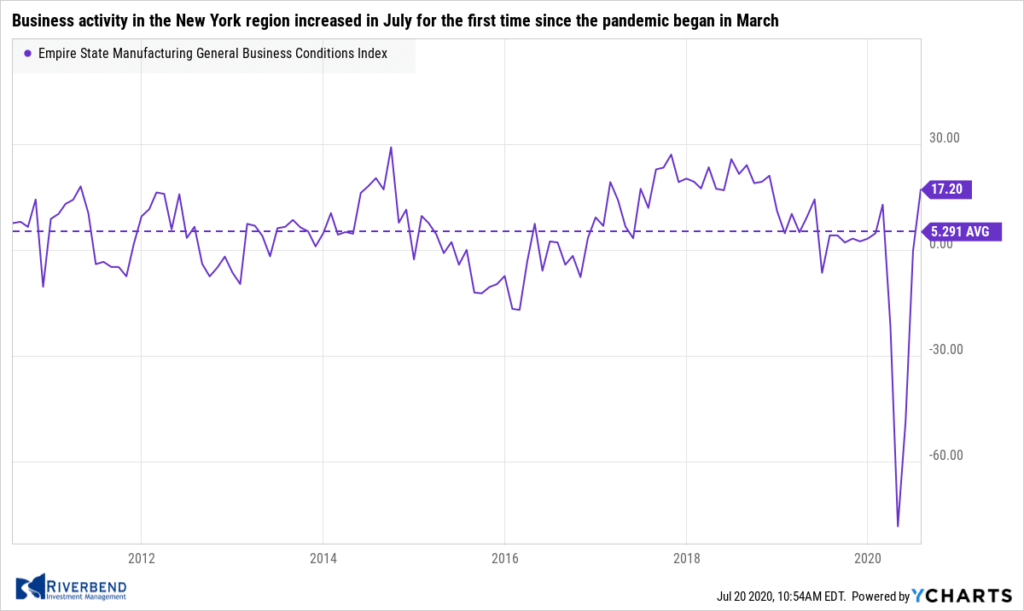 Business activity in the New York region increased in July for the first time since the pandemic began in March according to the New York Fed’s Empire State Manufacturing Survey. The Empire State business conditions index rose to 17.2 in July, its first positive reading since February. A reading above zero indicates improving conditions. Economists had expected a reading of 8.9. Forty-one percent of manufacturers reported that conditions were better in early July than in June, up from 36% in the prior survey. Overall, the Empire State index has improved steadily since hitting a record low of -78.2 in April.
Chart of the Week:
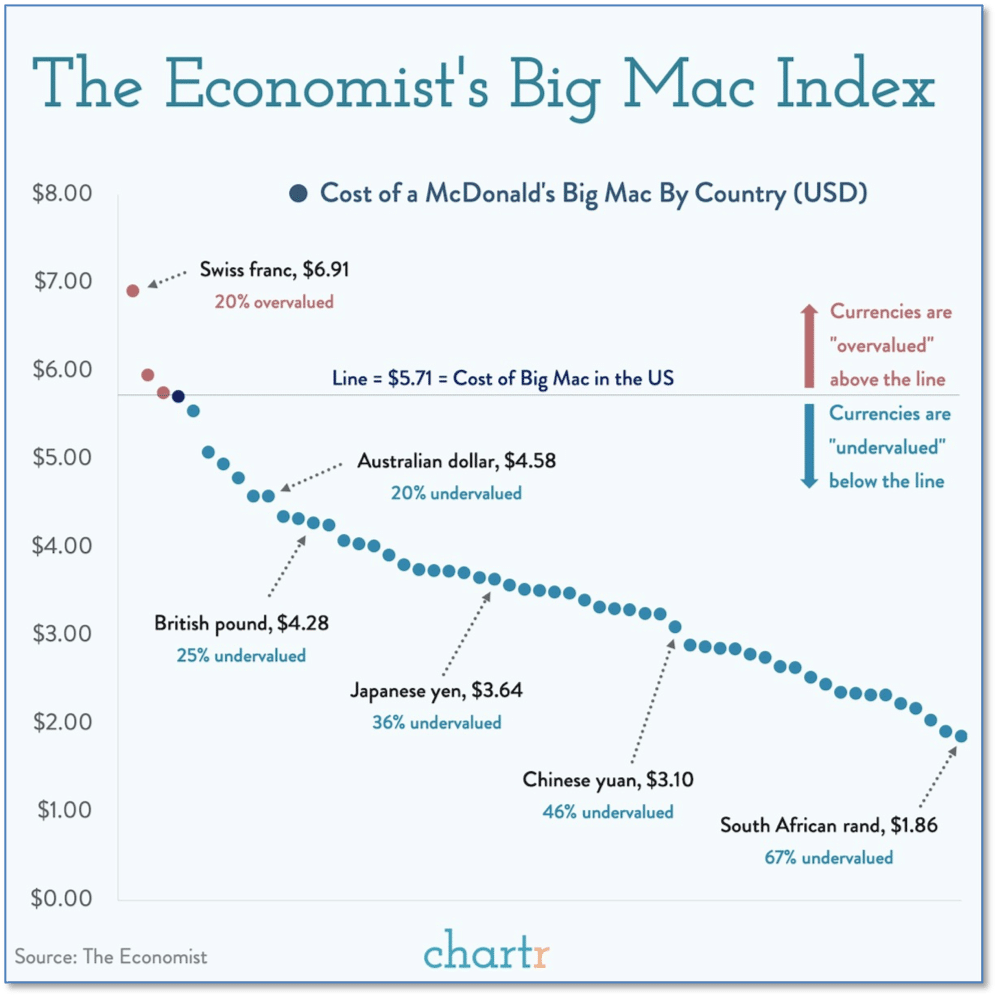 When measuring the “value” of a currency, most think of a traditional yardstick such as gold. However, economists sometimes also look at more readily and widely available commodities for their studies. The Economist just released the latest version of its Big Mac Index, which tracks the cost of a McDonald’s Big Mac around the world.
In this year’s Big Mac Index, you’ll find that the Swiss are paying the Swiss Franc equivalent of $6.91 for a Big Mac, making it the most “expensive” Big Mac on the planet.
But Big Mac fans everywhere might be glad to know that to know you can still get a Big Mac for less than two bucks…in South Africa. There, you’ll pay just the Rand equivalent of $1.86! (Chart by chrtr.co, data from The Economist)
Riverbend Indicators Update:

Each week we post notable changes to the various market indicators we follow.
As a reading of our Bull-Bear Indicator for U.S. Equities (comparative measurements over a rolling one-year timeframe), we remain in Cyclical Bull territory.
Counting-up of the number of all our indicators that are ‘Up’ for U.S. Equities (see Fig. 3), the current tally is that four of four are Positive, representing a multitude of timeframes (two that can be solely days/weeks, or months+ at a time; another, a quarter at a time; and lastly, the {typically} years-long reading, that being the Cyclical Bull or Bear status).
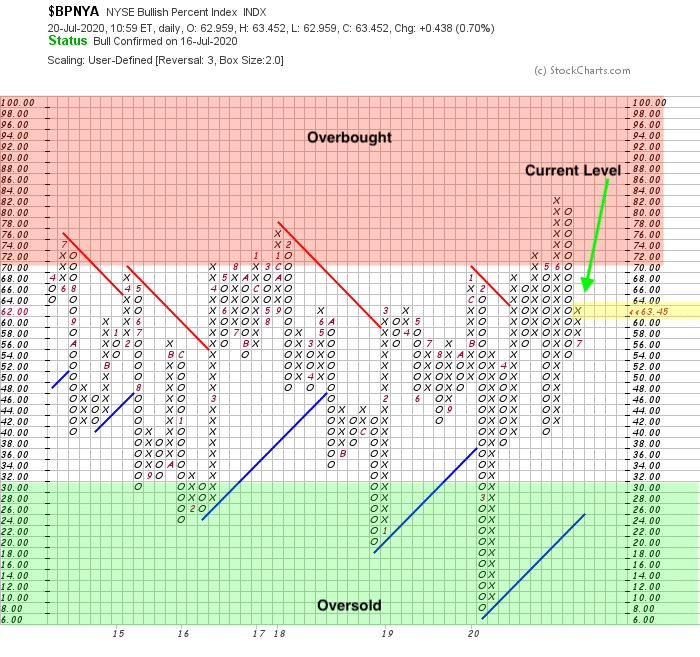
The Bullish Percent Index, or BPI, is a breadth indicator that shows the percentage of stocks on Point & Figure Buy Signals. It helps up get a better understanding of the relationship between buyers and sellers. The NYSE Bullish Percent Index is currently rising (an “X” on the chart indicates that buyers are in control of the market). Values above 70 are considered overbought.
The Week Ahead:
Monday: Earnings: IBM, HAL, MAN
Tuesday: Canadian Core Retail Sales m/m N/A exp, -22.0% prior Earnings: PM, LMT, NVS, UAL, KO, UBS, TXN
Wednesday: U.S. Housing Price Index m/m +0.4% exp, +0.2% prior U.S. Existing Home Sales 4.80 mln, 3.91 mln prior Earnings: MSFT, HCA, SU, TSLA, WHR, LVS, KMI
Thursday: U.S. Unemployment Claims 1.28 mln exp, 1.30 mln prior U.S. CB Leading Index m/m +2.1% exp, +2.8% prior prior Australian Manufacturing PMI N/A exp, 51.2 prior Earnings: T, AAL, DOW, LUV, UNP, KMB, BX
Friday: German Flash Manufacturing PMI 48.0 exp, 45.2 prior French Services PMI 52.3 exp, 50.7 prior U.S. Flash Manufacturing PMI 52.0 exp, 49.8 prior U.S. Flash Services PMI 51.0 exp, 47.9 prior
(Sources: All index- and returns-data from Yahoo Finance; news from Reuters, Barron’s, Wall St. Journal, Bloomberg.com, ft.com, guggenheimpartners.com, zerohedge.com, ritholtz.com, markit.com, financialpost.com, Eurostat, Statistics Canada, Yahoo! Finance, stocksandnews.com, marketwatch.com, wantchinatimes.com, BBC, 361capital.com, pensionpartners.com, cnbc.com, FactSet.)
[/fusion_text][/fusion_builder_column][/fusion_builder_row][/fusion_builder_container]


